| Param | Original file | Final file |
|---|---|---|
| Filename | modeM0/AS1A03_084T01_9000001382_09702cztM0_level2.evt | modeM0/AS1A03_084T01_9000001382_09702cztM0_level2_quad_clean.evt |
| Size (bytes) | 547,073,280 | 95,336,640 |
| Size | 521.7 MB | 90.9 MB |
| Events in quadrant A | 3,945,818 | 593,692 |
| Events in quadrant B | 3,970,713 | 602,966 |
| Events in quadrant C | 3,775,641 | 589,820 |
| Events in quadrant D | 4,357,248 | 569,382 |
| Mode SS | |||
|---|---|---|---|
| Quadrant | BADHDUFLAG | Total packets | Discarded packets |
| A | 0 | 160 | 0 |
| B | 0 | 160 | 0 |
| C | 0 | 160 | 0 |
| D | 0 | 160 | 0 |
| Mode M0 | |||
|---|---|---|---|
| Quadrant | BADHDUFLAG | Total packets | Discarded packets |
| A | 0 | 16469 | 4 |
| B | 0 | 16662 | 3 |
| C | 0 | 16466 | 3 |
| D | 0 | 17948 | 5 |
| Mode M9 | |||
|---|---|---|---|
| Quadrant | BADHDUFLAG | Total packets | Discarded packets |
| A | 0 | 6 | 0 |
| B | 0 | 6 | 0 |
| C | 0 | 6 | 0 |
| D | 0 | 6 | 0 |
| Quadrant | Total seconds | Saturated seconds | Saturation percentage |
|---|---|---|---|
| A | 7634 | 338 | 4.427561% |
| B | 7634 | 337 | 4.414462% |
| C | 7634 | 230 | 3.012837% |
| D | 7633 | 337 | 4.415040% |
Noise dominated data is calculated using 1-second bins in cleaned event files. If a bin has >2000 counts, and if more than 50% of those come from <1% of pixels, then it is considered to be noise-dominated and hence unusable.
| Quadrant | # 1 sec bins | Bins with >0 counts | Bins with >2000 counts | High rate bins dominated by noise | Noise dominated (total time) | Noise dominated (detector-on time) | Marked lightcurve |
|---|---|---|---|---|---|---|---|
| A | 8224 | 7639 | 4 | 4 | 0.05% | 0.05% | 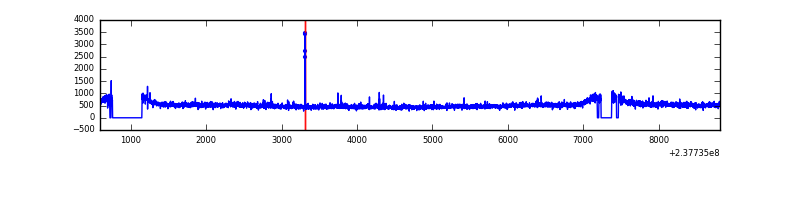 |
| B | 8224 | 7639 | 2 | 2 | 0.02% | 0.03% | 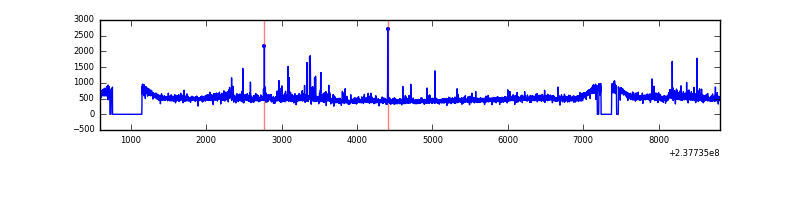 |
| C | 8224 | 7639 | 14 | 14 | 0.17% | 0.18% | 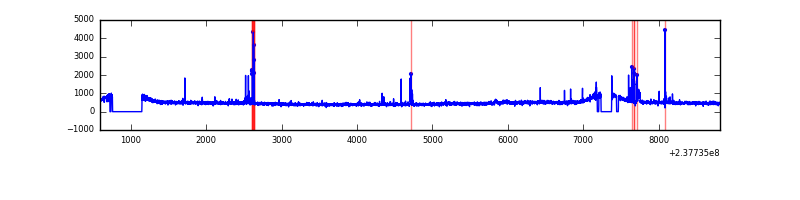 |
| D | 8224 | 7639 | 47 | 47 | 0.57% | 0.62% | 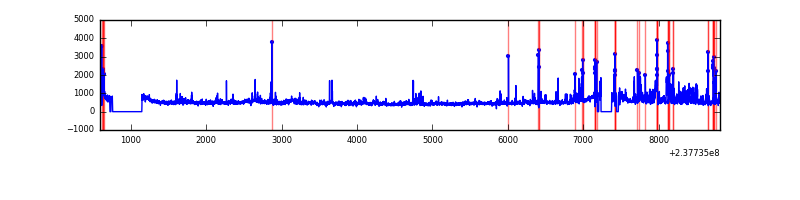 |
Top three noisy pixels from each quadrant. If the there are fewer than three noisy pixels in the level2.evt file, extra rows are filled as -1
| Pixel properties | Quadrant properties | ||||||
|---|---|---|---|---|---|---|---|
| Quadrant | DetID | PixID | Counts | Sigma | Mean | Median | Sigma |
| A | 1 | 162 | 134515 | 678.81 | 949 | 927 | 196.8 |
| A | 1 | 178 | 46670 | 232.44 | 949 | 927 | 196.8 |
| A | 1 | 161 | 40015 | 198.62 | 949 | 927 | 196.8 |
| B | 0 | 214 | 74689 | 398.46 | 952 | 927 | 185.1 |
| B | 0 | 187 | 47852 | 253.48 | 952 | 927 | 185.1 |
| B | 10 | 245 | 41661 | 220.04 | 952 | 927 | 185.1 |
| C | 14 | 234 | 70743 | 323.03 | 921 | 920 | 216.2 |
| C | 10 | 22 | 67396 | 307.55 | 921 | 920 | 216.2 |
| C | 9 | 237 | 32367 | 145.49 | 921 | 920 | 216.2 |
| D | 1 | 52 | 610044 | 2690.34 | 915 | 891 | 226.4 |
| D | 8 | 195 | 132935 | 583.18 | 915 | 891 | 226.4 |
| D | 2 | 152 | 60157 | 261.75 | 915 | 891 | 226.4 |
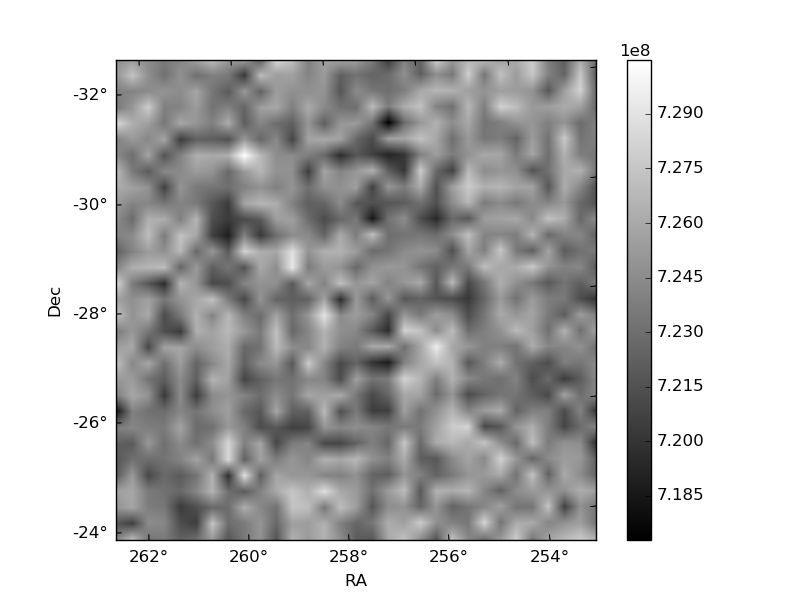
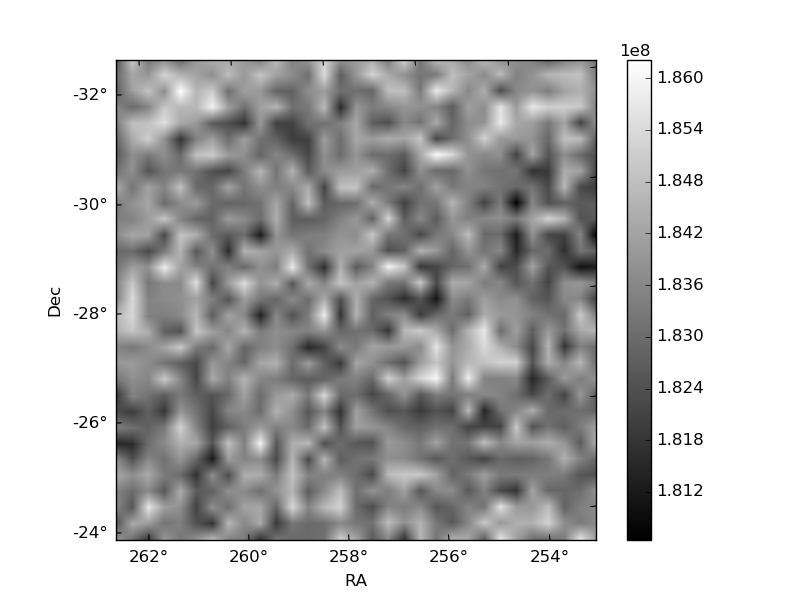
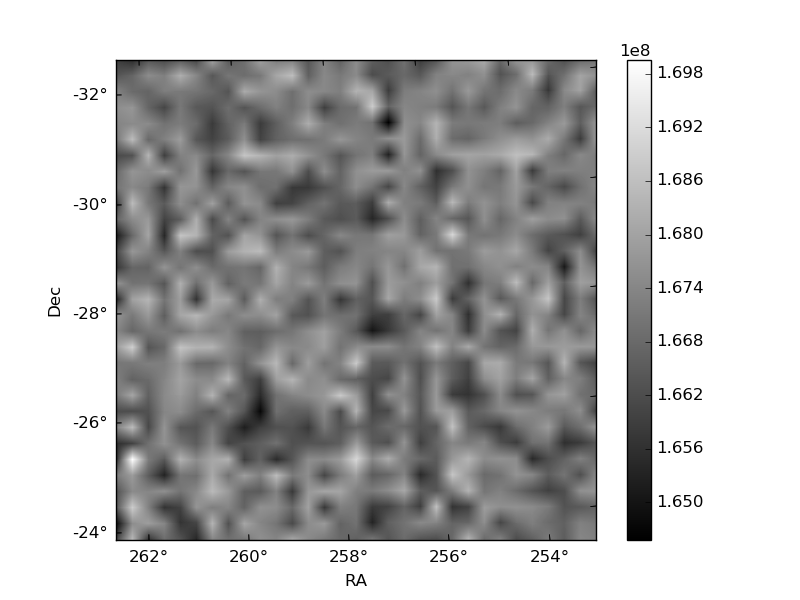
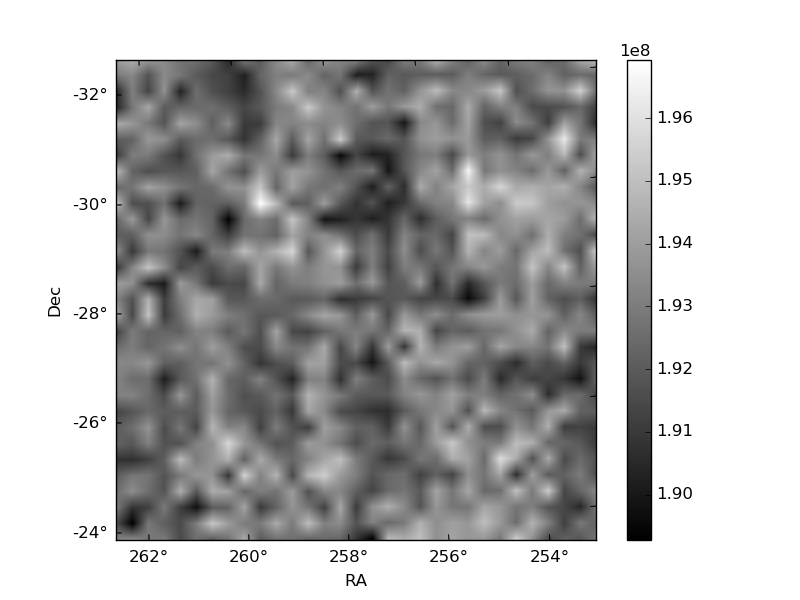
Histogram calculated using DETX and DETY for each event in the final _common_clean file
| Quadrant A | 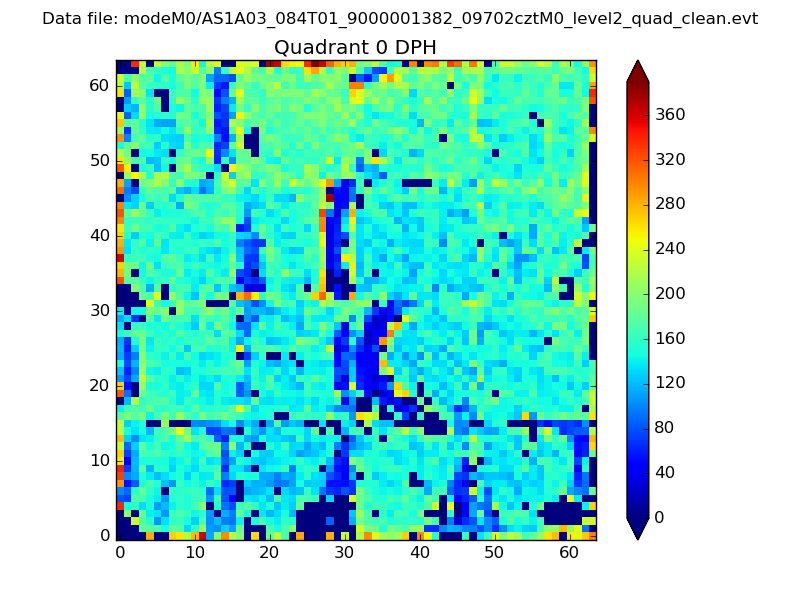 |
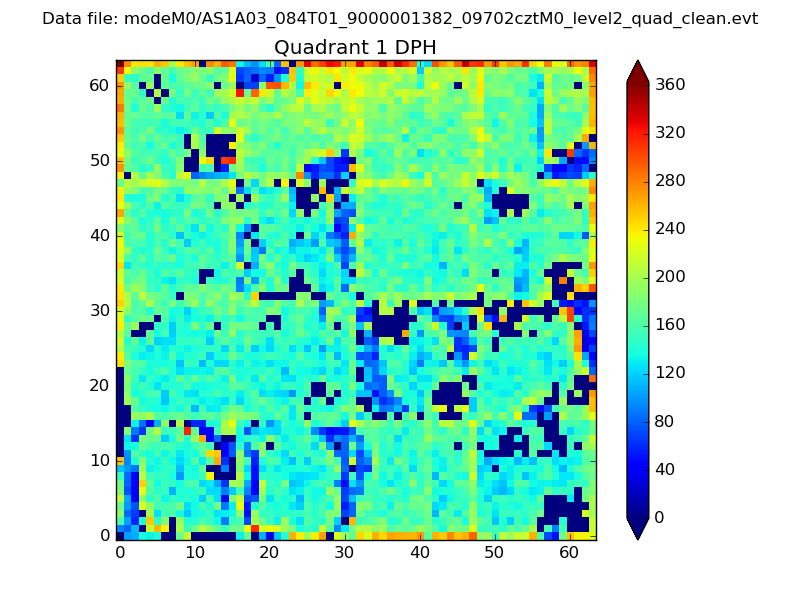 |
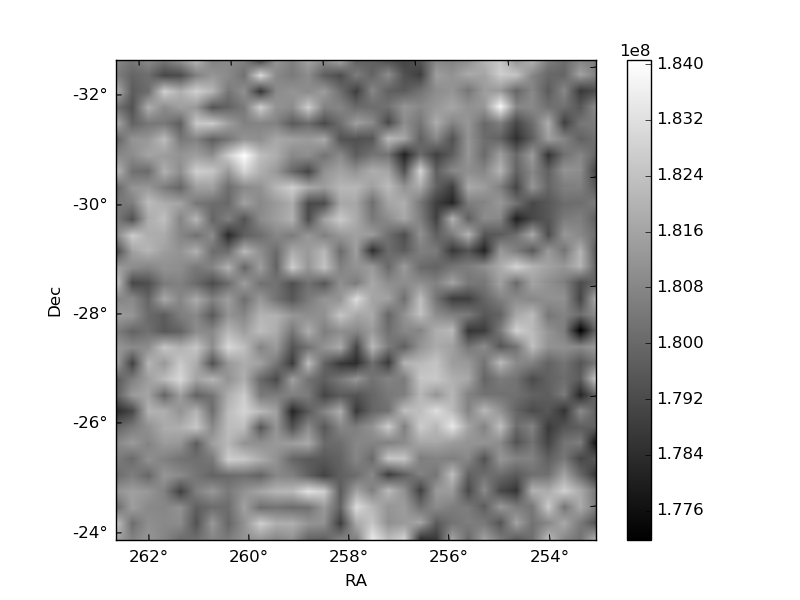
Quadrant B |
|---|---|---|---|
| Quadrant D | 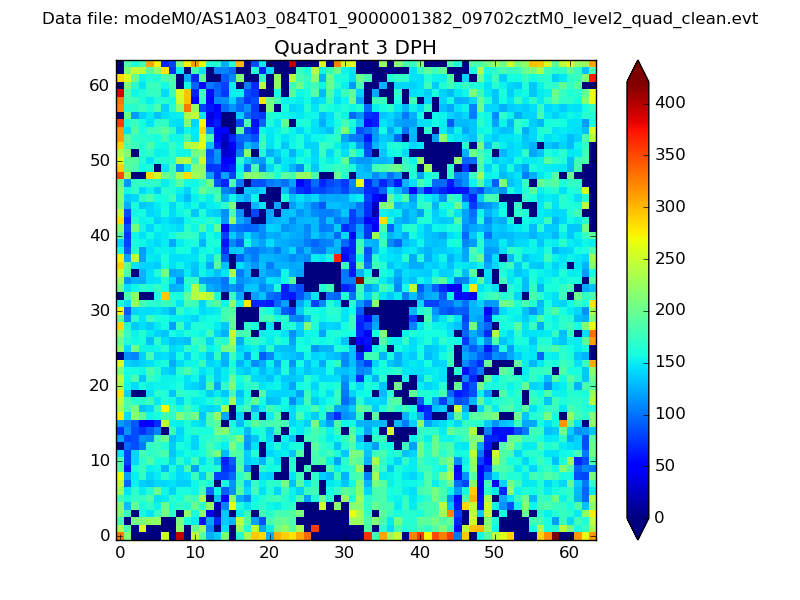 |
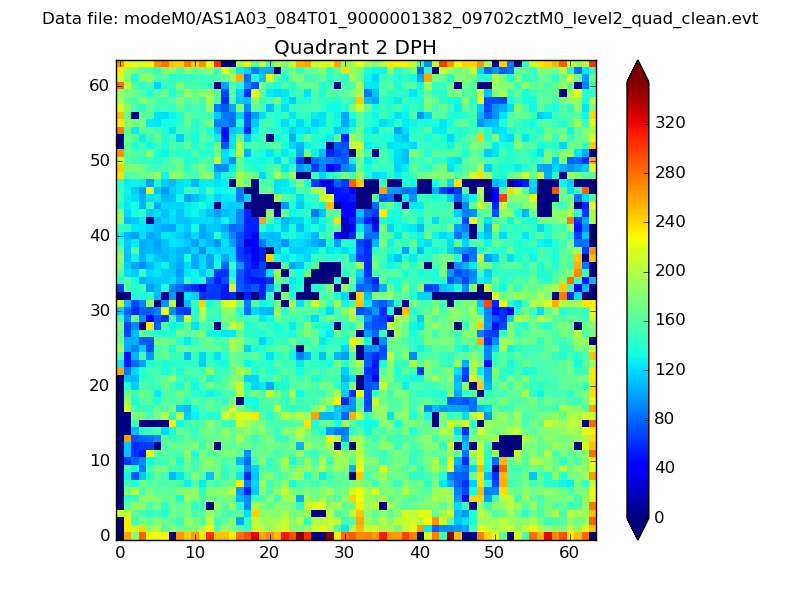 |
Quadrant C |
| Plot type | Count rate plots | Images |
|---|---|---|
| Comparison with Poisson distribution Blue bars denote a histogram of data divided into 1 sec bins. Red curve is a Poisson curve with rate = median count rate of data. |
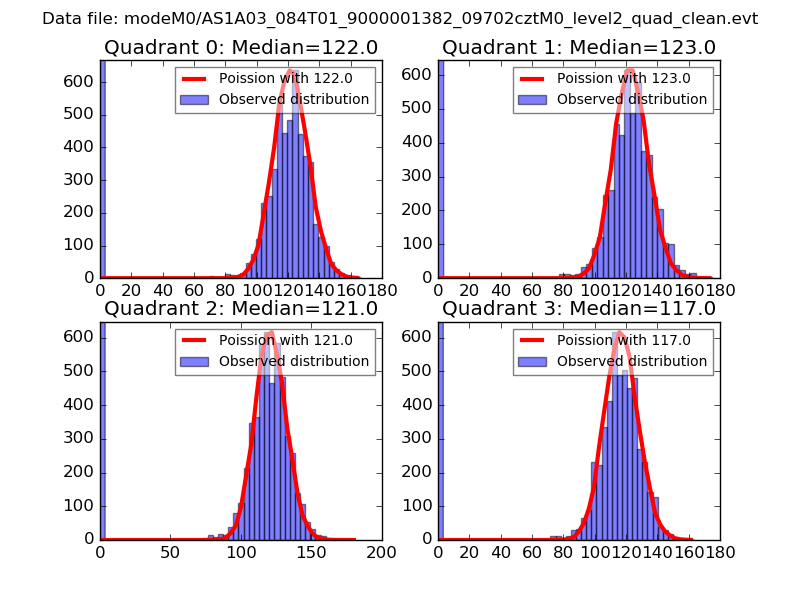 |
 |
| Quadrant-wise count rates Data is divided into 100 sec bins |
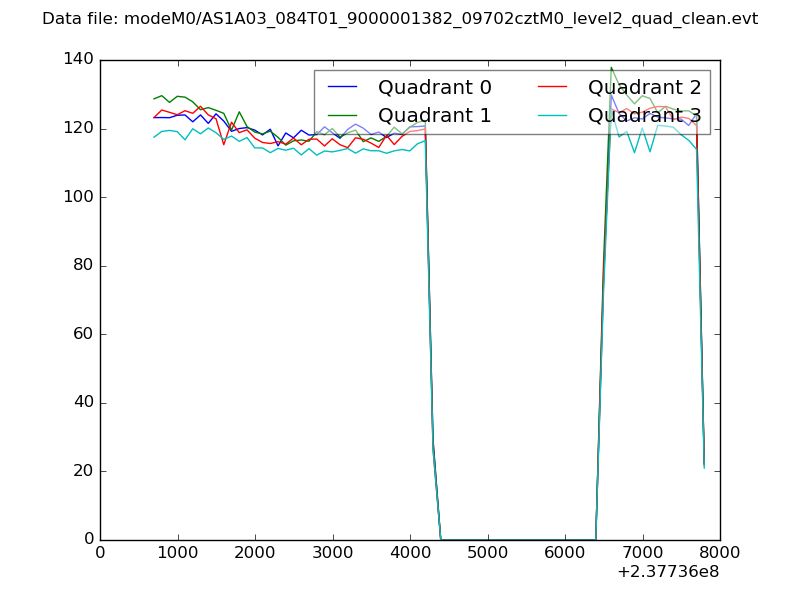 |
|
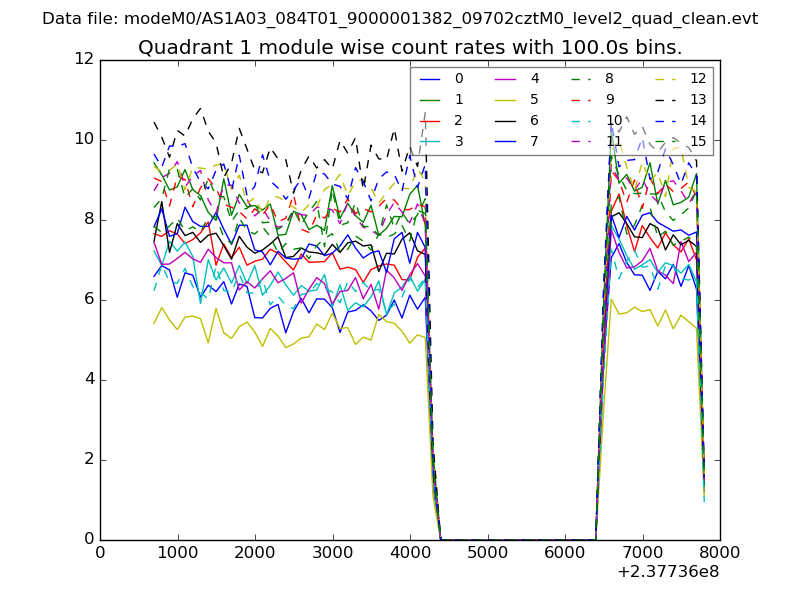
| Module-wise count rates for Quadrant A Data is divided into 100 sec bins |
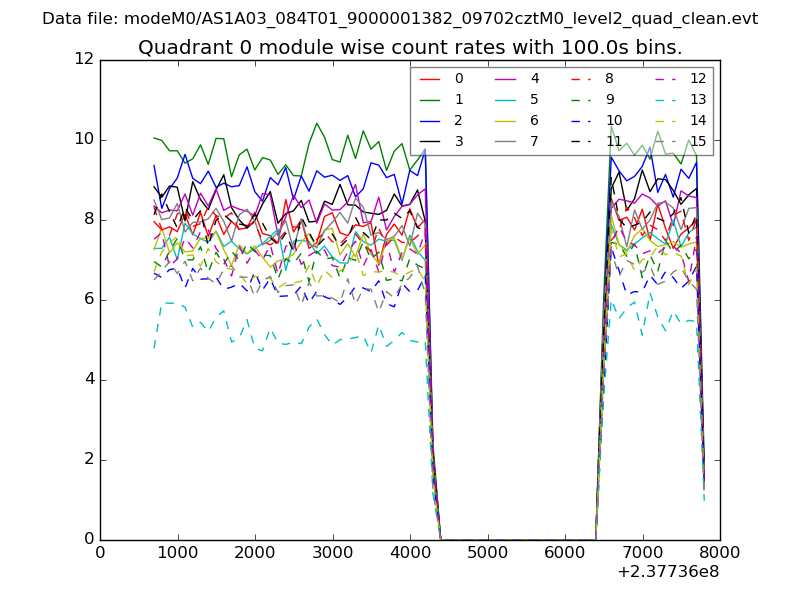 |
 |
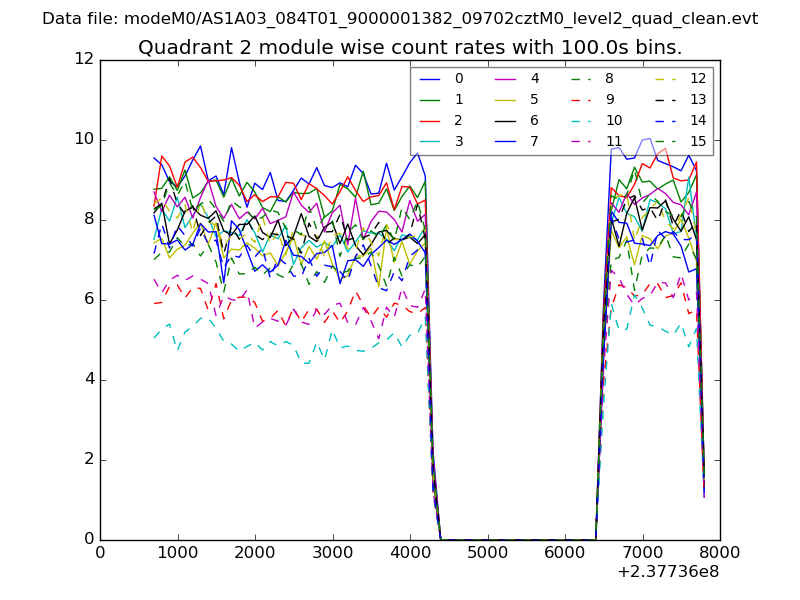
| Module-wise count rates for Quadrant B Data is divided into 100 sec bins |
 |
 |
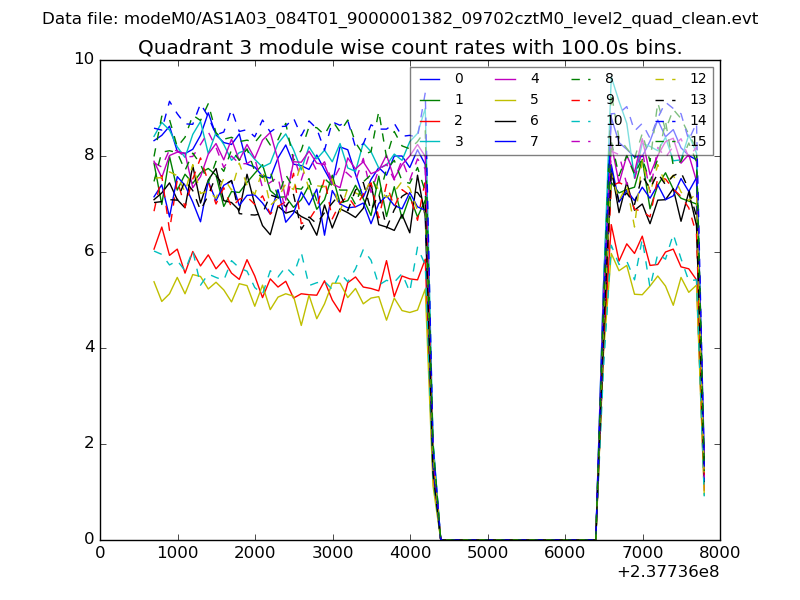
| Module-wise count rates for Quadrant C Data is divided into 100 sec bins |
 |
 |
| Module-wise count rates for Quadrant D Data is divided into 100 sec bins |
 |
 |
| Parameter | Plot |
|---|---|
| CZT HV Monitor | 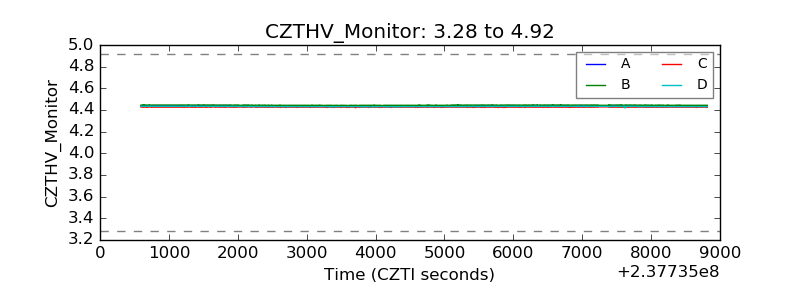 |
| D_VDD | 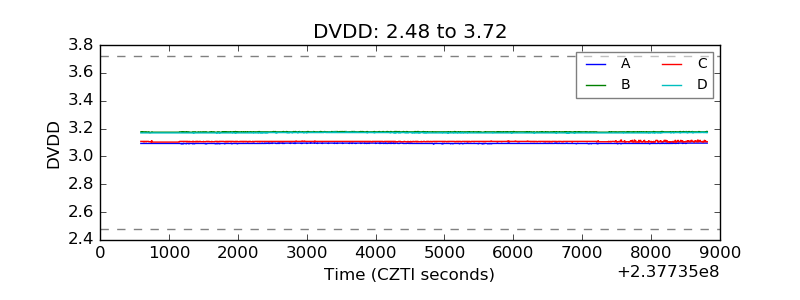 |
| Temperature 1 | 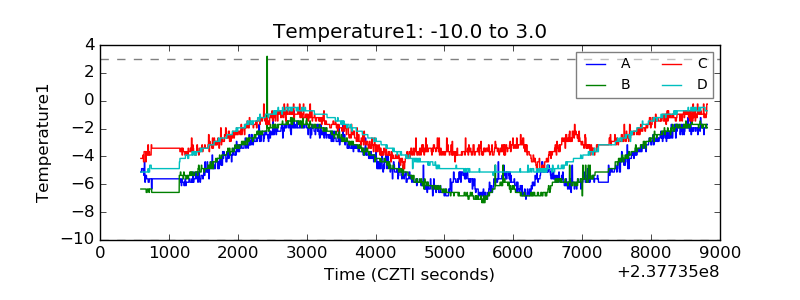 |
| Veto HV Monitor | 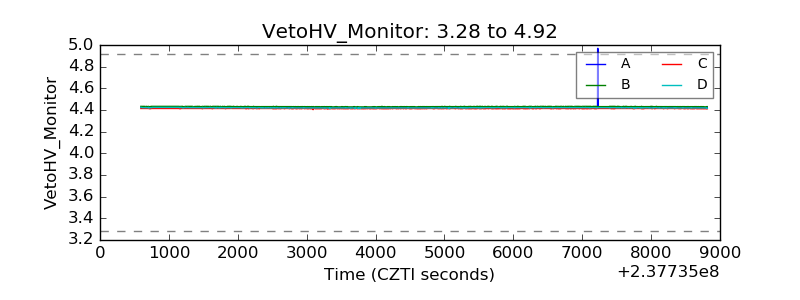 |
| Veto LLD | 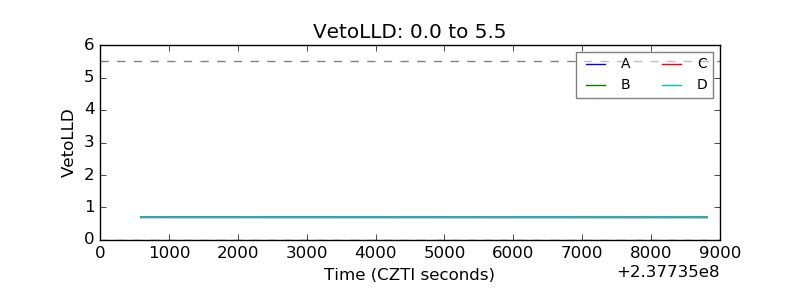 |
| Alpha Counter | 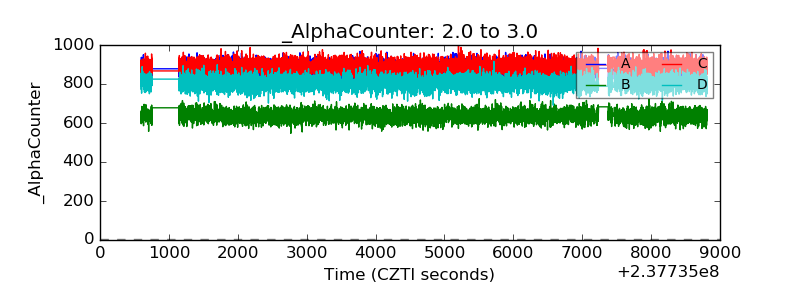 |
| _CPM_Rate | 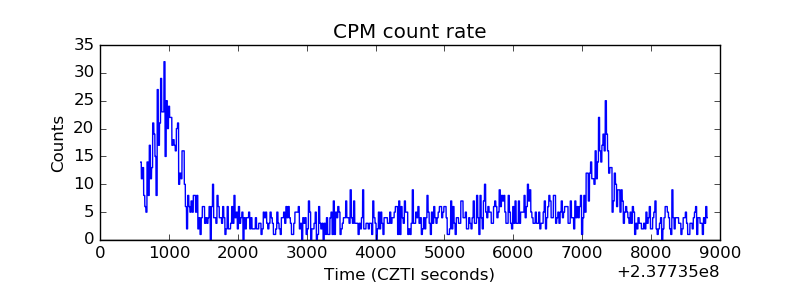 |
| CZT Counter | 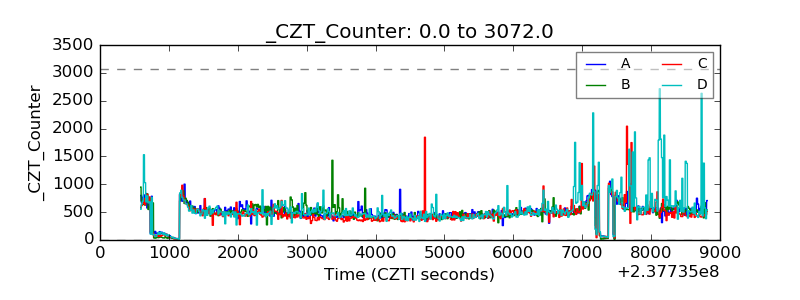 |
| +2.5 Volts monitor |  |
| +5 Volts monitor |  |
| _ROLL_ROT | 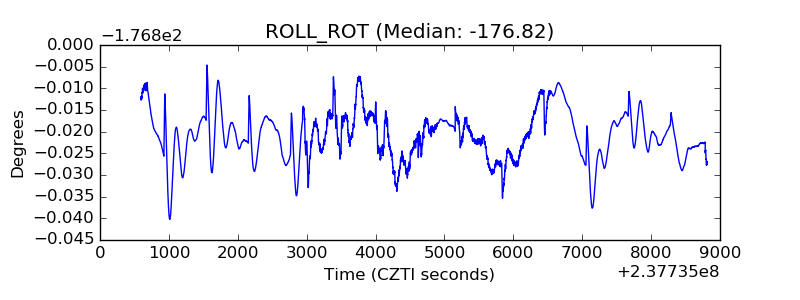 |
| _Roll_DEC | 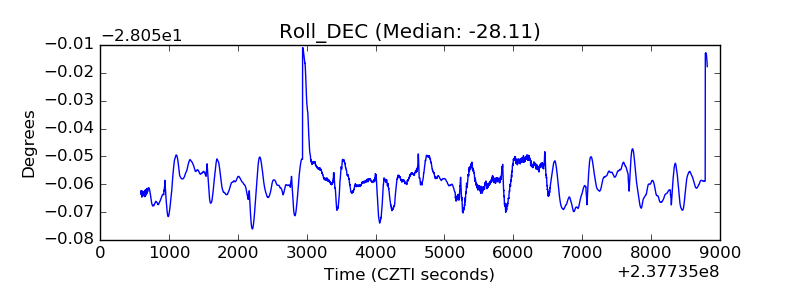 |
| _Roll_RA | 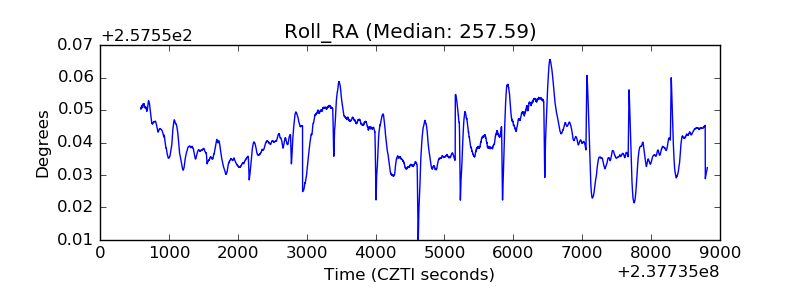 |
| Veto Counter | 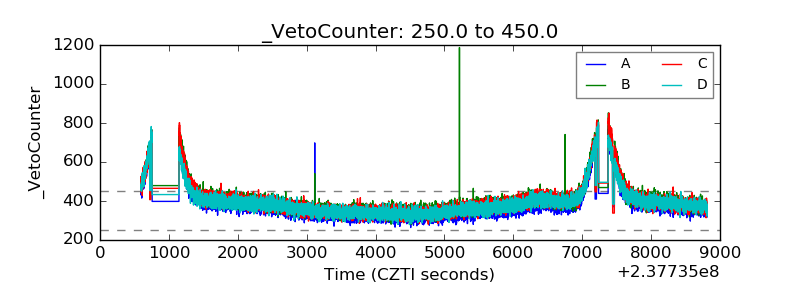 |