| Param | Original file | Final file |
|---|---|---|
| Filename | modeM0/AS1A03_084T01_9000001382_09703cztM0_level2.evt | modeM0/AS1A03_084T01_9000001382_09703cztM0_level2_quad_clean.evt |
| Size (bytes) | 142,557,120 | 36,570,240 |
| Size | 136.0 MB | 34.9 MB |
| Events in quadrant A | 1,016,344 | 240,676 |
| Events in quadrant B | 999,237 | 246,455 |
| Events in quadrant C | 908,433 | 242,389 |
| Events in quadrant D | 1,254,354 | 231,722 |
| Mode SS | |||
|---|---|---|---|
| Quadrant | BADHDUFLAG | Total packets | Discarded packets |
| A | 0 | 40 | 0 |
| B | 0 | 40 | 0 |
| C | 0 | 40 | 0 |
| D | 0 | 40 | 0 |
| Mode M0 | |||
|---|---|---|---|
| Quadrant | BADHDUFLAG | Total packets | Discarded packets |
| A | 0 | 4194 | 0 |
| B | 0 | 4237 | 0 |
| C | 0 | 4089 | 0 |
| D | 0 | 5094 | 0 |
| Quadrant | Total seconds | Saturated seconds | Saturation percentage |
|---|---|---|---|
| A | 2007 | 1 | 0.049826% |
| B | 2007 | 3 | 0.149477% |
| C | 2007 | 3 | 0.149477% |
| D | 2007 | 35 | 1.743896% |
Noise dominated data is calculated using 1-second bins in cleaned event files. If a bin has >2000 counts, and if more than 50% of those come from <1% of pixels, then it is considered to be noise-dominated and hence unusable.
| Quadrant | # 1 sec bins | Bins with >0 counts | Bins with >2000 counts | High rate bins dominated by noise | Noise dominated (total time) | Noise dominated (detector-on time) | Marked lightcurve |
|---|---|---|---|---|---|---|---|
| A | 2007 | 2007 | 0 | 0 | 0.00% | 0.00% | 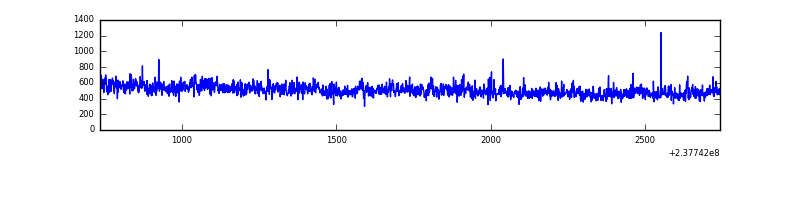 |
| B | 2007 | 2007 | 0 | 0 | 0.00% | 0.00% | 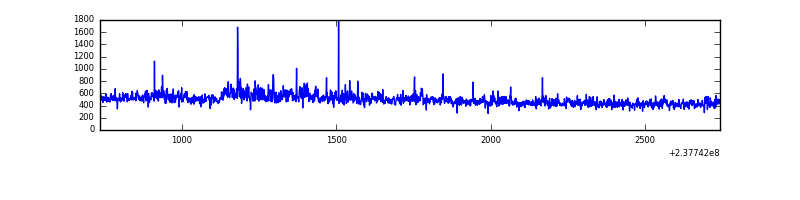 |
| C | 2007 | 2007 | 1 | 1 | 0.05% | 0.05% | 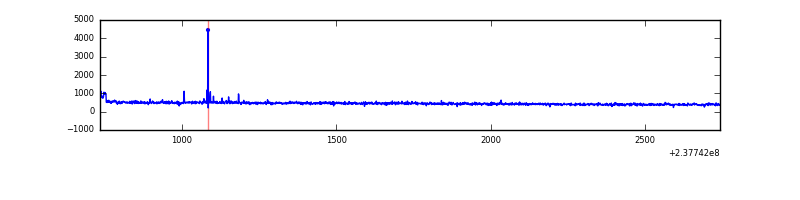 |
| D | 2007 | 2007 | 25 | 25 | 1.25% | 1.25% | 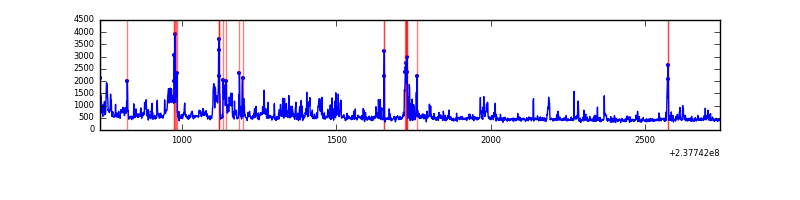 |
Top three noisy pixels from each quadrant. If the there are fewer than three noisy pixels in the level2.evt file, extra rows are filled as -1
| Pixel properties | Quadrant properties | ||||||
|---|---|---|---|---|---|---|---|
| Quadrant | DetID | PixID | Counts | Sigma | Mean | Median | Sigma |
| A | 1 | 162 | 49406 | 968.2 | 236 | 231 | 50.8 |
| A | 1 | 178 | 17888 | 347.65 | 236 | 231 | 50.8 |
| A | 1 | 161 | 15861 | 307.74 | 236 | 231 | 50.8 |
| B | 0 | 214 | 42101 | 888.05 | 233 | 227 | 47.2 |
| B | 0 | 187 | 22595 | 474.37 | 233 | 227 | 47.2 |
| B | 0 | 229 | 10779 | 223.78 | 233 | 227 | 47.2 |
| C | 9 | 237 | 10370 | 187.47 | 224 | 225 | 54.1 |
| C | 14 | 234 | 10251 | 185.28 | 224 | 225 | 54.1 |
| C | 10 | 22 | 4722 | 83.1 | 224 | 225 | 54.1 |
| D | 1 | 52 | 357757 | 5987.58 | 226 | 219 | 59.7 |
| D | 12 | 233 | 13430 | 221.24 | 226 | 219 | 59.7 |
| D | 2 | 234 | 11000 | 180.55 | 226 | 219 | 59.7 |
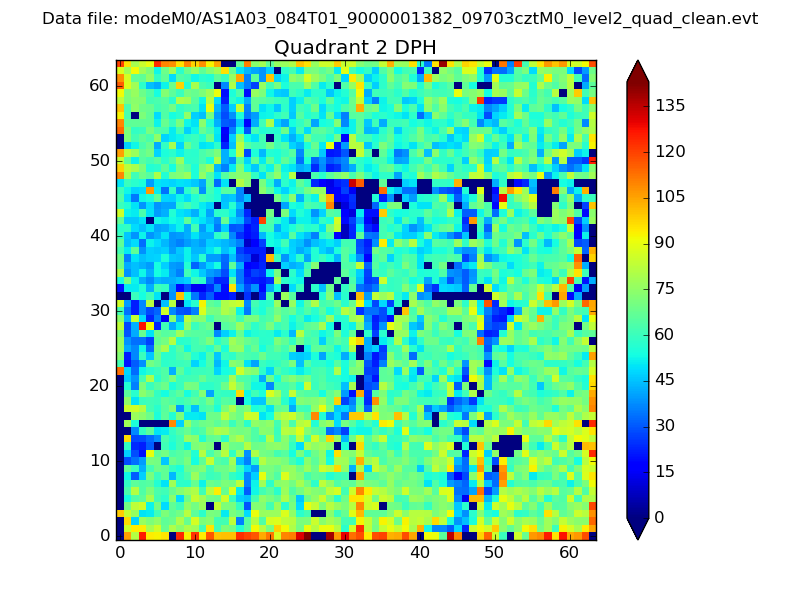
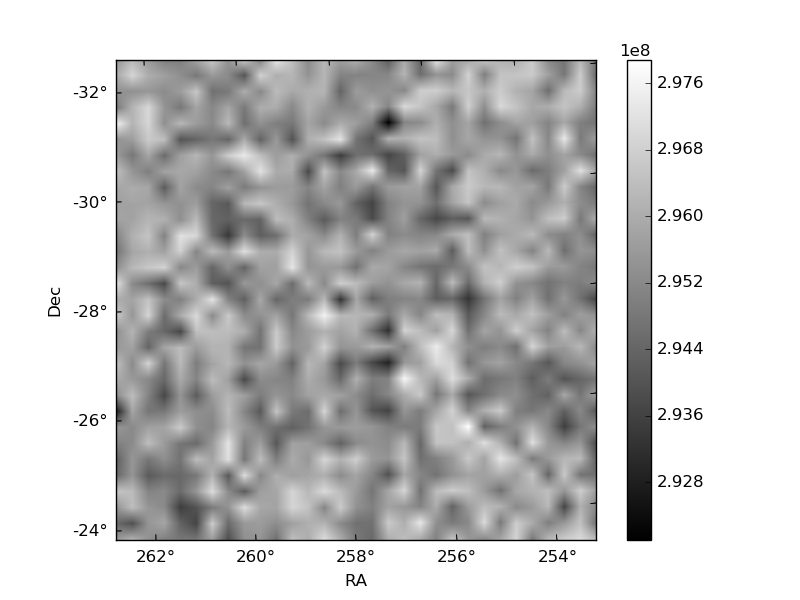
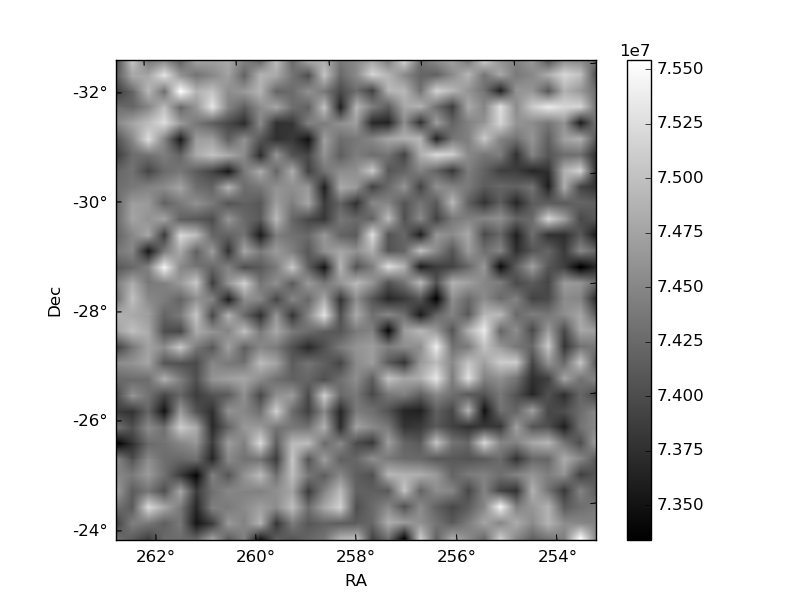
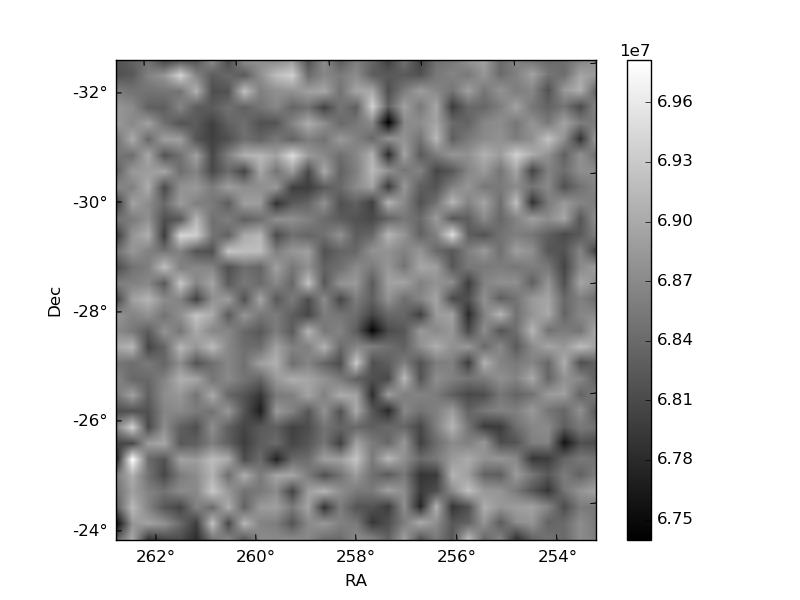
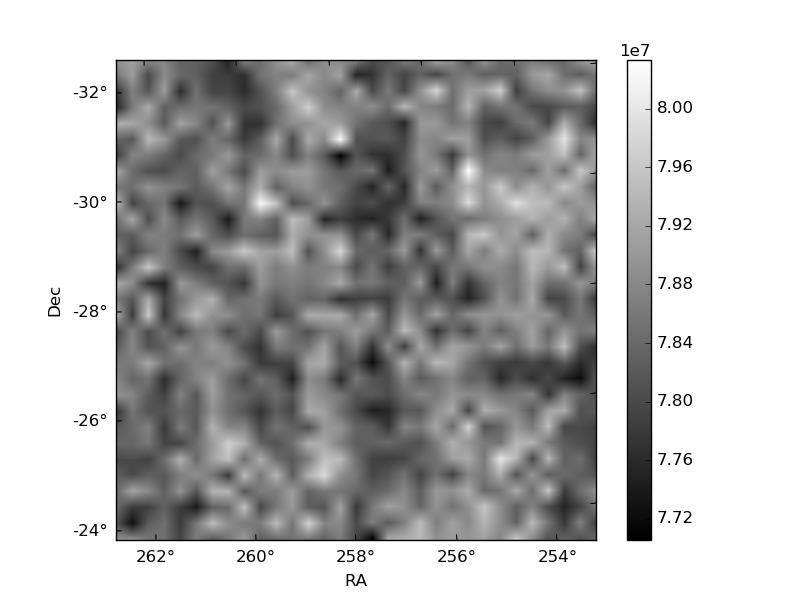
Histogram calculated using DETX and DETY for each event in the final _common_clean file
| Quadrant A | 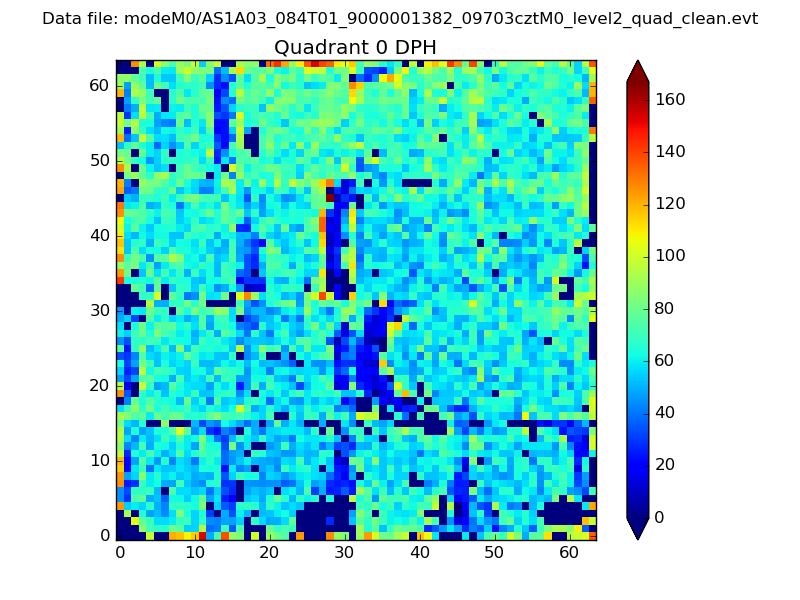 |
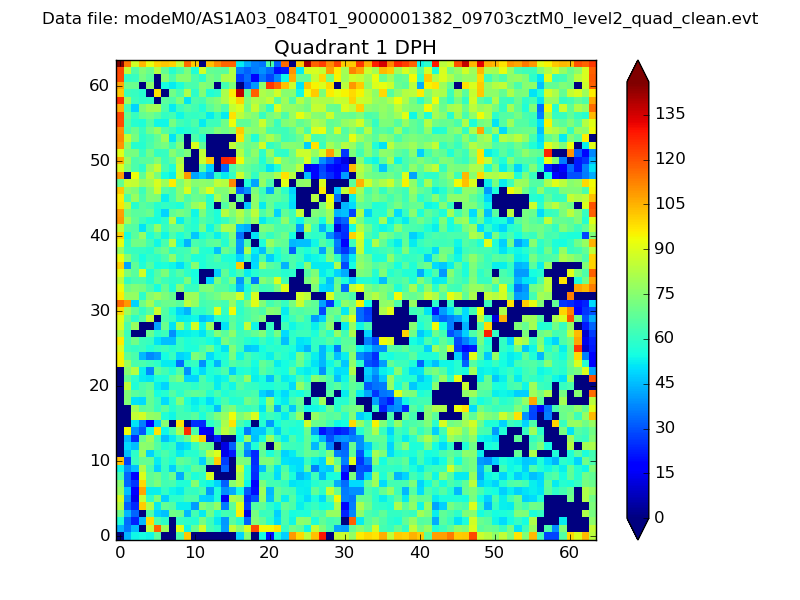 |
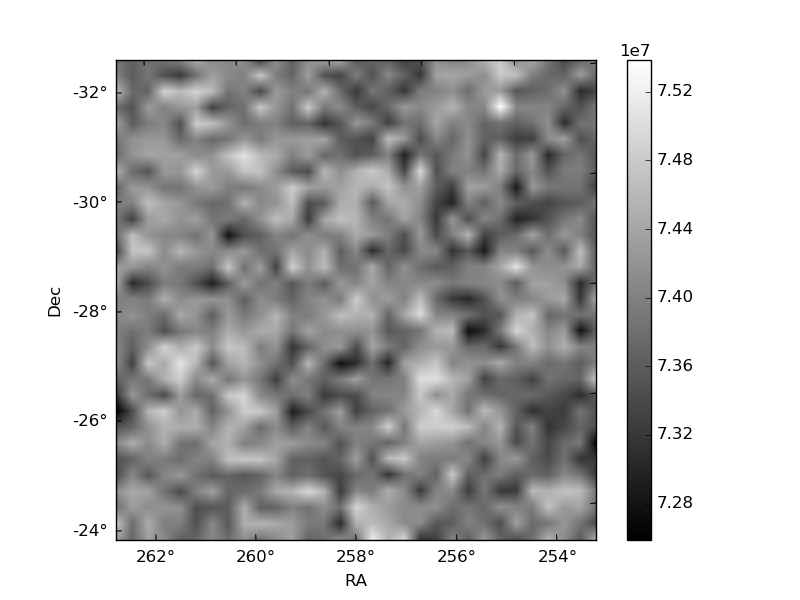
Quadrant B |
|---|---|---|---|
| Quadrant D | 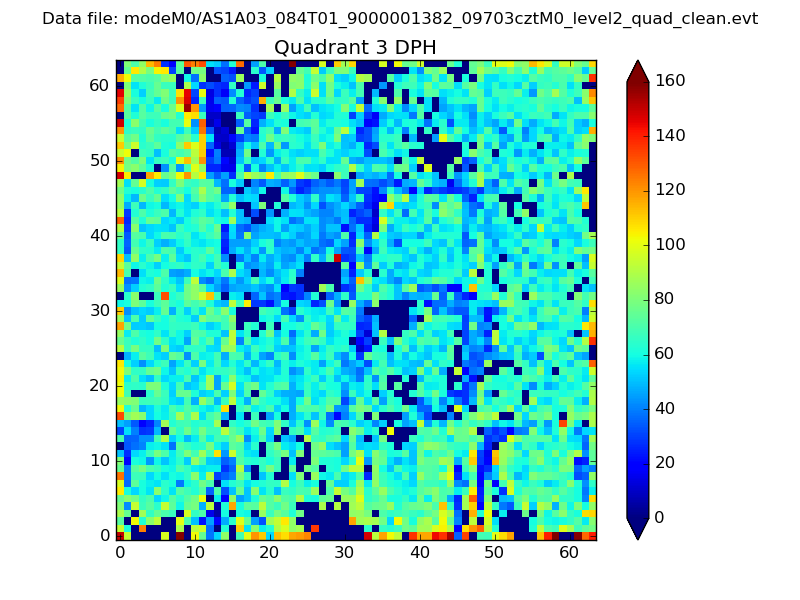 |
 |
Quadrant C |
| Plot type | Count rate plots | Images |
|---|---|---|
| Comparison with Poisson distribution Blue bars denote a histogram of data divided into 1 sec bins. Red curve is a Poisson curve with rate = median count rate of data. |
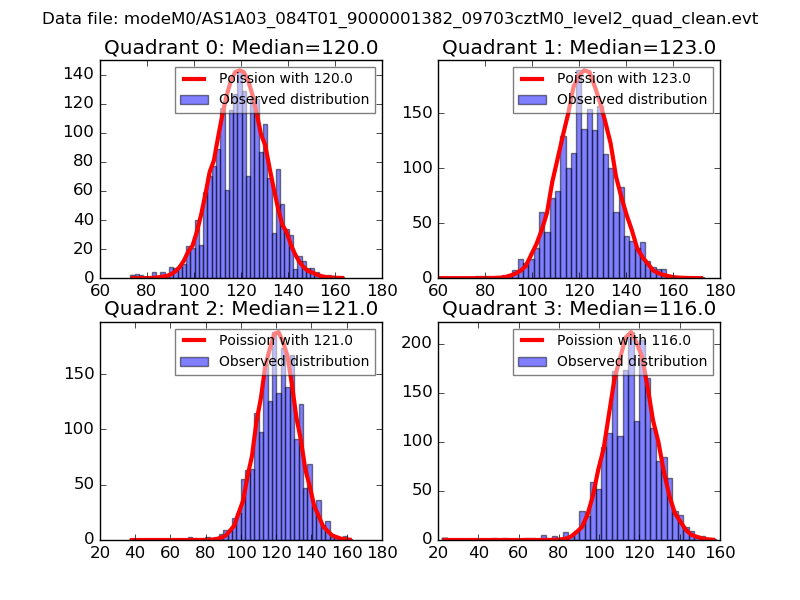 |
 |
| Quadrant-wise count rates Data is divided into 100 sec bins |
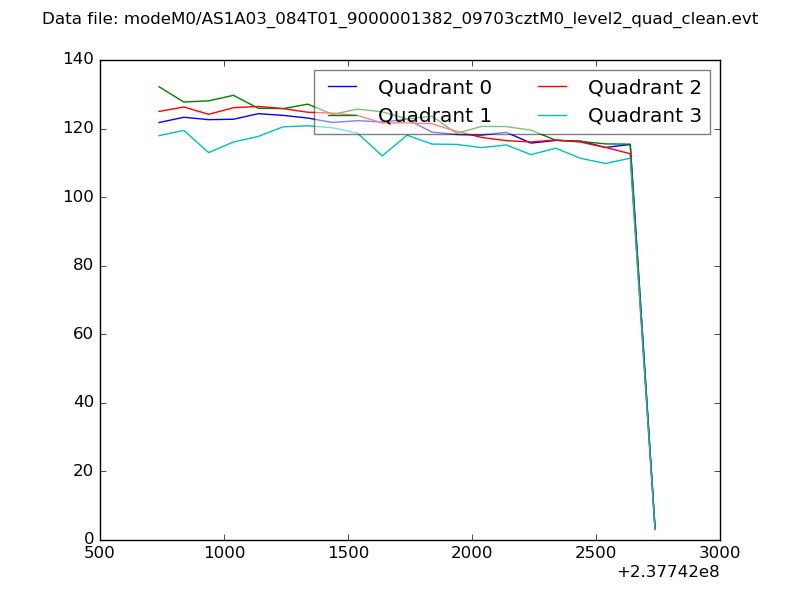 |
|
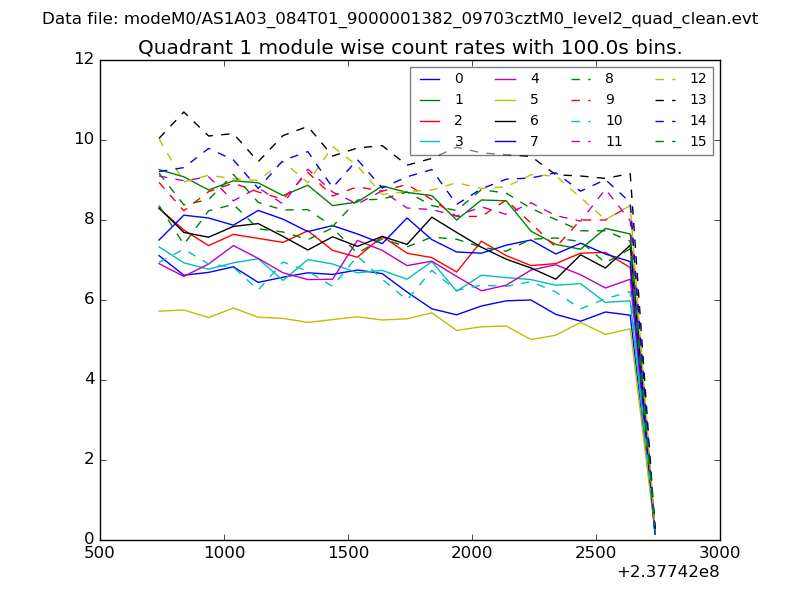
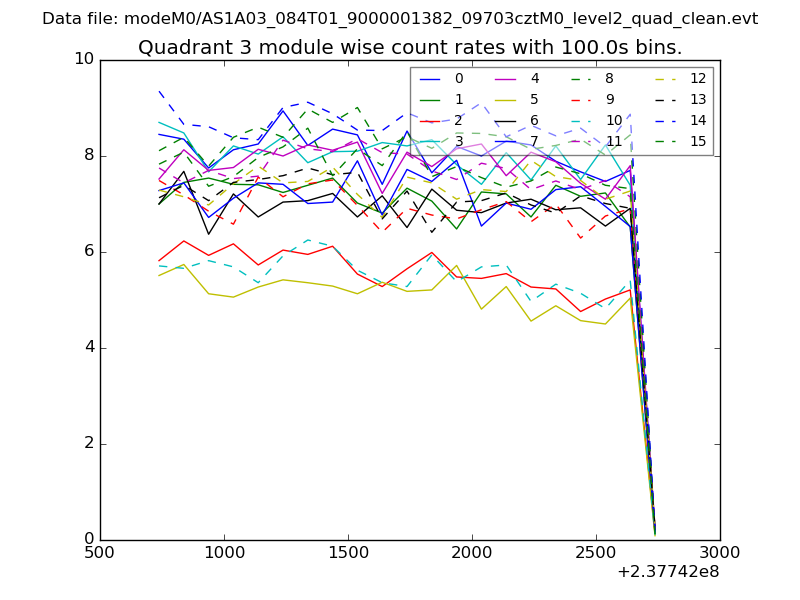
| Module-wise count rates for Quadrant A Data is divided into 100 sec bins |
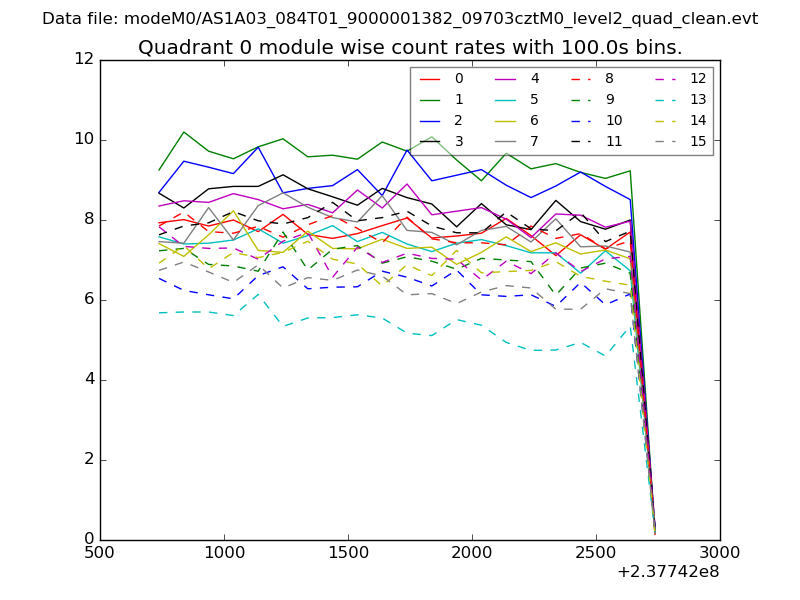 |
 |
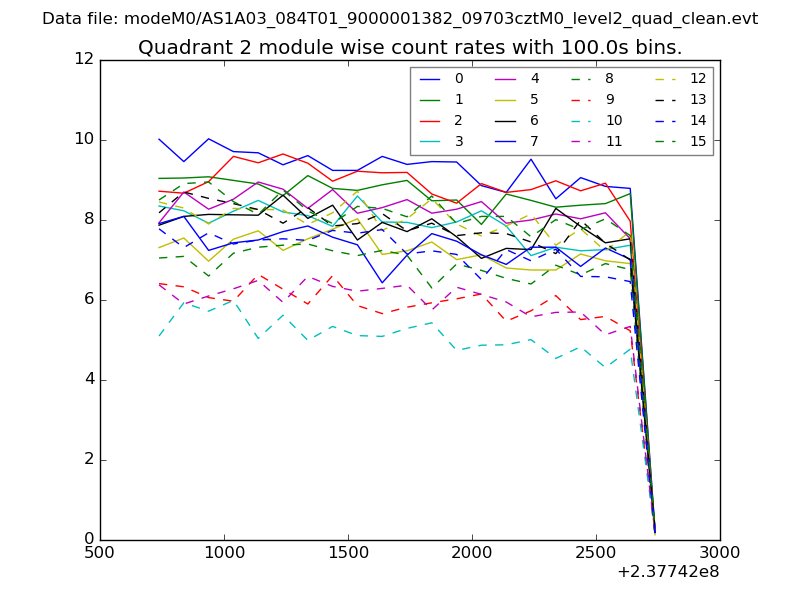
| Module-wise count rates for Quadrant B Data is divided into 100 sec bins |
 |
 |
| Module-wise count rates for Quadrant C Data is divided into 100 sec bins |
 |
 |
| Module-wise count rates for Quadrant D Data is divided into 100 sec bins |
 |
 |
| Parameter | Plot |
|---|---|
| CZT HV Monitor | 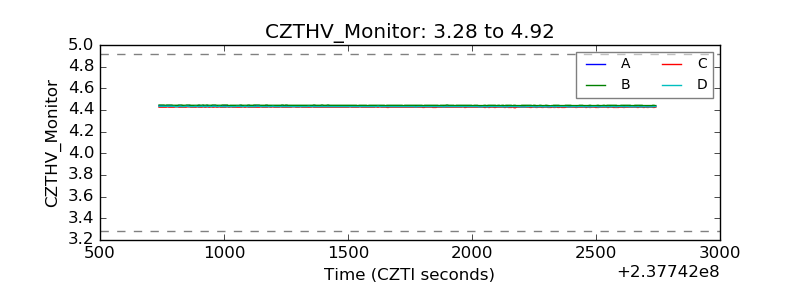 |
| D_VDD | 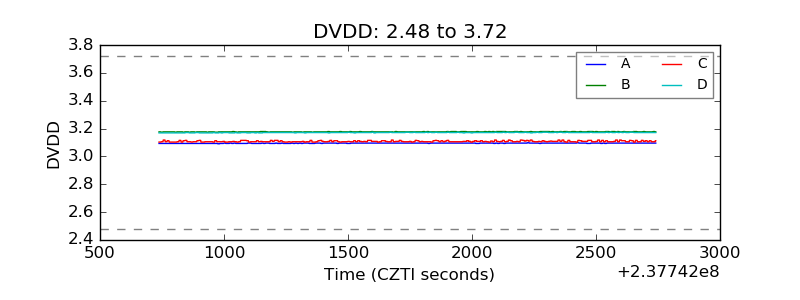 |
| Temperature 1 | 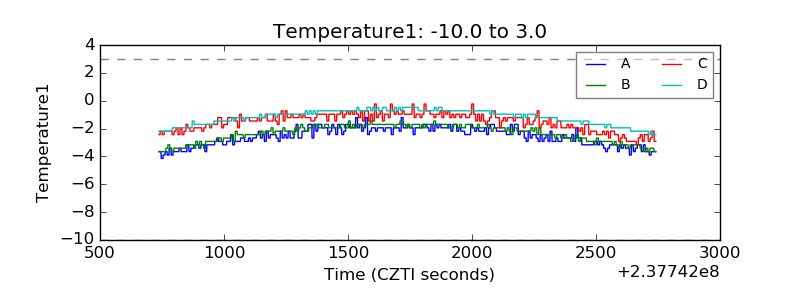 |
| Veto HV Monitor | 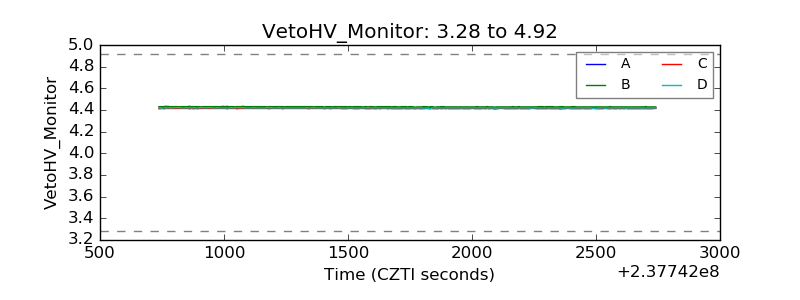 |
| Veto LLD | 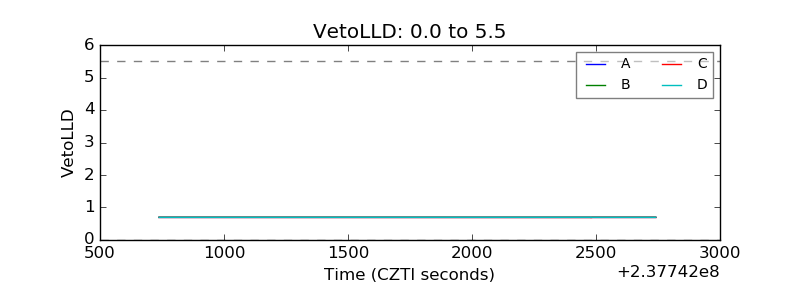 |
| Alpha Counter | 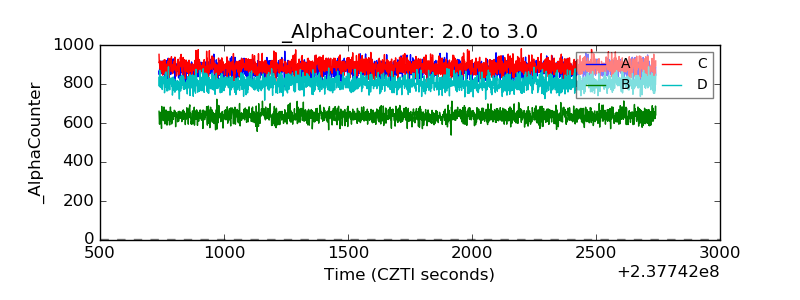 |
| _CPM_Rate | 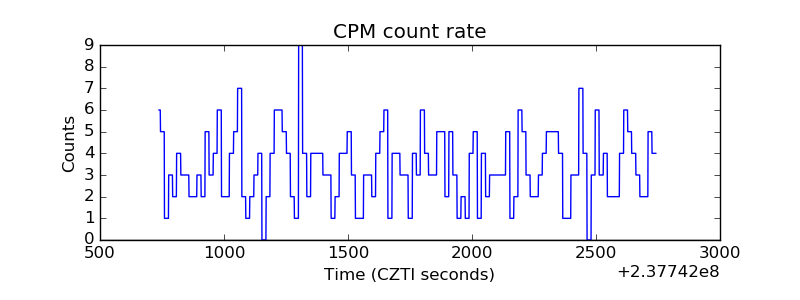 |
| CZT Counter | 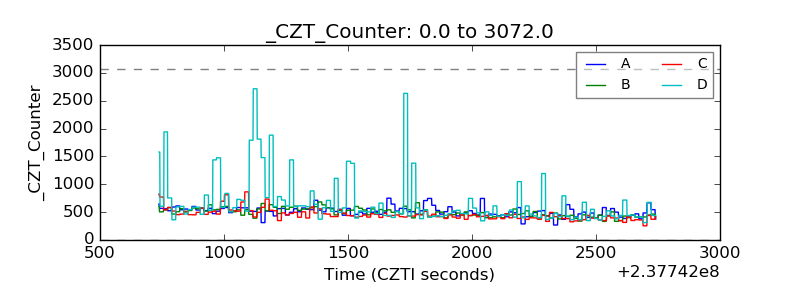 |
| +2.5 Volts monitor |  |
| +5 Volts monitor |  |
| _ROLL_ROT | 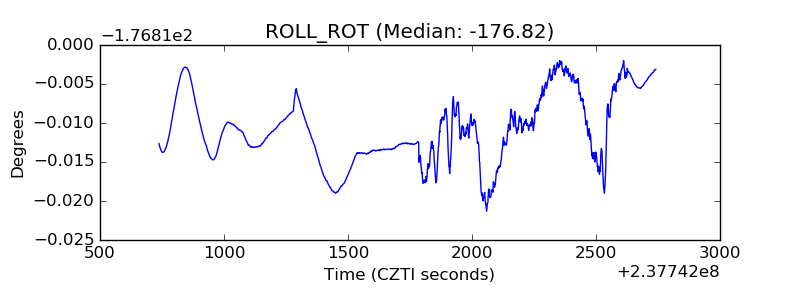 |
| _Roll_DEC | 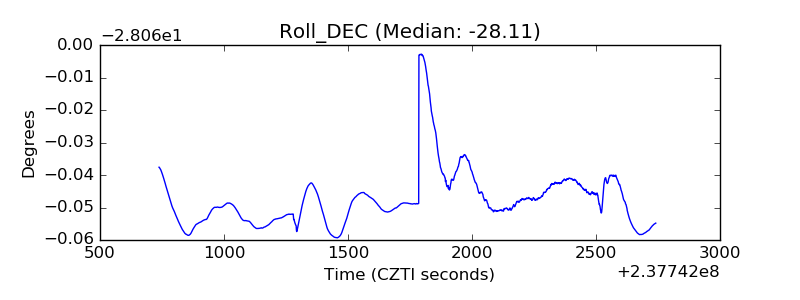 |
| _Roll_RA | 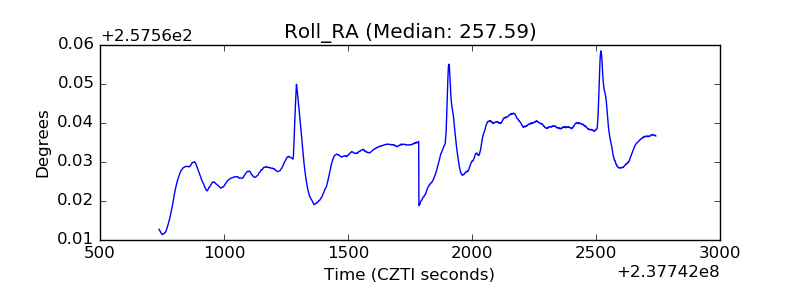 |
| Veto Counter | 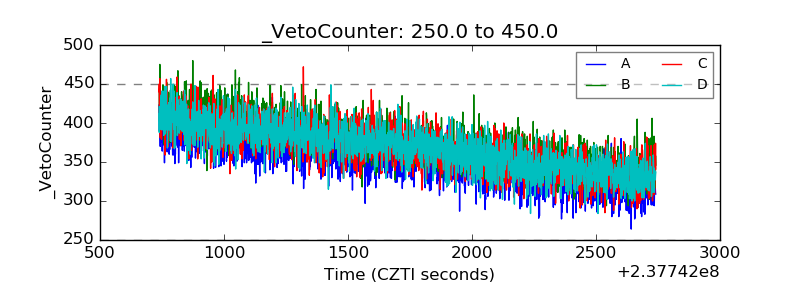 |