| Param | Original file | Final file |
|---|---|---|
| Filename | modeM0/AS1A02_029T01_9000001386cztM0_level2.fits | modeM0/AS1A02_029T01_9000001386cztM0_level2_quad_clean.evt |
| Size (bytes) | 418,930,560 | 376,027,200 |
| Size | 399.5 MB | 358.6 MB |
| Events in quadrant A | 2,531,146 | 2,177,532 |
| Events in quadrant B | 2,474,924 | 2,197,171 |
| Events in quadrant C | 2,541,306 | 2,130,475 |
| Events in quadrant D | 2,182,182 | 1,925,301 |
| Mode M0 | |||
|---|---|---|---|
| Quadrant | BADHDUFLAG | Total packets | Discarded packets |
| A | 0 | 99664 | 0 |
| B | 0 | 93498 | 0 |
| C | 0 | 88692 | 0 |
| D | 0 | 100012 | 0 |
| Mode M9 | |||
|---|---|---|---|
| Quadrant | BADHDUFLAG | Total packets | Discarded packets |
| A | 0 | 83 | 0 |
| B | 0 | 83 | 0 |
| C | 0 | 83 | 0 |
| D | 0 | 82 | 0 |
| Mode SS | |||
|---|---|---|---|
| Quadrant | BADHDUFLAG | Total packets | Discarded packets |
| A | 0 | 880 | 0 |
| B | 0 | 876 | 0 |
| C | 0 | 878 | 0 |
| D | 0 | 876 | 0 |
| Quadrant | Total seconds | Saturated seconds | Saturation percentage |
|---|---|---|---|
| A | 43047 | 754 | 1.751574% |
| B | 43074 | 953 | 2.212472% |
| C | 43111 | 546 | 1.266498% |
| D | 43091 | 1267 | 2.940289% |
Noise dominated data is calculated using 1-second bins in cleaned event files. If a bin has >2000 counts, and if more than 50% of those come from <1% of pixels, then it is considered to be noise-dominated and hence unusable.
| Quadrant | # 1 sec bins | Bins with >0 counts | Bins with >2000 counts | High rate bins dominated by noise | Noise dominated (total time) | Noise dominated (detector-on time) | Marked lightcurve |
|---|---|---|---|---|---|---|---|
| A | 51484 | 43312 | 0 | 0 | 0.00% | 0.00% |  |
| B | 51484 | 43308 | 0 | 0 | 0.00% | 0.00% | 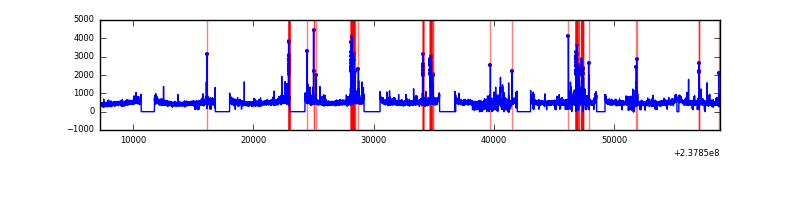 |
| C | 51484 | 43316 | 0 | 0 | 0.00% | 0.00% | 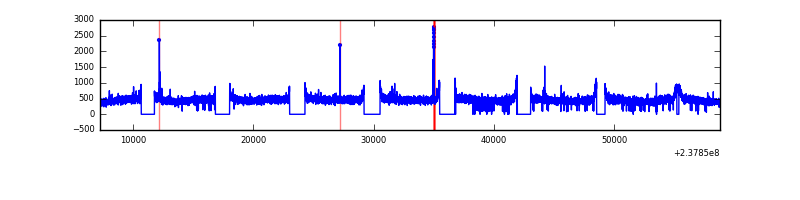 |
| D | 51484 | 43316 | 0 | 0 | 0.00% | 0.00% | 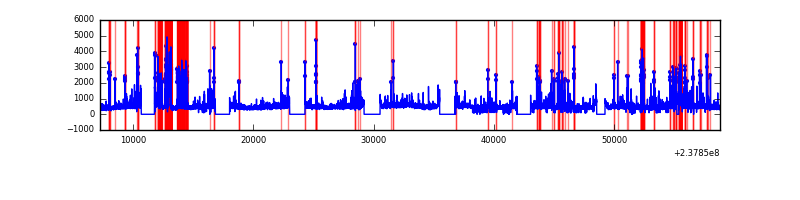 |
Top three noisy pixels from each quadrant. If the there are fewer than three noisy pixels in the level2.evt file, extra rows are filled as -1
| Pixel properties | Quadrant properties | ||||||
|---|---|---|---|---|---|---|---|
| Quadrant | DetID | PixID | Counts | Sigma | Mean | Median | Sigma |
| A | 0 | 29 | 2402 | 10.7 | 659 | 616 | 166.9 |
| A | 7 | 110 | 2042 | 8.55 | 659 | 616 | 166.9 |
| A | 9 | 19 | 1873 | 7.53 | 659 | 616 | 166.9 |
| B | 2 | 9 | 2125 | 11.6 | 653 | 623 | 129.5 |
| B | 12 | 226 | 1741 | 8.64 | 653 | 623 | 129.5 |
| B | 3 | 17 | 1657 | 7.99 | 653 | 623 | 129.5 |
| C | 1 | 80 | 1861 | 7.0 | 671 | 623 | 176.9 |
| C | 12 | 241 | 1773 | 6.5 | 671 | 623 | 176.9 |
| C | 1 | 81 | 1765 | 6.46 | 671 | 623 | 176.9 |
| D | 3 | 14 | 1627 | 6.49 | 620 | 563 | 164.1 |
| D | 7 | 3 | 1576 | 6.17 | 620 | 563 | 164.1 |
| D | 6 | 231 | 1567 | 6.12 | 620 | 563 | 164.1 |
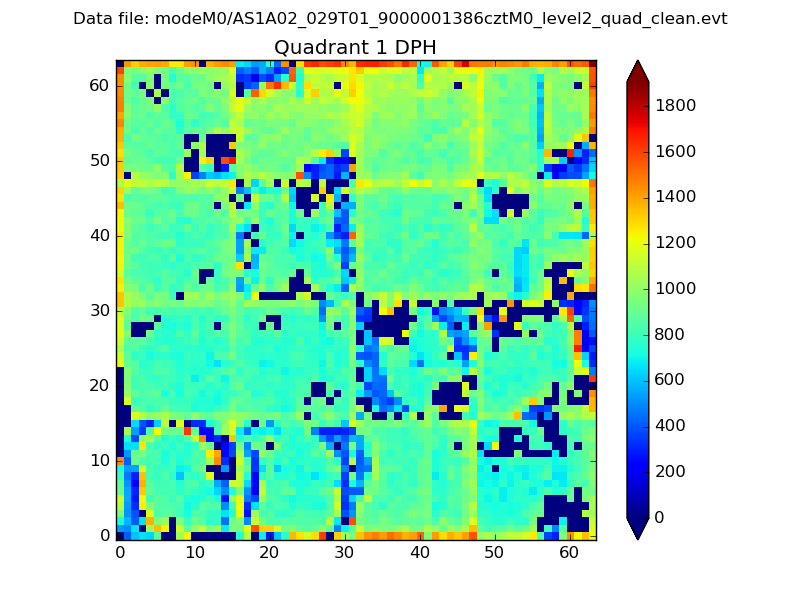
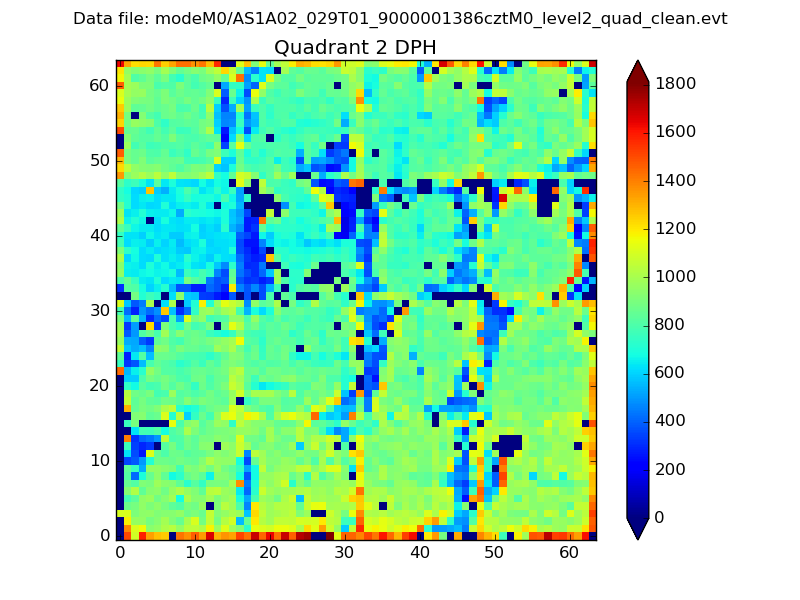
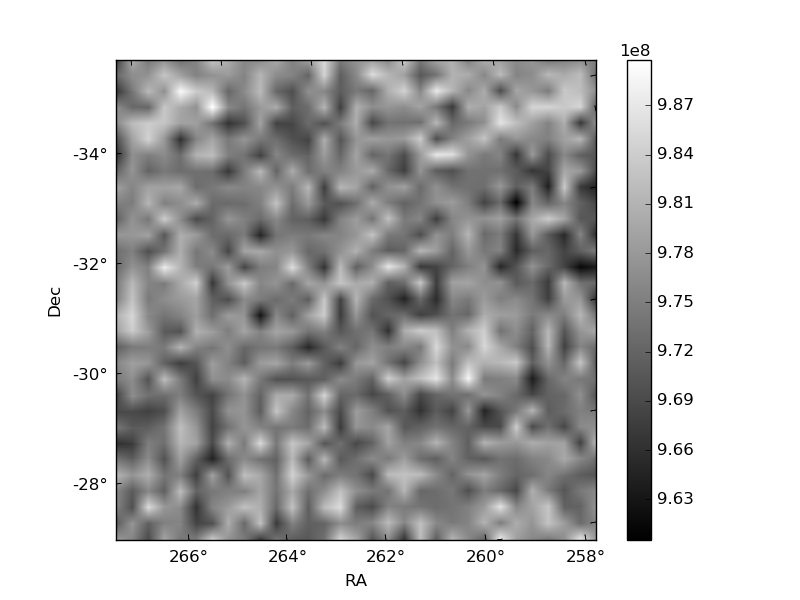
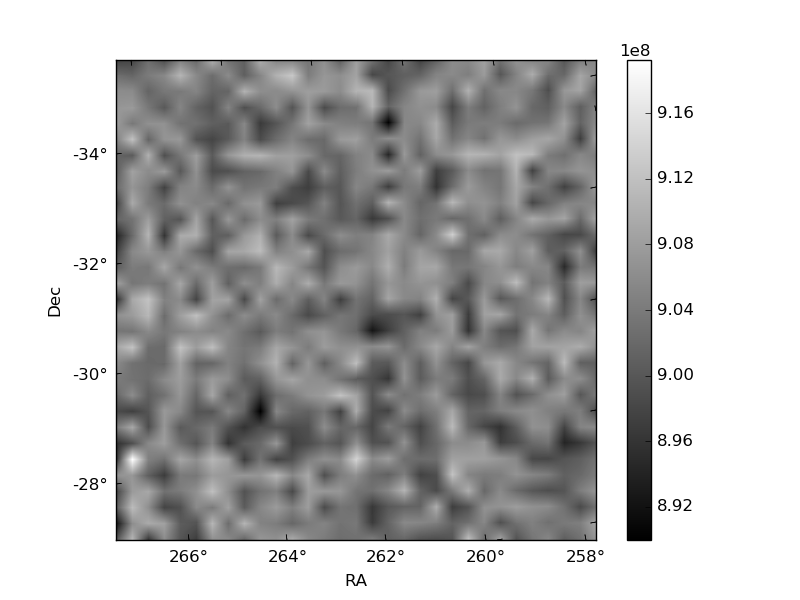
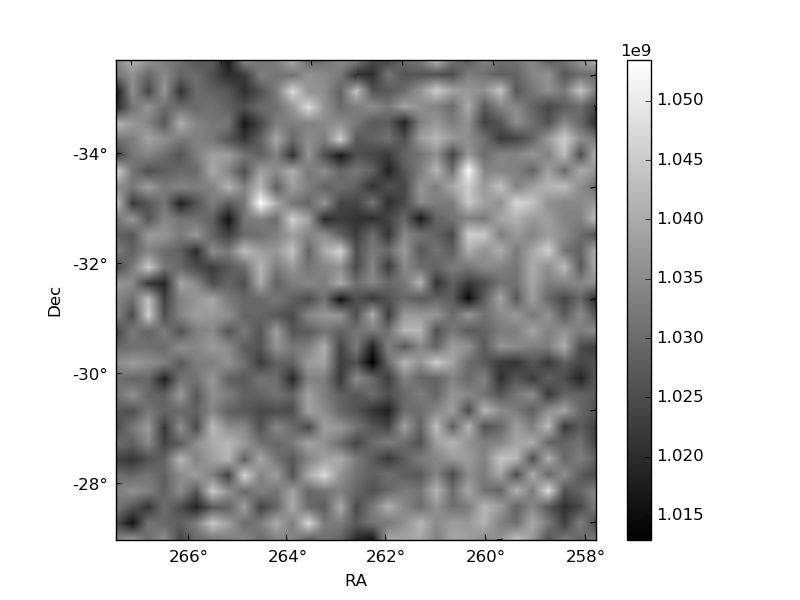
Histogram calculated using DETX and DETY for each event in the final _common_clean file
| Quadrant A | 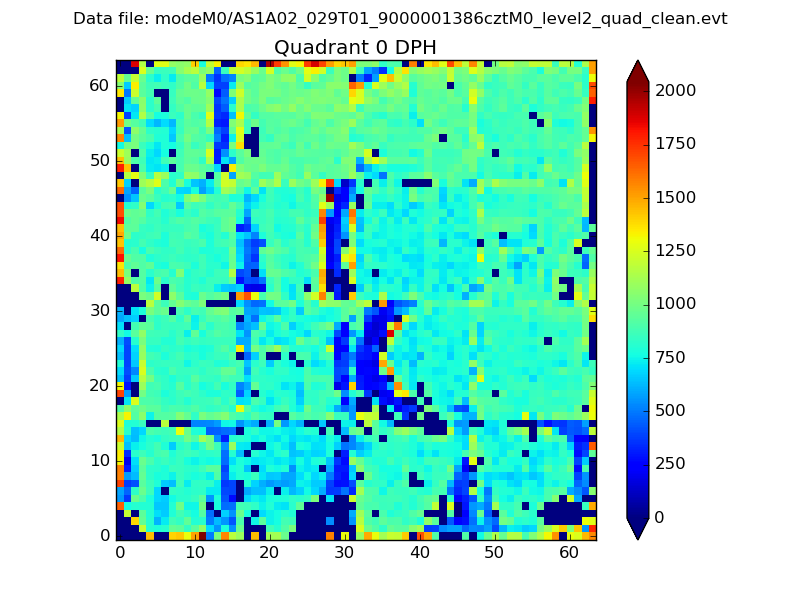 |
 |
Quadrant B |
|---|---|---|---|
| Quadrant D | 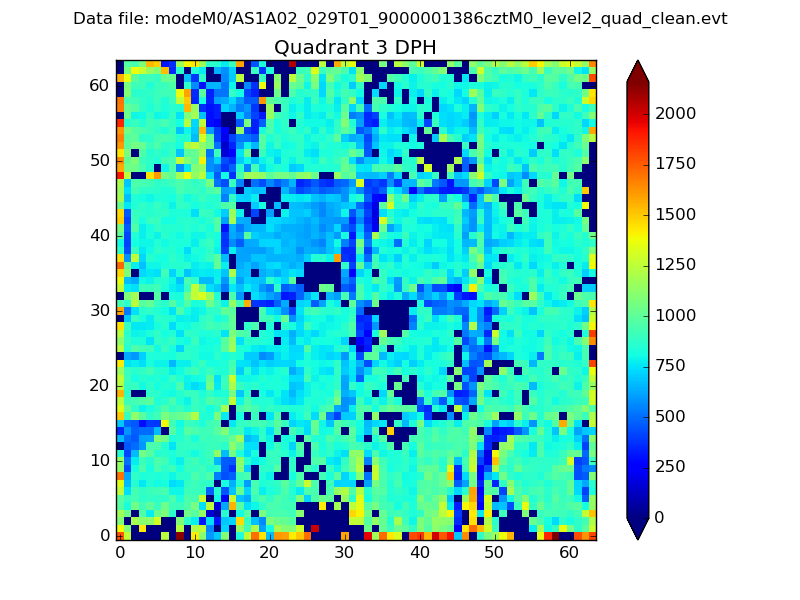 |
 |
Quadrant C |
| Plot type | Count rate plots | Images |
|---|---|---|
| Comparison with Poisson distribution Blue bars denote a histogram of data divided into 1 sec bins. Red curve is a Poisson curve with rate = median count rate of data. |
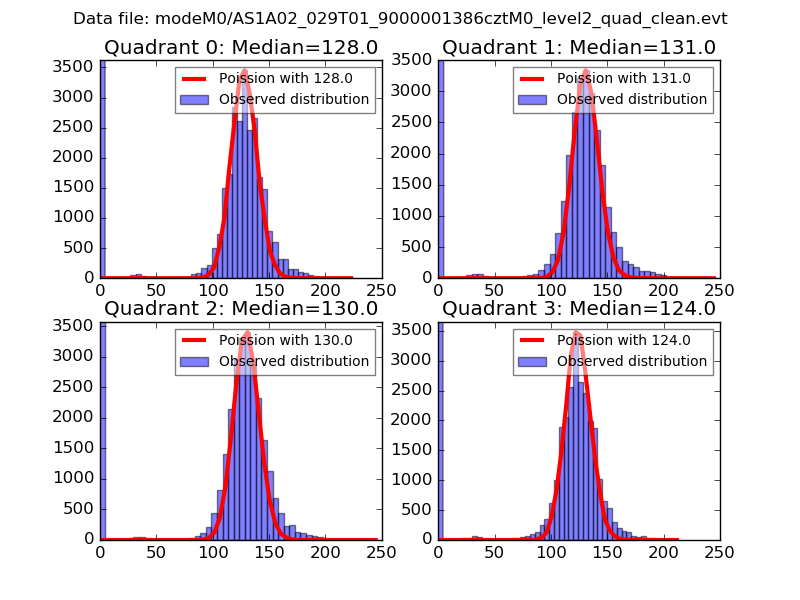 |
 |
| Quadrant-wise count rates Data is divided into 100 sec bins |
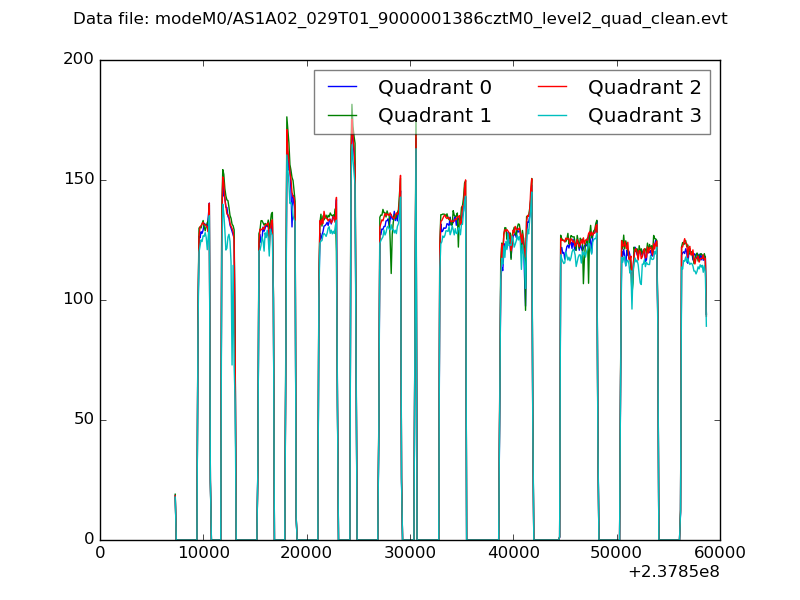 |
|
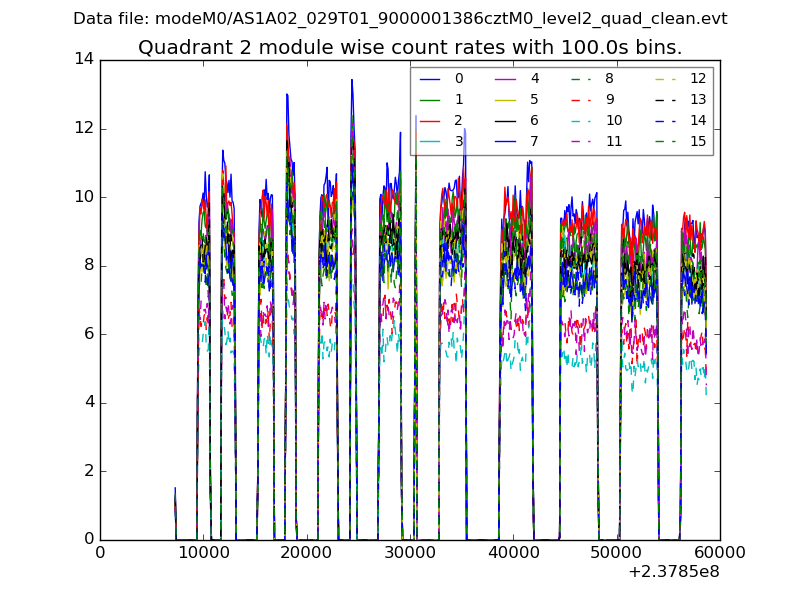
| Module-wise count rates for Quadrant A Data is divided into 100 sec bins |
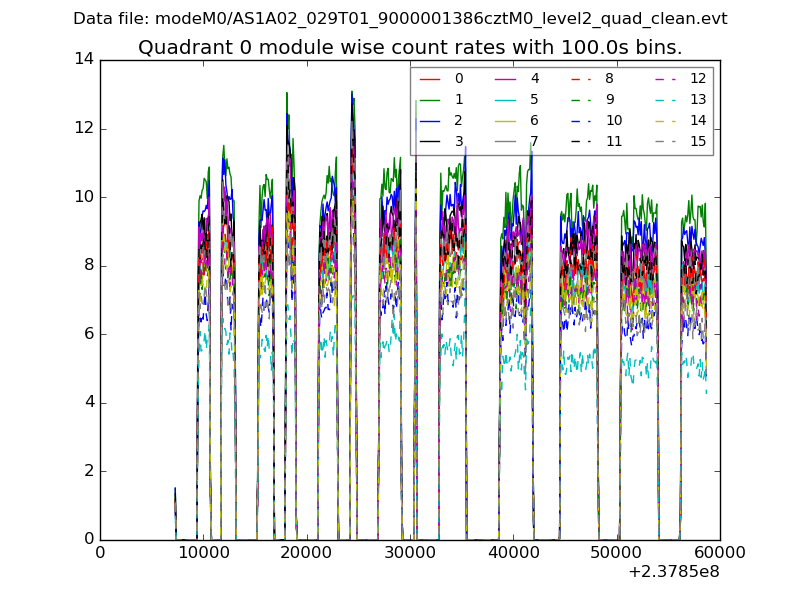 |
 |
| Module-wise count rates for Quadrant B Data is divided into 100 sec bins |
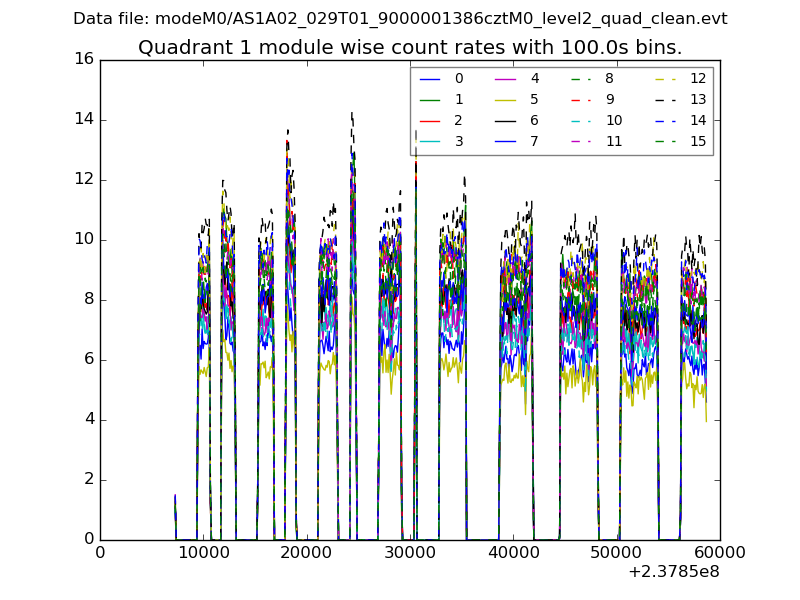 |
 |
| Module-wise count rates for Quadrant C Data is divided into 100 sec bins |
 |
 |
| Module-wise count rates for Quadrant D Data is divided into 100 sec bins |
 |
 |
| Parameter | Plot |
|---|---|
| CZT HV Monitor | 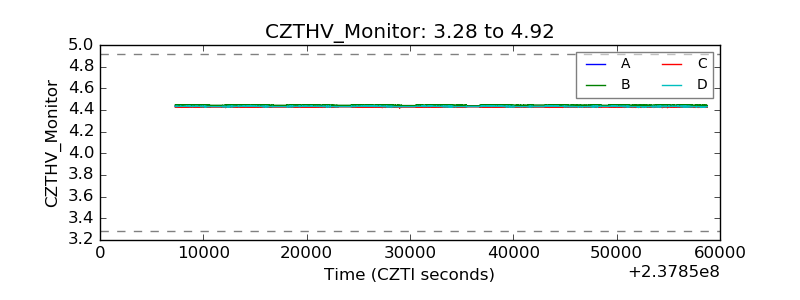 |
| D_VDD | 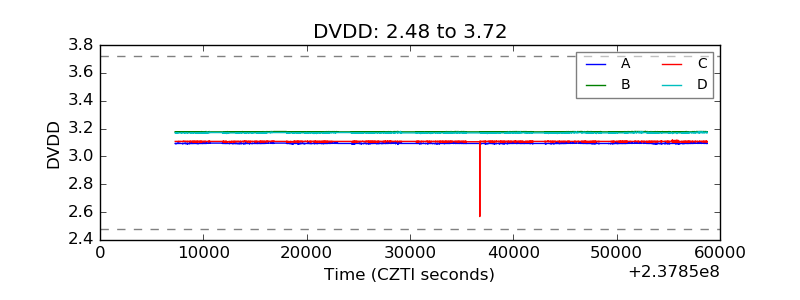 |
| Temperature 1 | 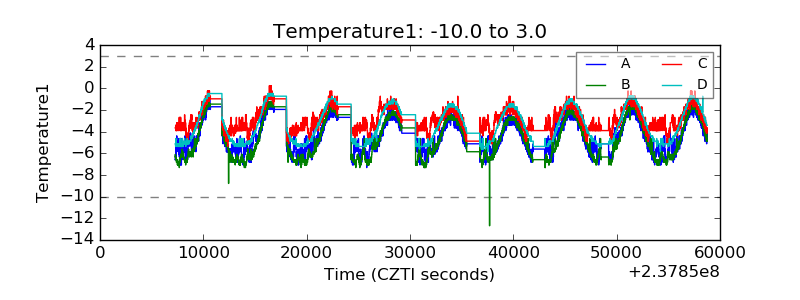 |
| Veto HV Monitor | 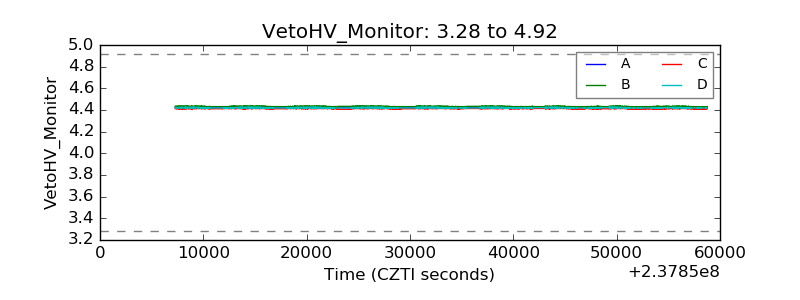 |
| Veto LLD |  |
| Alpha Counter | 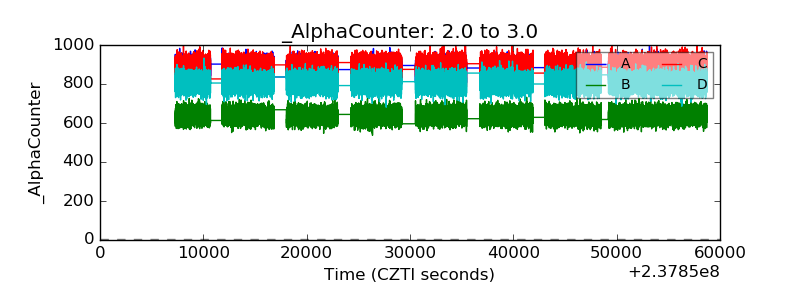 |
| _CPM_Rate | 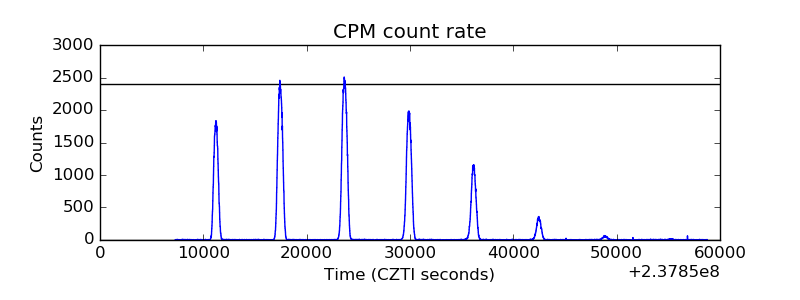 |
| CZT Counter | 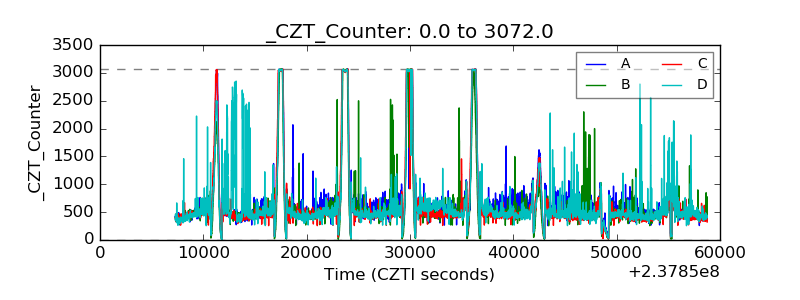 |
| +2.5 Volts monitor | 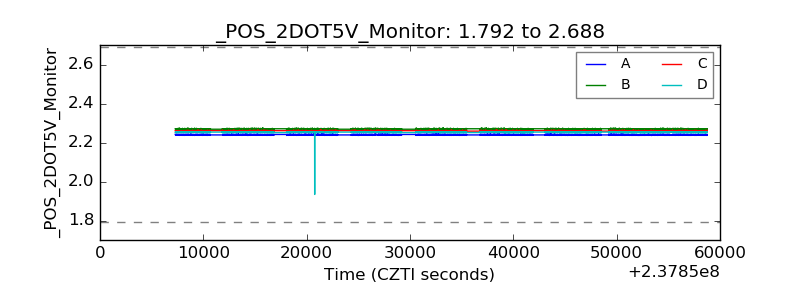 |
| +5 Volts monitor |  |
| _ROLL_ROT | 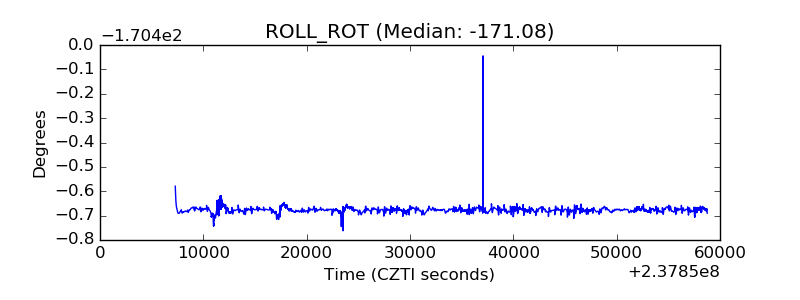 |
| _Roll_DEC | 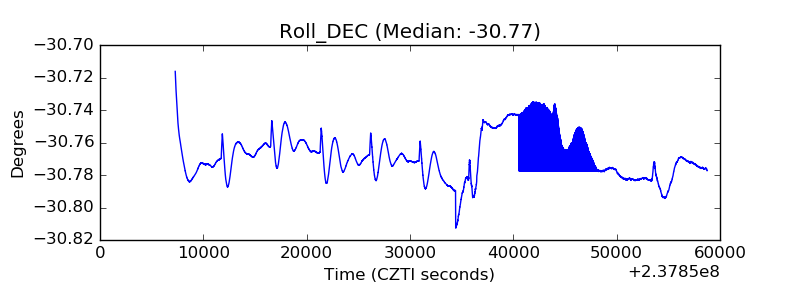 |
| _Roll_RA | 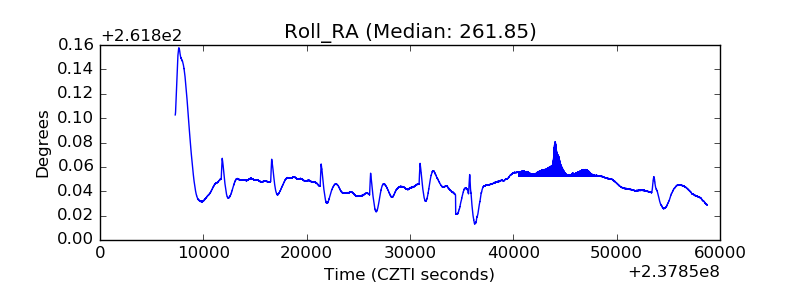 |
| Veto Counter | 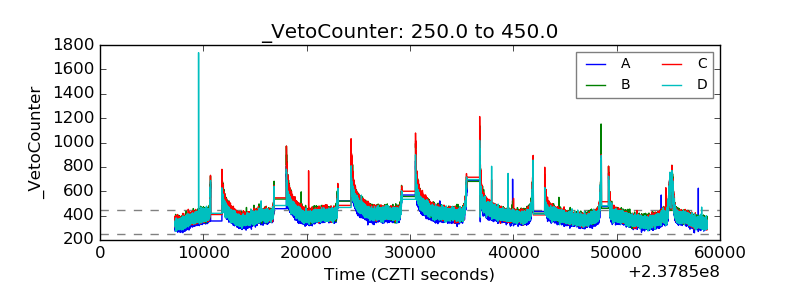 |