| Param | Original file | Final file |
|---|---|---|
| Filename | modeM0/AS1A02_029T01_9000001386_09723cztM0_level2.evt | modeM0/AS1A02_029T01_9000001386_09723cztM0_level2_quad_clean.evt |
| Size (bytes) | 327,778,560 | 53,326,080 |
| Size | 312.6 MB | 50.9 MB |
| Events in quadrant A | 2,210,219 | 325,646 |
| Events in quadrant B | 2,277,414 | 333,741 |
| Events in quadrant C | 2,143,568 | 328,287 |
| Events in quadrant D | 2,978,249 | 299,635 |
| Mode M0 | |||
|---|---|---|---|
| Quadrant | BADHDUFLAG | Total packets | Discarded packets |
| A | 0 | 9565 | 2 |
| B | 0 | 9890 | 1 |
| C | 0 | 9477 | 1 |
| D | 0 | 12098 | 1 |
| Mode M9 | |||
|---|---|---|---|
| Quadrant | BADHDUFLAG | Total packets | Discarded packets |
| A | 0 | 11 | 0 |
| B | 0 | 11 | 0 |
| C | 0 | 11 | 0 |
| D | 0 | 11 | 0 |
| Mode SS | |||
|---|---|---|---|
| Quadrant | BADHDUFLAG | Total packets | Discarded packets |
| A | 0 | 96 | 0 |
| B | 0 | 96 | 0 |
| C | 0 | 96 | 0 |
| D | 0 | 96 | 0 |
| Quadrant | Total seconds | Saturated seconds | Saturation percentage |
|---|---|---|---|
| A | 4650 | 18 | 0.387097% |
| B | 4650 | 21 | 0.451613% |
| C | 4650 | 8 | 0.172043% |
| D | 4650 | 201 | 4.322581% |
Noise dominated data is calculated using 1-second bins in cleaned event files. If a bin has >2000 counts, and if more than 50% of those come from <1% of pixels, then it is considered to be noise-dominated and hence unusable.
| Quadrant | # 1 sec bins | Bins with >0 counts | Bins with >2000 counts | High rate bins dominated by noise | Noise dominated (total time) | Noise dominated (detector-on time) | Marked lightcurve |
|---|---|---|---|---|---|---|---|
| A | 5750 | 4651 | 4 | 4 | 0.07% | 0.09% | 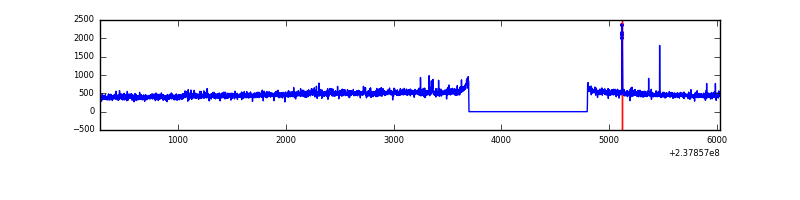 |
| B | 5750 | 4651 | 0 | 0 | 0.00% | 0.00% | 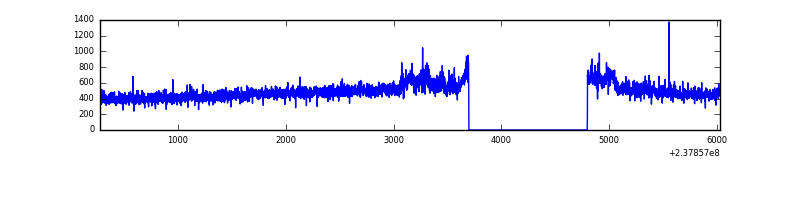 |
| C | 5750 | 4651 | 1 | 1 | 0.02% | 0.02% | 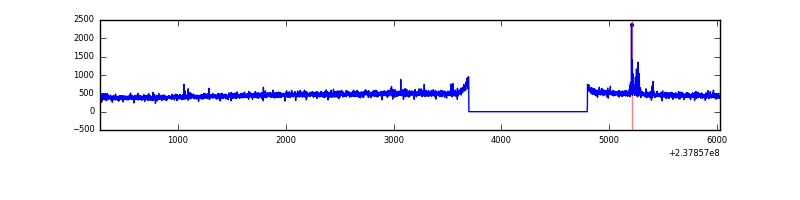 |
| D | 5750 | 4651 | 204 | 204 | 3.55% | 4.39% | 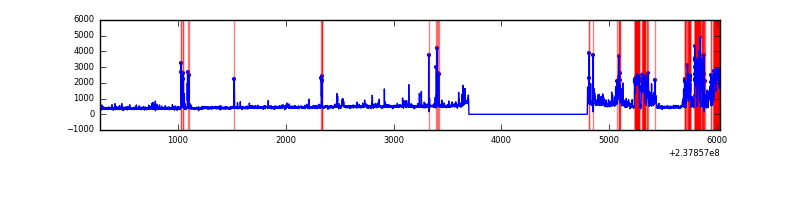 |
Top three noisy pixels from each quadrant. If the there are fewer than three noisy pixels in the level2.evt file, extra rows are filled as -1
| Pixel properties | Quadrant properties | ||||||
|---|---|---|---|---|---|---|---|
| Quadrant | DetID | PixID | Counts | Sigma | Mean | Median | Sigma |
| A | 1 | 162 | 26322 | 222.82 | 556 | 542 | 115.7 |
| A | 15 | 174 | 19866 | 167.02 | 556 | 542 | 115.7 |
| A | 1 | 178 | 10684 | 87.66 | 556 | 542 | 115.7 |
| B | 0 | 219 | 41981 | 381.94 | 561 | 546 | 108.5 |
| B | 0 | 214 | 33077 | 299.86 | 561 | 546 | 108.5 |
| B | 12 | 111 | 11885 | 104.52 | 561 | 546 | 108.5 |
| C | 14 | 234 | 19780 | 150.69 | 543 | 546 | 127.6 |
| C | 13 | 61 | 4104 | 27.88 | 543 | 546 | 127.6 |
| C | 8 | 222 | 2045 | 11.74 | 543 | 546 | 127.6 |
| D | 1 | 52 | 762987 | 5935.1 | 525 | 512 | 128.5 |
| D | 10 | 199 | 116692 | 904.34 | 525 | 512 | 128.5 |
| D | 12 | 233 | 62438 | 482.03 | 525 | 512 | 128.5 |
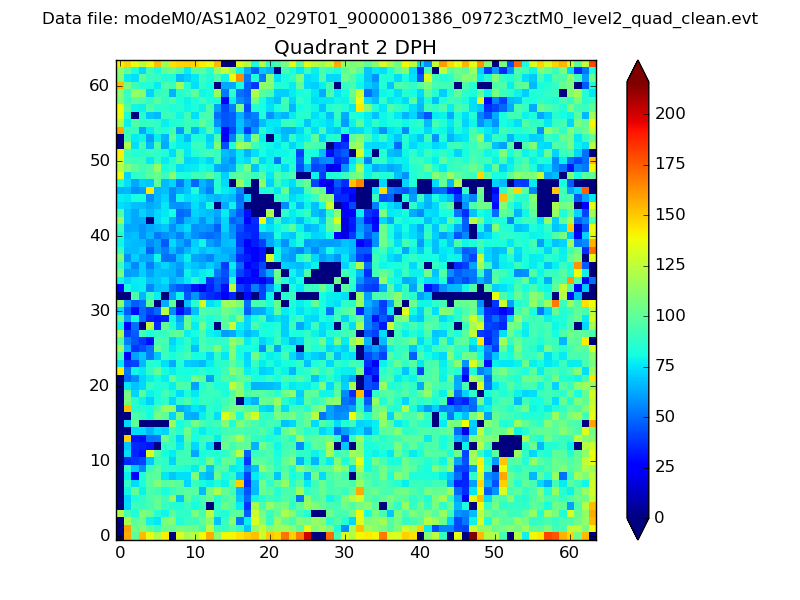
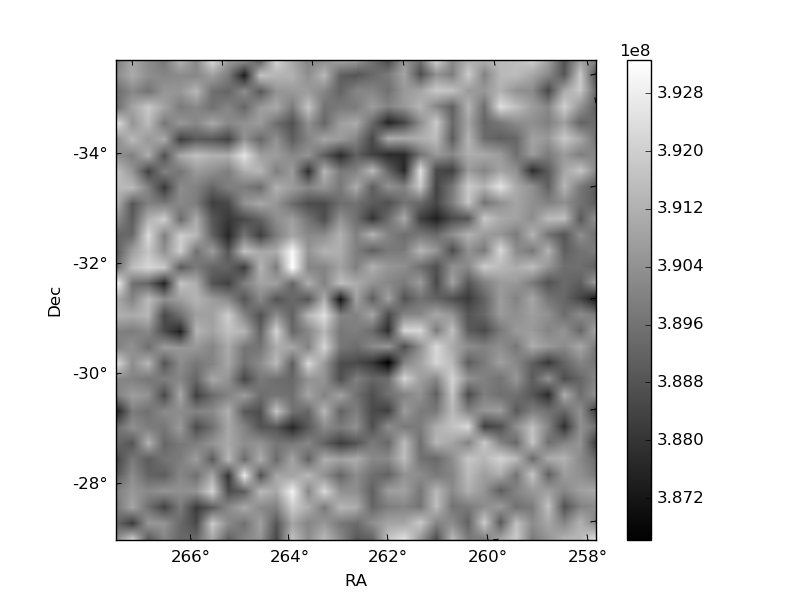
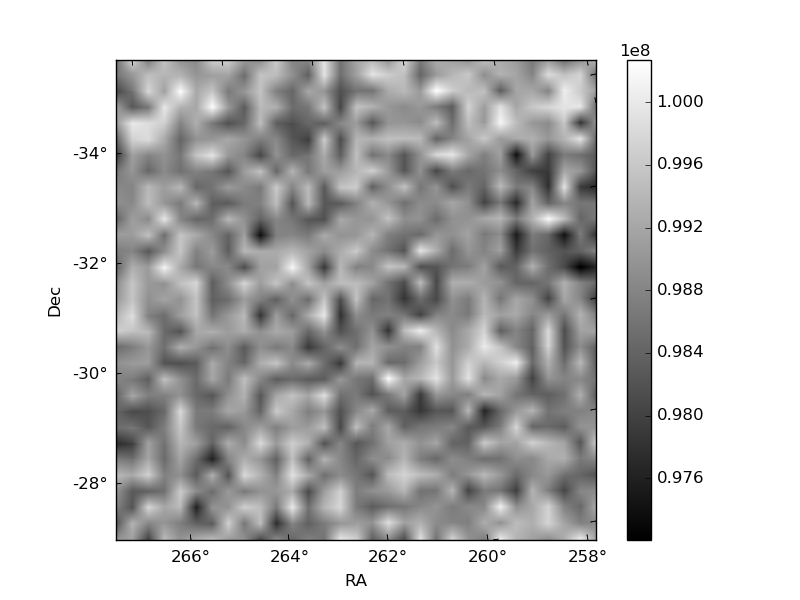
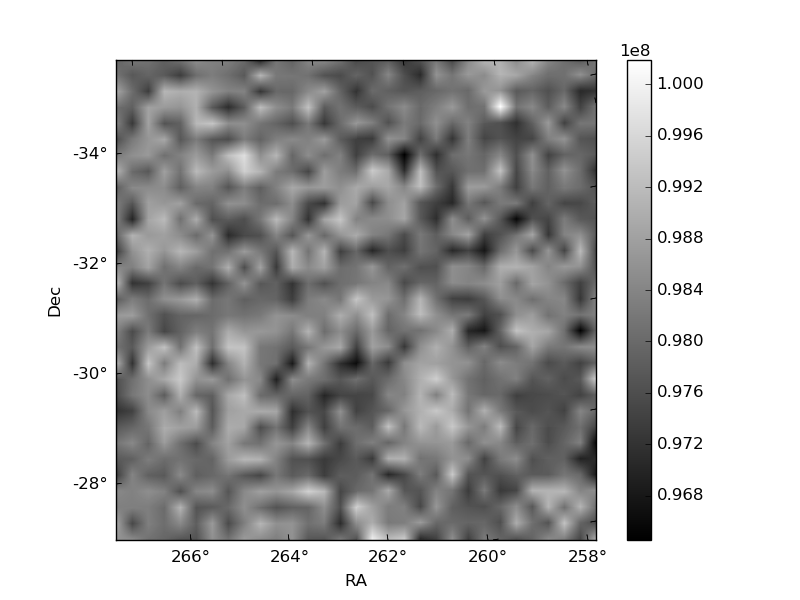
Histogram calculated using DETX and DETY for each event in the final _common_clean file
| Quadrant A | 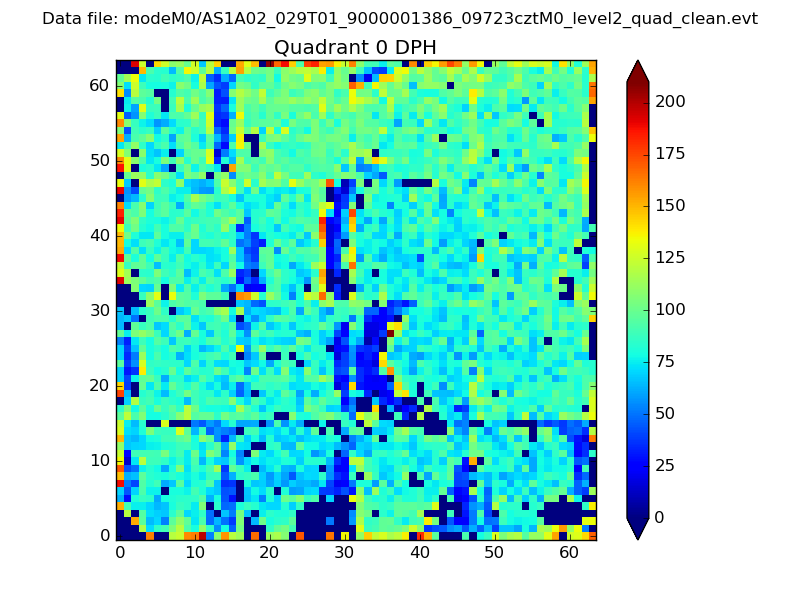 |
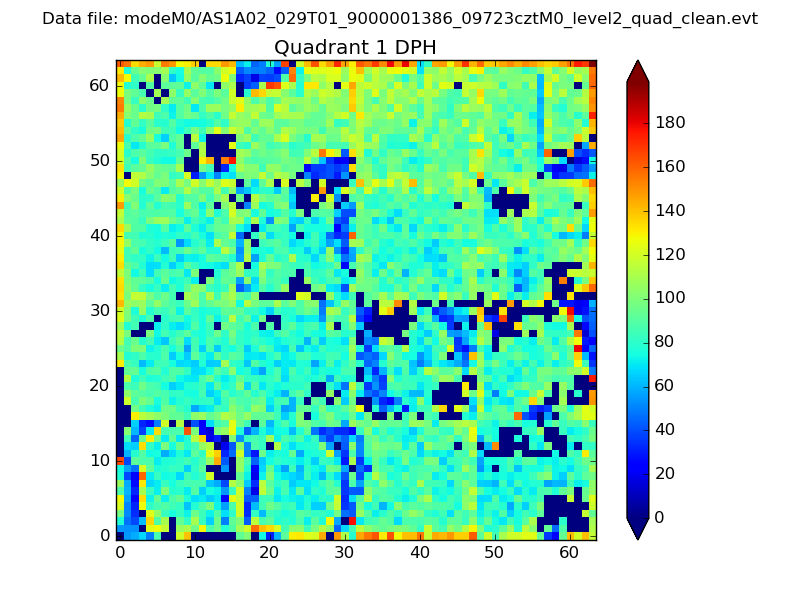 |
Quadrant B |
|---|---|---|---|
| Quadrant D | 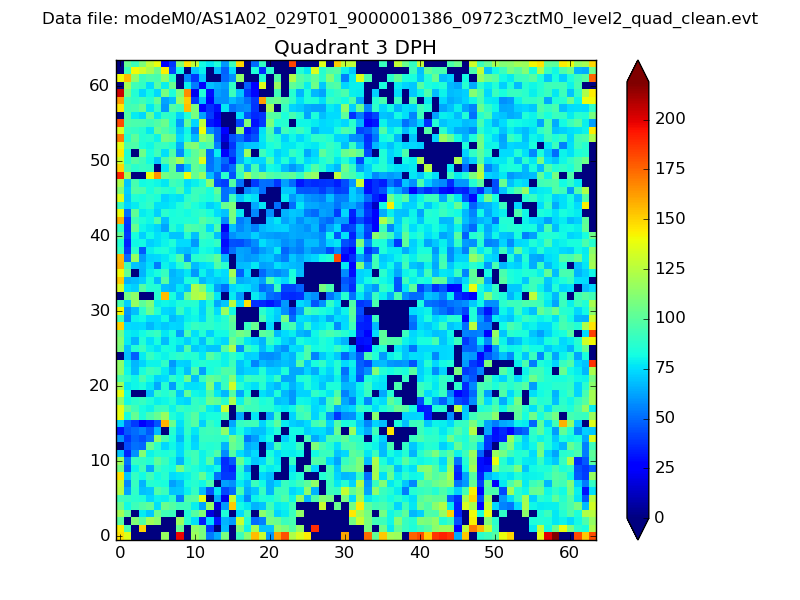 |
 |
Quadrant C |
| Plot type | Count rate plots | Images |
|---|---|---|
| Comparison with Poisson distribution Blue bars denote a histogram of data divided into 1 sec bins. Red curve is a Poisson curve with rate = median count rate of data. |
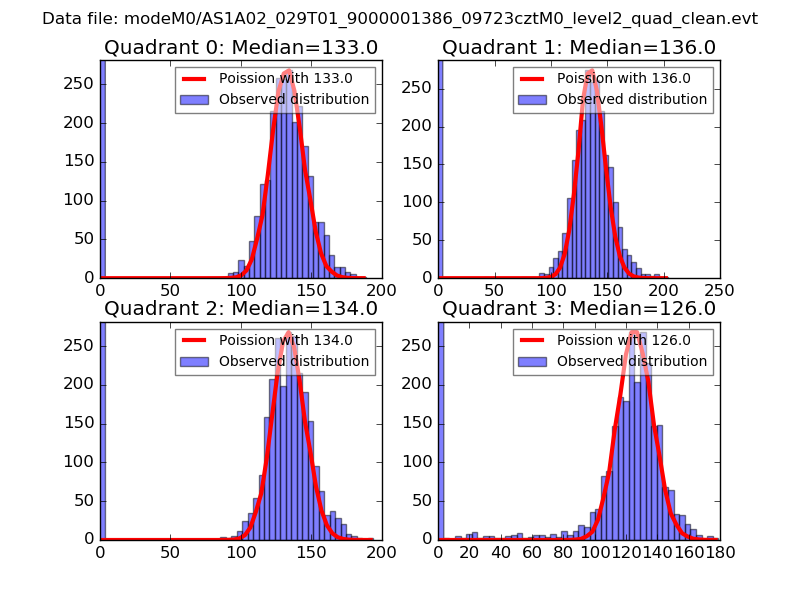 |
 |
| Quadrant-wise count rates Data is divided into 100 sec bins |
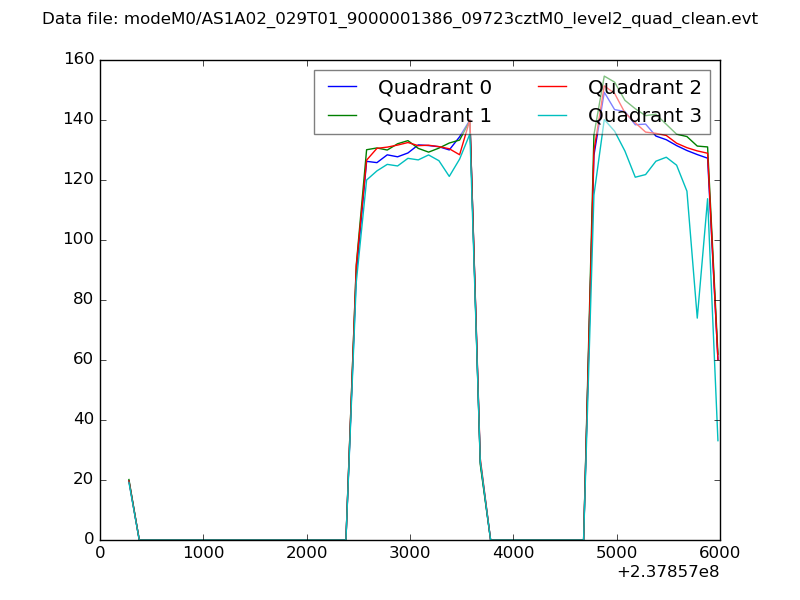 |
|
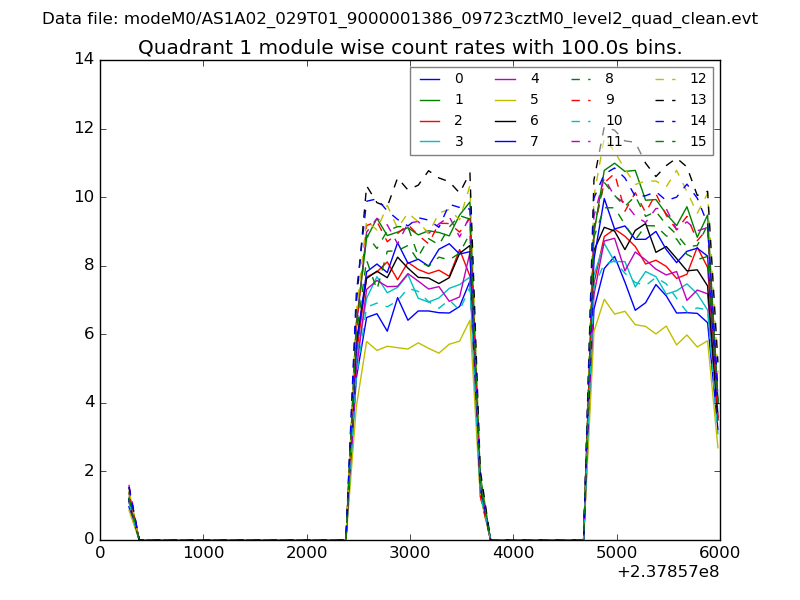
| Module-wise count rates for Quadrant A Data is divided into 100 sec bins |
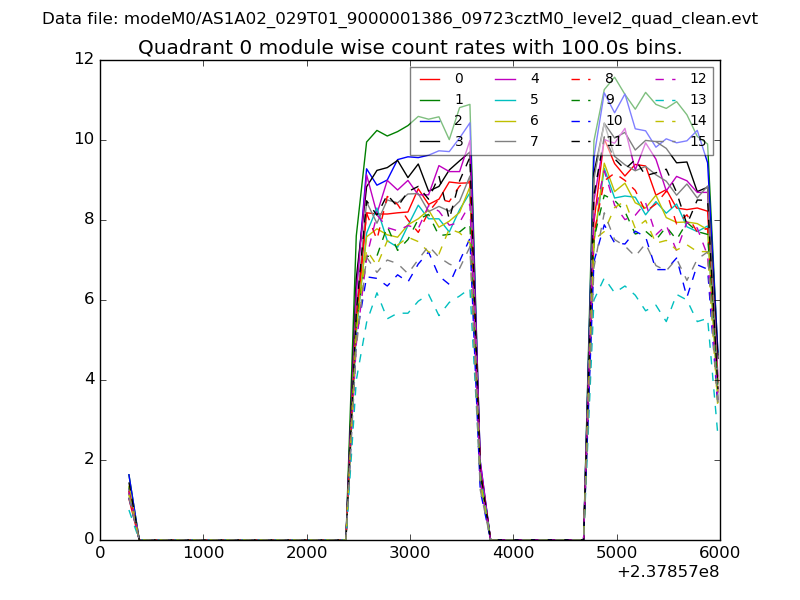 |
 |
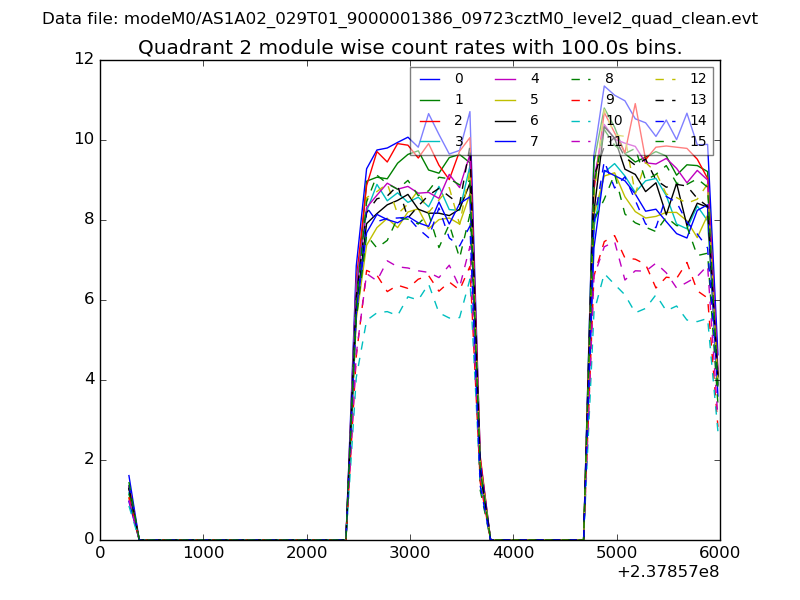
| Module-wise count rates for Quadrant B Data is divided into 100 sec bins |
 |
 |
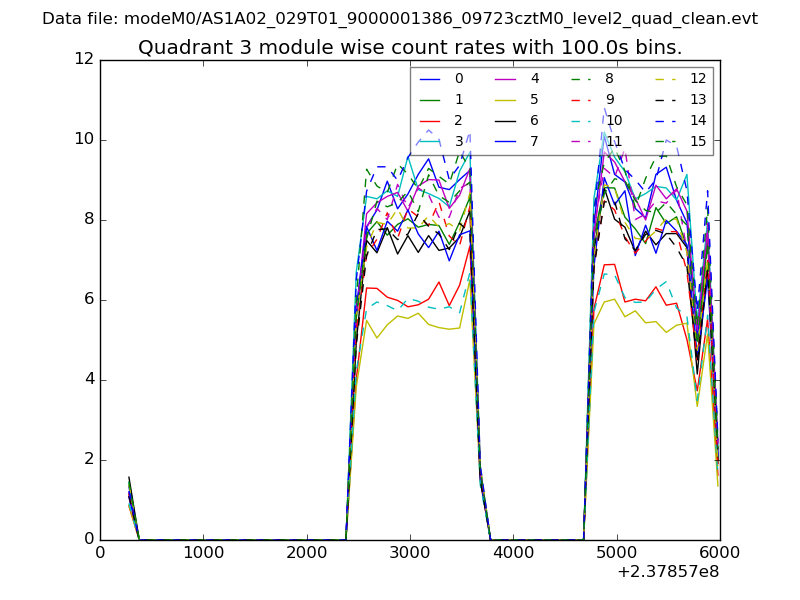
| Module-wise count rates for Quadrant C Data is divided into 100 sec bins |
 |
 |
| Module-wise count rates for Quadrant D Data is divided into 100 sec bins |
 |
 |
| Parameter | Plot |
|---|---|
| CZT HV Monitor |  |
| D_VDD |  |
| Temperature 1 | 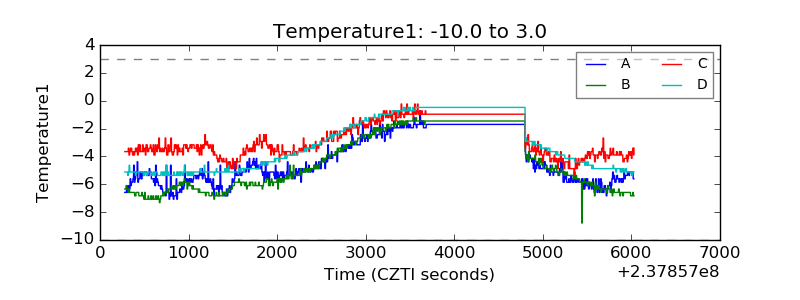 |
| Veto HV Monitor |  |
| Veto LLD | 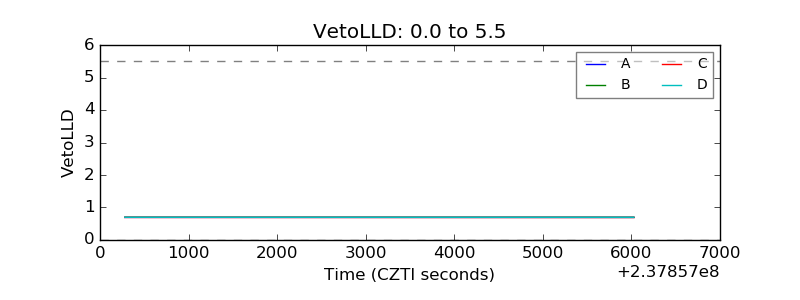 |
| Alpha Counter | 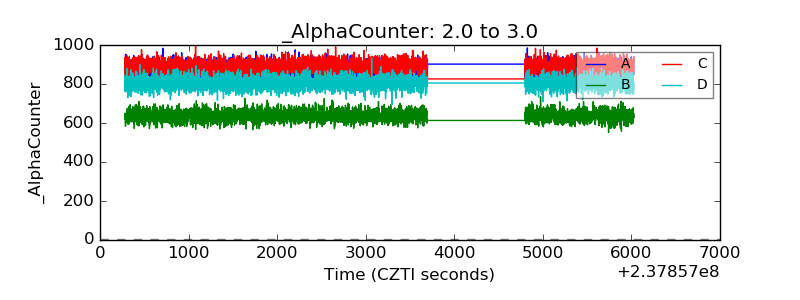 |
| _CPM_Rate | 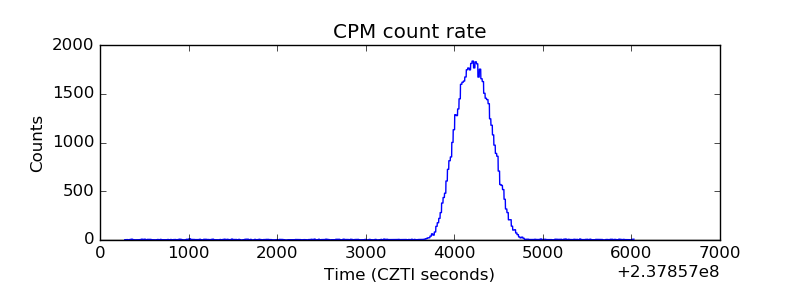 |
| CZT Counter |  |
| +2.5 Volts monitor |  |
| +5 Volts monitor | 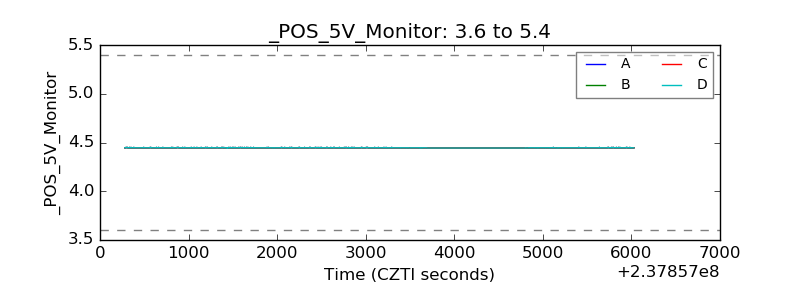 |
| _ROLL_ROT | 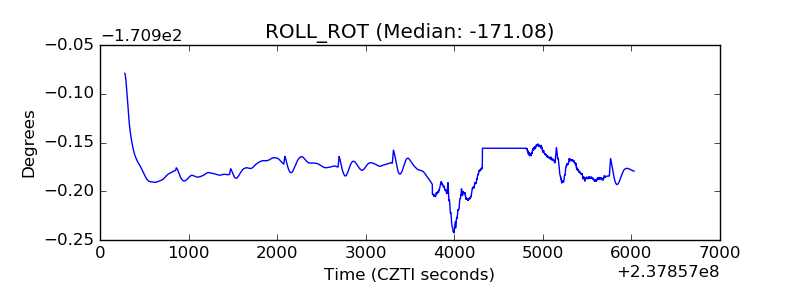 |
| _Roll_DEC | 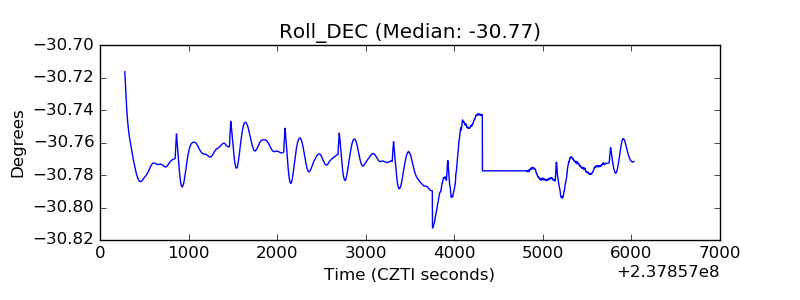 |
| _Roll_RA | 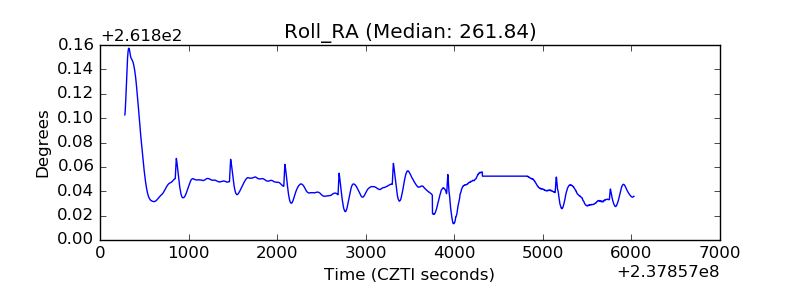 |
| Veto Counter | 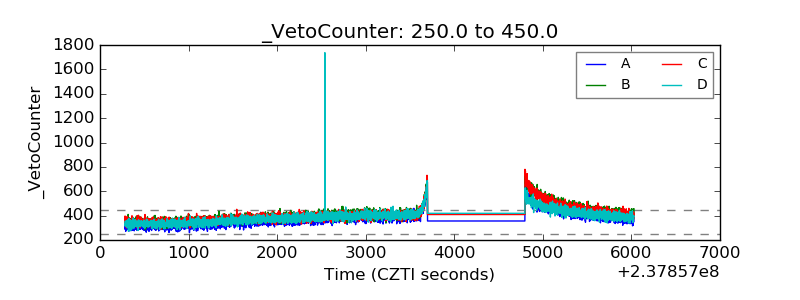 |