| Param | Original file | Final file |
|---|---|---|
| Filename | modeM0/AS1A02_029T01_9000001386_09726cztM0_level2.evt | modeM0/AS1A02_029T01_9000001386_09726cztM0_level2_quad_clean.evt |
| Size (bytes) | 474,750,720 | 67,818,240 |
| Size | 452.8 MB | 64.7 MB |
| Events in quadrant A | 3,828,378 | 401,845 |
| Events in quadrant B | 3,617,145 | 410,843 |
| Events in quadrant C | 3,111,346 | 408,842 |
| Events in quadrant D | 3,390,997 | 389,759 |
| Mode M0 | |||
|---|---|---|---|
| Quadrant | BADHDUFLAG | Total packets | Discarded packets |
| A | 0 | 15678 | 3 |
| B | 0 | 14539 | 2 |
| C | 0 | 13067 | 2 |
| D | 0 | 14145 | 2 |
| Mode M9 | |||
|---|---|---|---|
| Quadrant | BADHDUFLAG | Total packets | Discarded packets |
| A | 0 | 22 | 0 |
| B | 0 | 22 | 0 |
| C | 0 | 22 | 0 |
| D | 0 | 23 | 0 |
| Mode SS | |||
|---|---|---|---|
| Quadrant | BADHDUFLAG | Total packets | Discarded packets |
| A | 0 | 128 | 0 |
| B | 0 | 128 | 0 |
| C | 0 | 128 | 0 |
| D | 0 | 128 | 0 |
| Quadrant | Total seconds | Saturated seconds | Saturation percentage |
|---|---|---|---|
| A | 6338 | 37 | 0.583780% |
| B | 6338 | 116 | 1.830230% |
| C | 6338 | 22 | 0.347113% |
| D | 6338 | 31 | 0.489113% |
Noise dominated data is calculated using 1-second bins in cleaned event files. If a bin has >2000 counts, and if more than 50% of those come from <1% of pixels, then it is considered to be noise-dominated and hence unusable.
| Quadrant | # 1 sec bins | Bins with >0 counts | Bins with >2000 counts | High rate bins dominated by noise | Noise dominated (total time) | Noise dominated (detector-on time) | Marked lightcurve |
|---|---|---|---|---|---|---|---|
| A | 7673 | 6339 | 0 | 0 | 0.00% | 0.00% | 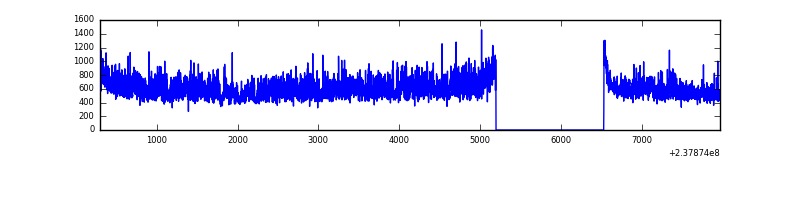 |
| B | 7673 | 6339 | 57 | 57 | 0.74% | 0.90% | 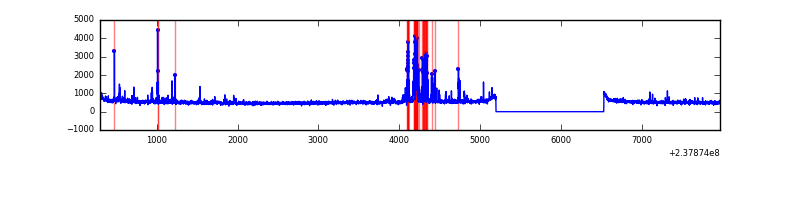 |
| C | 7673 | 6339 | 1 | 1 | 0.01% | 0.02% | 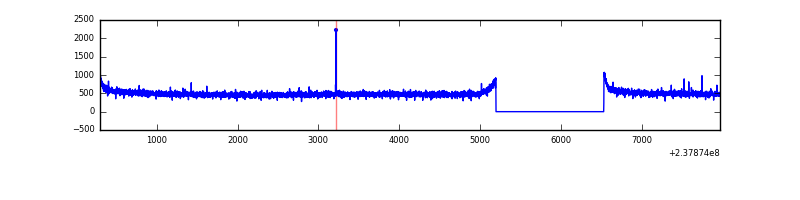 |
| D | 7673 | 6339 | 17 | 17 | 0.22% | 0.27% |  |
Top three noisy pixels from each quadrant. If the there are fewer than three noisy pixels in the level2.evt file, extra rows are filled as -1
| Pixel properties | Quadrant properties | ||||||
|---|---|---|---|---|---|---|---|
| Quadrant | DetID | PixID | Counts | Sigma | Mean | Median | Sigma |
| A | 1 | 162 | 327160 | 1995.49 | 807 | 792 | 163.6 |
| A | 1 | 178 | 147502 | 897.02 | 807 | 792 | 163.6 |
| A | 1 | 161 | 137180 | 833.91 | 807 | 792 | 163.6 |
| B | 10 | 245 | 275443 | 1784.68 | 819 | 801 | 153.9 |
| B | 4 | 173 | 83712 | 538.77 | 819 | 801 | 153.9 |
| B | 0 | 219 | 38022 | 241.87 | 819 | 801 | 153.9 |
| C | 13 | 61 | 5971 | 28.32 | 796 | 803 | 182.5 |
| C | 14 | 234 | 3082 | 12.49 | 796 | 803 | 182.5 |
| C | 8 | 222 | 2642 | 10.08 | 796 | 803 | 182.5 |
| D | 12 | 233 | 133579 | 709.5 | 781 | 763 | 187.2 |
| D | 2 | 152 | 117096 | 621.45 | 781 | 763 | 187.2 |
| D | 1 | 52 | 86456 | 457.77 | 781 | 763 | 187.2 |
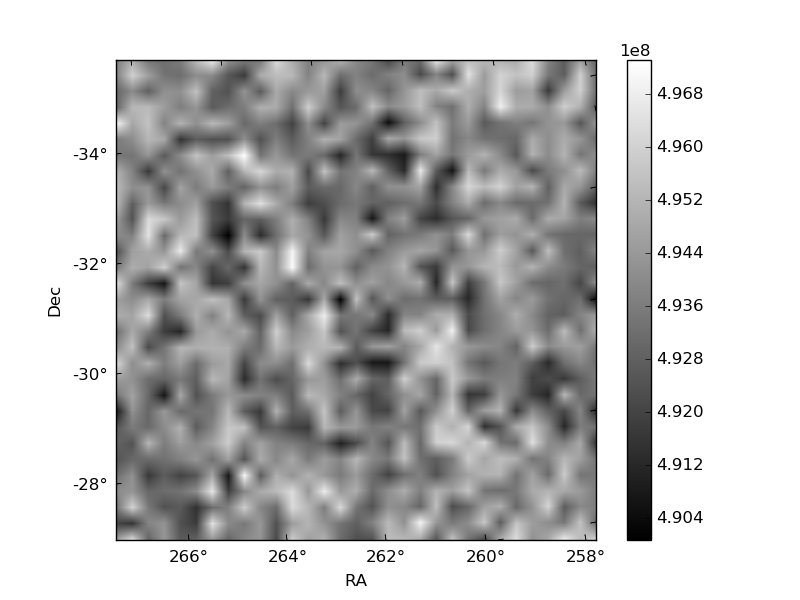
Histogram calculated using DETX and DETY for each event in the final _common_clean file
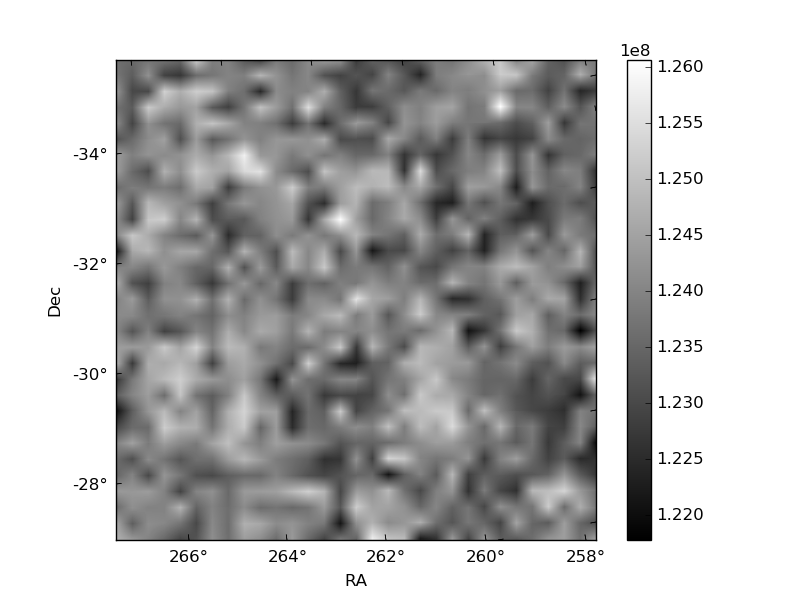
| Quadrant A |  |
 |
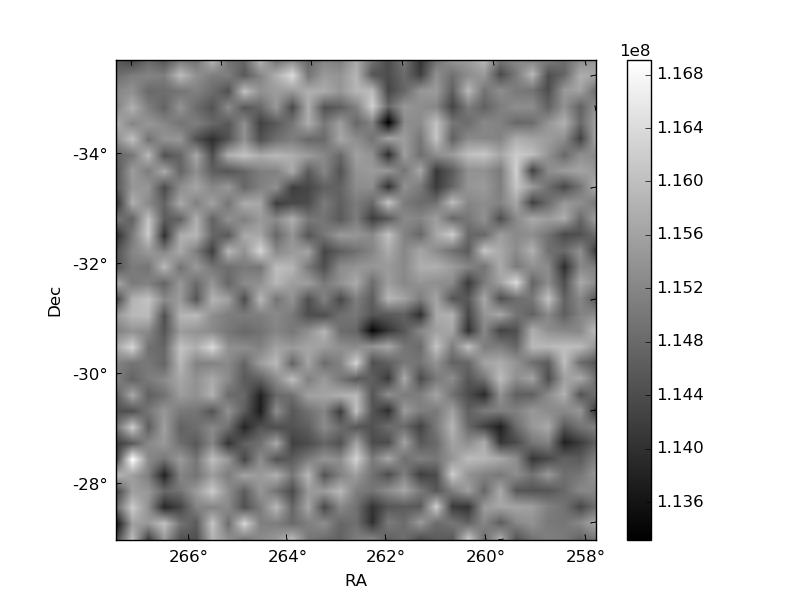
Quadrant B |
|---|---|---|---|
| Quadrant D | 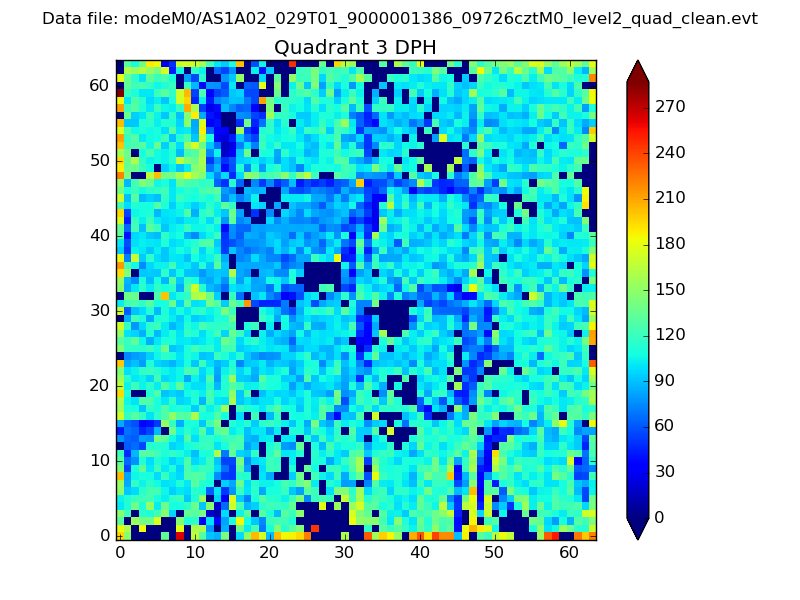 |
 |
Quadrant C |
| Plot type | Count rate plots | Images |
|---|---|---|
| Comparison with Poisson distribution Blue bars denote a histogram of data divided into 1 sec bins. Red curve is a Poisson curve with rate = median count rate of data. |
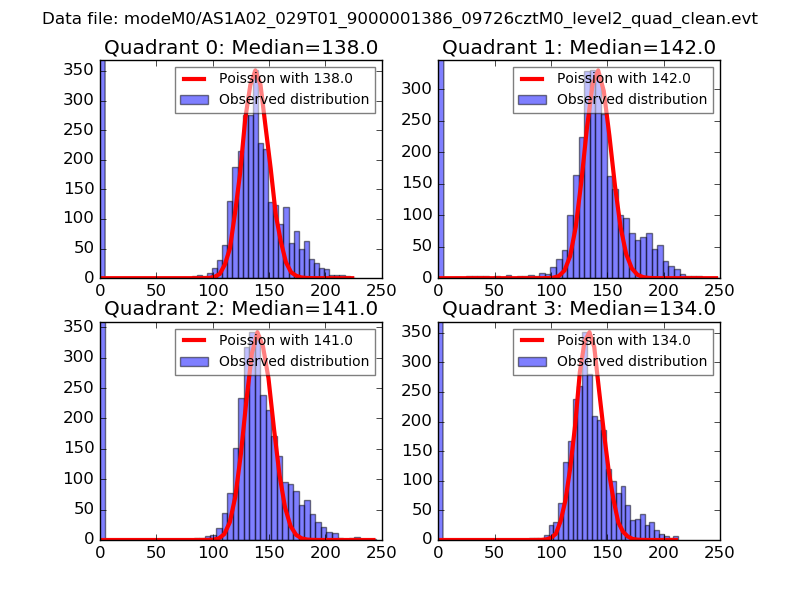 |
 |
| Quadrant-wise count rates Data is divided into 100 sec bins |
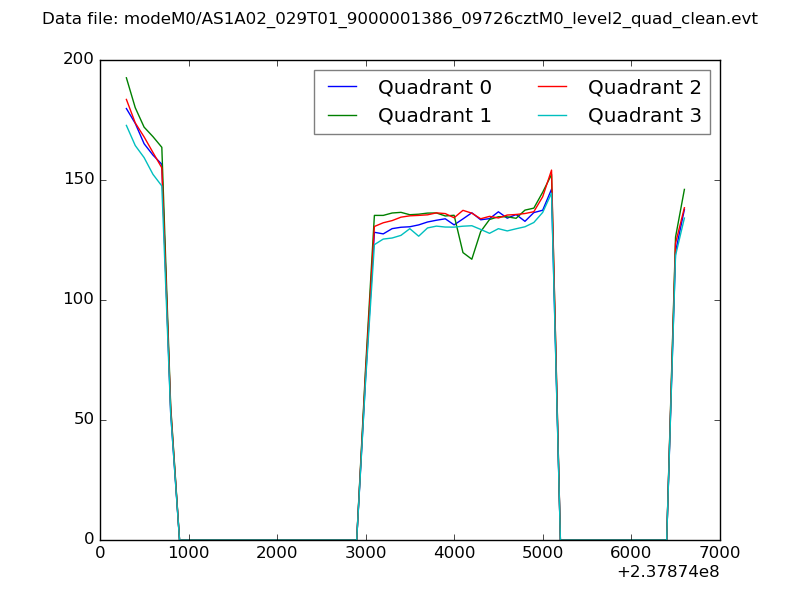 |
|
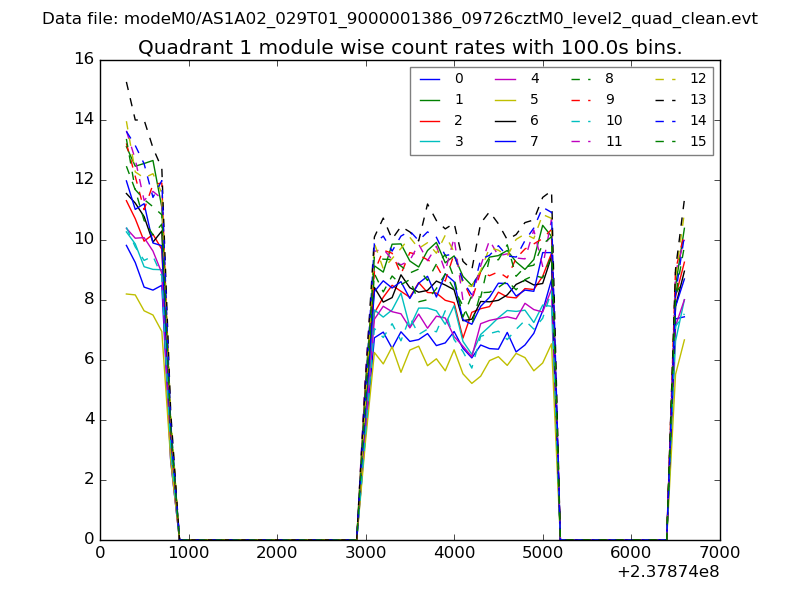
| Module-wise count rates for Quadrant A Data is divided into 100 sec bins |
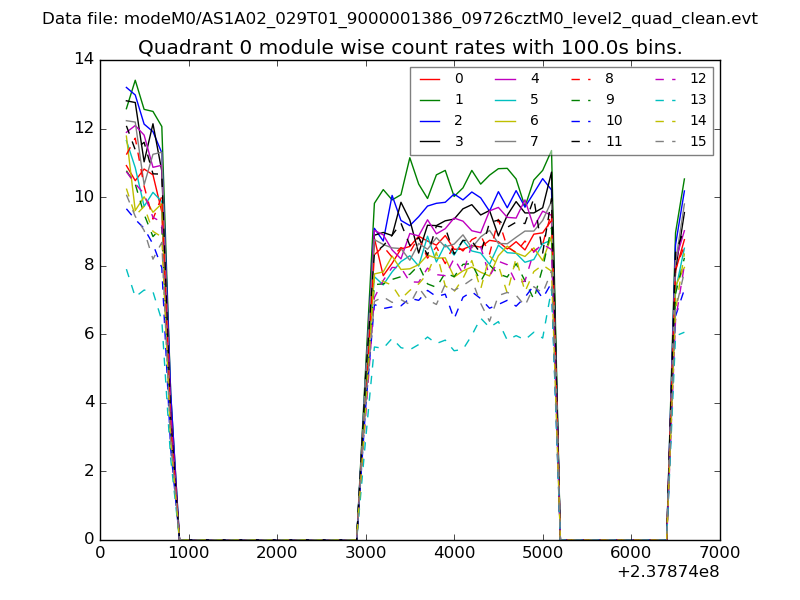 |
 |
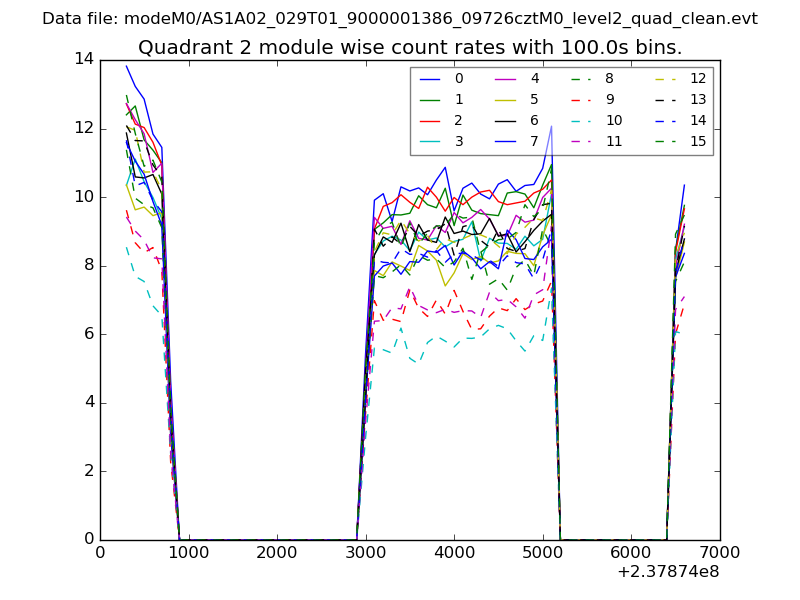
| Module-wise count rates for Quadrant B Data is divided into 100 sec bins |
 |
 |
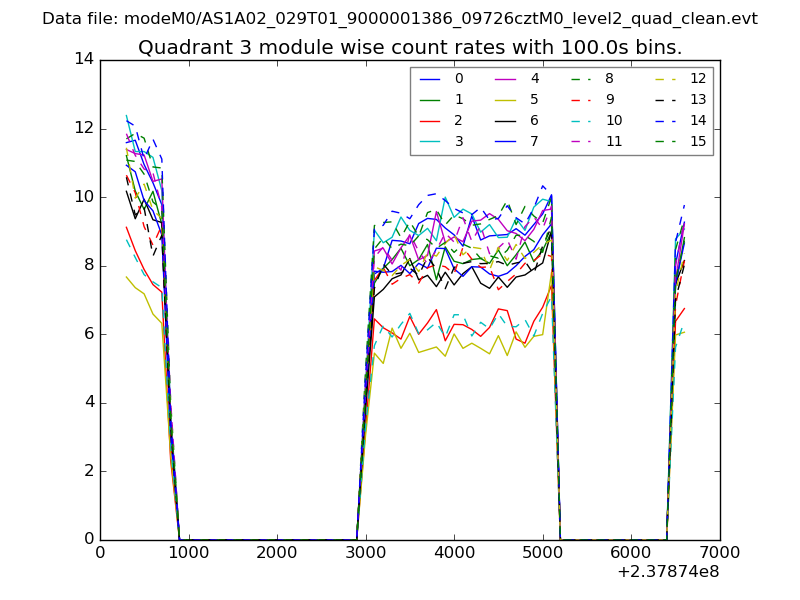
| Module-wise count rates for Quadrant C Data is divided into 100 sec bins |
 |
 |
| Module-wise count rates for Quadrant D Data is divided into 100 sec bins |
 |
 |
| Parameter | Plot |
|---|---|
| CZT HV Monitor | 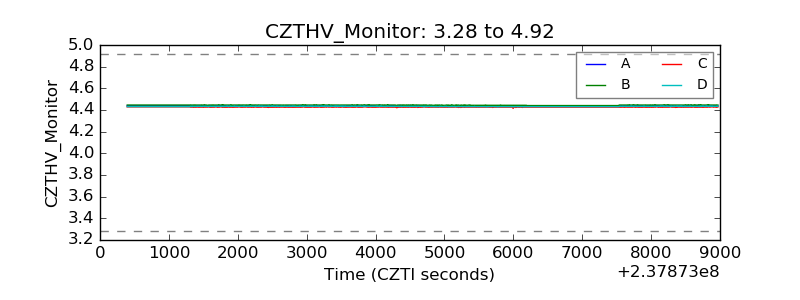 |
| D_VDD | 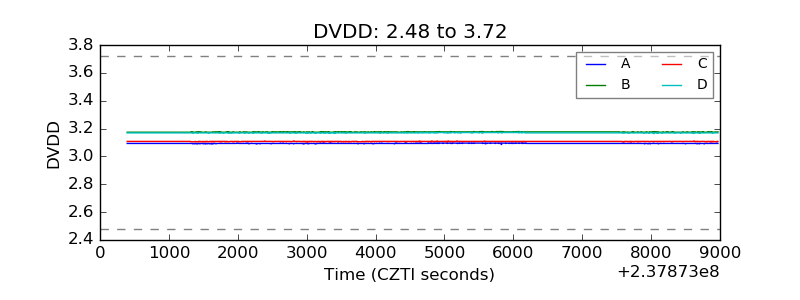 |
| Temperature 1 | 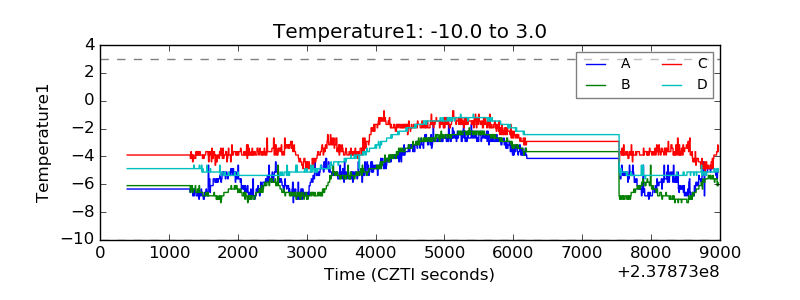 |
| Veto HV Monitor | 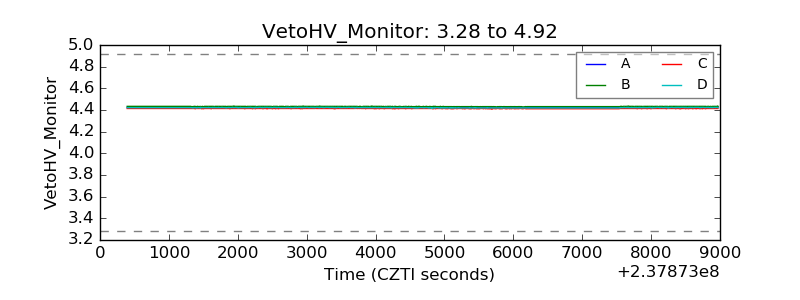 |
| Veto LLD | 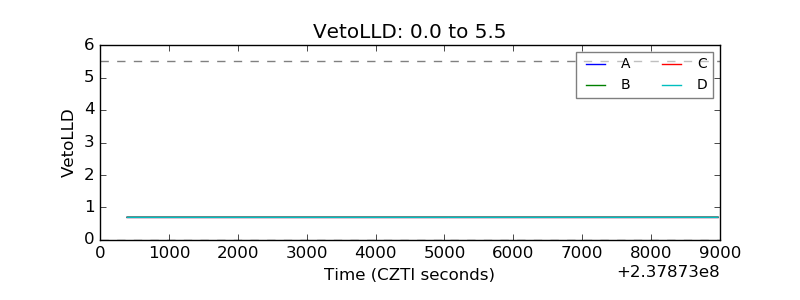 |
| Alpha Counter | 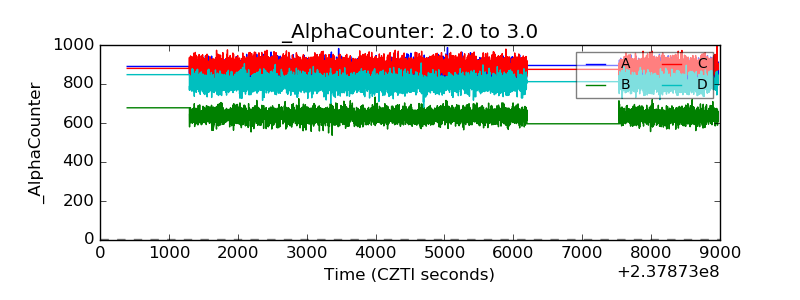 |
| _CPM_Rate | 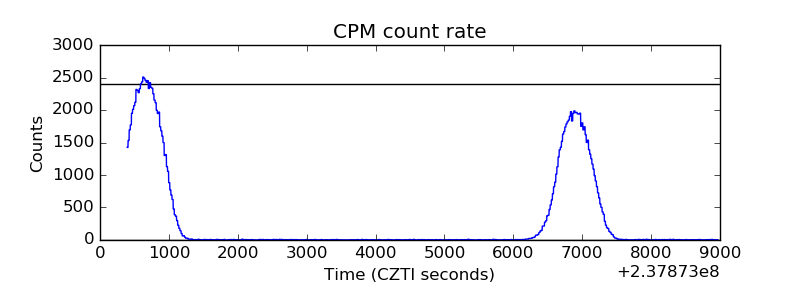 |
| CZT Counter | 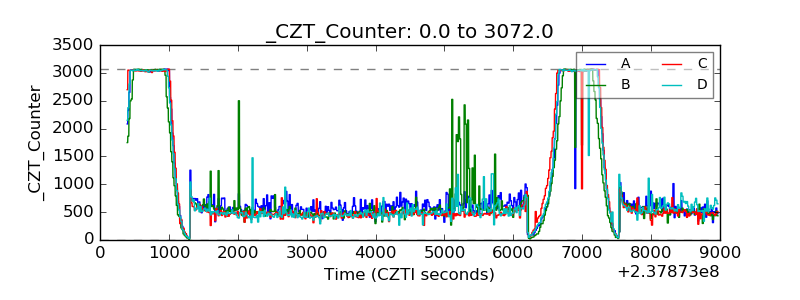 |
| +2.5 Volts monitor |  |
| +5 Volts monitor |  |
| _ROLL_ROT | 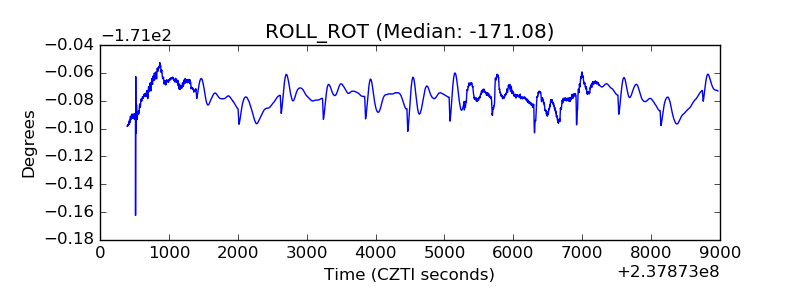 |
| _Roll_DEC | 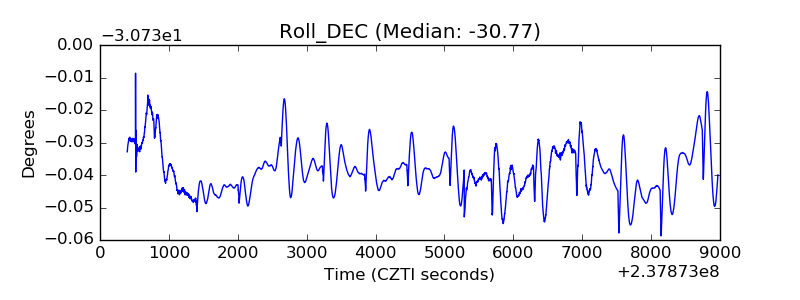 |
| _Roll_RA |  |
| Veto Counter | 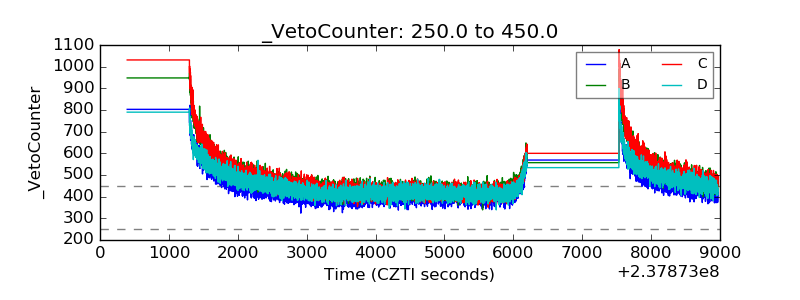 |