| Param | Original file | Final file |
|---|---|---|
| Filename | modeM0/AS1A02_029T01_9000001386_09728cztM0_level2.evt | modeM0/AS1A02_029T01_9000001386_09728cztM0_level2_quad_clean.evt |
| Size (bytes) | 436,999,680 | 66,913,920 |
| Size | 416.8 MB | 63.8 MB |
| Events in quadrant A | 3,713,552 | 395,927 |
| Events in quadrant B | 3,085,833 | 408,411 |
| Events in quadrant C | 2,923,639 | 408,589 |
| Events in quadrant D | 3,102,894 | 393,641 |
| Mode M0 | |||
|---|---|---|---|
| Quadrant | BADHDUFLAG | Total packets | Discarded packets |
| A | 0 | 16274 | 1135 |
| B | 0 | 13614 | 889 |
| C | 0 | 13309 | 748 |
| D | 0 | 14015 | 901 |
| Mode M9 | |||
|---|---|---|---|
| Quadrant | BADHDUFLAG | Total packets | Discarded packets |
| A | 0 | 20 | 0 |
| B | 0 | 20 | 1 |
| C | 0 | 20 | 1 |
| D | 0 | 21 | 1 |
| Mode SS | |||
|---|---|---|---|
| Quadrant | BADHDUFLAG | Total packets | Discarded packets |
| A | 0 | 130 | 6 |
| B | 0 | 130 | 10 |
| C | 0 | 130 | 6 |
| D | 0 | 130 | 10 |
| Quadrant | Total seconds | Saturated seconds | Saturation percentage |
|---|---|---|---|
| A | 5959 | 135 | 2.265481% |
| B | 6000 | 118 | 1.966667% |
| C | 6052 | 111 | 1.834104% |
| D | 6014 | 131 | 2.178251% |
Noise dominated data is calculated using 1-second bins in cleaned event files. If a bin has >2000 counts, and if more than 50% of those come from <1% of pixels, then it is considered to be noise-dominated and hence unusable.
| Quadrant | # 1 sec bins | Bins with >0 counts | Bins with >2000 counts | High rate bins dominated by noise | Noise dominated (total time) | Noise dominated (detector-on time) | Marked lightcurve |
|---|---|---|---|---|---|---|---|
| A | 7533 | 6254 | 1 | 1 | 0.01% | 0.02% | 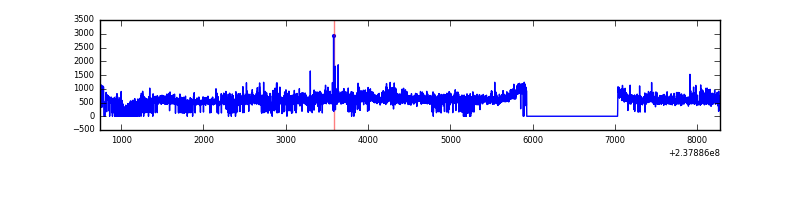 |
| B | 7533 | 6265 | 2 | 2 | 0.03% | 0.03% | 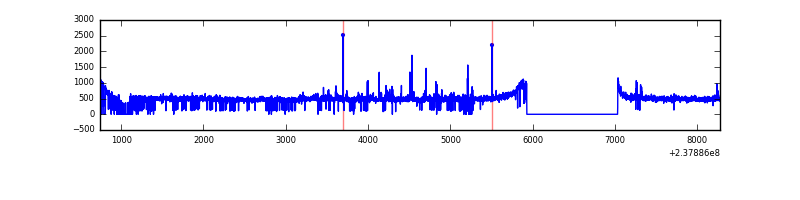 |
| C | 7533 | 6283 | 0 | 0 | 0.00% | 0.00% | 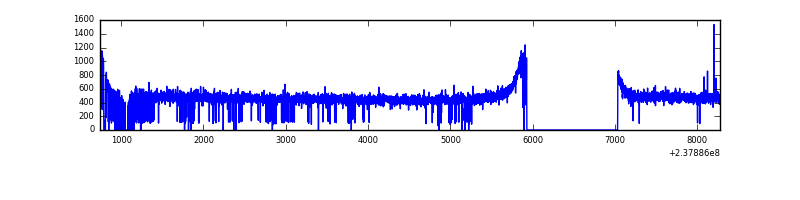 |
| D | 7533 | 6277 | 17 | 17 | 0.23% | 0.27% | 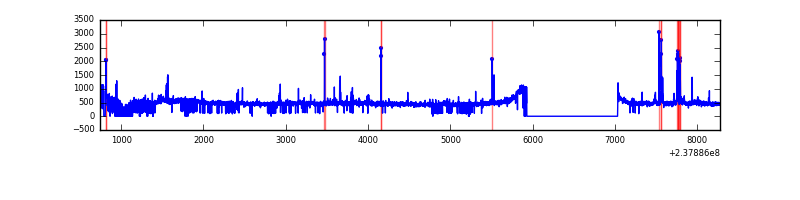 |
Top three noisy pixels from each quadrant. If the there are fewer than three noisy pixels in the level2.evt file, extra rows are filled as -1
| Pixel properties | Quadrant properties | ||||||
|---|---|---|---|---|---|---|---|
| Quadrant | DetID | PixID | Counts | Sigma | Mean | Median | Sigma |
| A | 1 | 162 | 353958 | 2305.86 | 749 | 734 | 153.2 |
| A | 1 | 178 | 173996 | 1131.06 | 749 | 734 | 153.2 |
| A | 1 | 161 | 160743 | 1044.54 | 749 | 734 | 153.2 |
| B | 4 | 173 | 50269 | 339.45 | 762 | 745 | 145.9 |
| B | 0 | 219 | 19989 | 131.9 | 762 | 745 | 145.9 |
| B | 0 | 187 | 16420 | 107.44 | 762 | 745 | 145.9 |
| C | 13 | 61 | 5494 | 27.31 | 749 | 752 | 173.6 |
| C | 12 | 4 | 2026 | 7.34 | 749 | 752 | 173.6 |
| C | 3 | 202 | 1840 | 6.27 | 749 | 752 | 173.6 |
| D | 1 | 52 | 126616 | 696.44 | 736 | 717 | 180.8 |
| D | 2 | 152 | 106529 | 585.32 | 736 | 717 | 180.8 |
| D | 12 | 233 | 44450 | 241.92 | 736 | 717 | 180.8 |
Histogram calculated using DETX and DETY for each event in the final _common_clean file
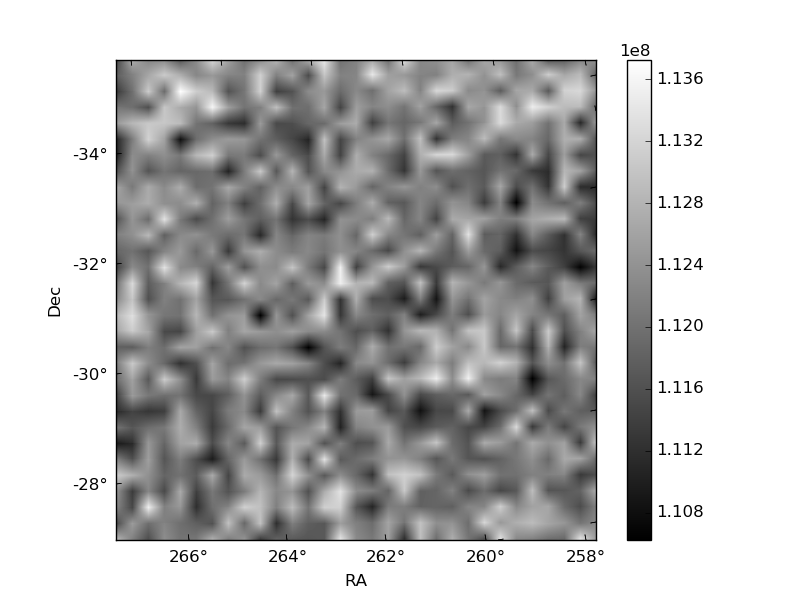
| Quadrant A |  |
 |
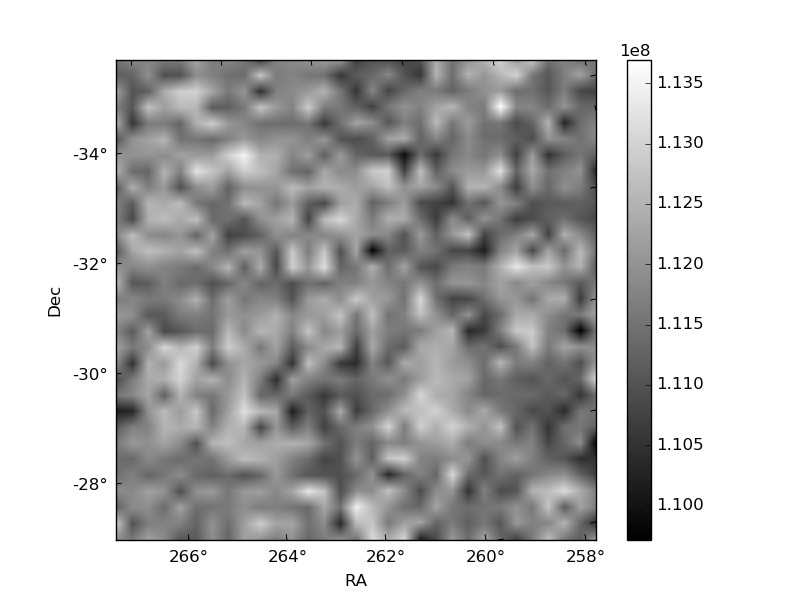
Quadrant B |
|---|---|---|---|
| Quadrant D |  |
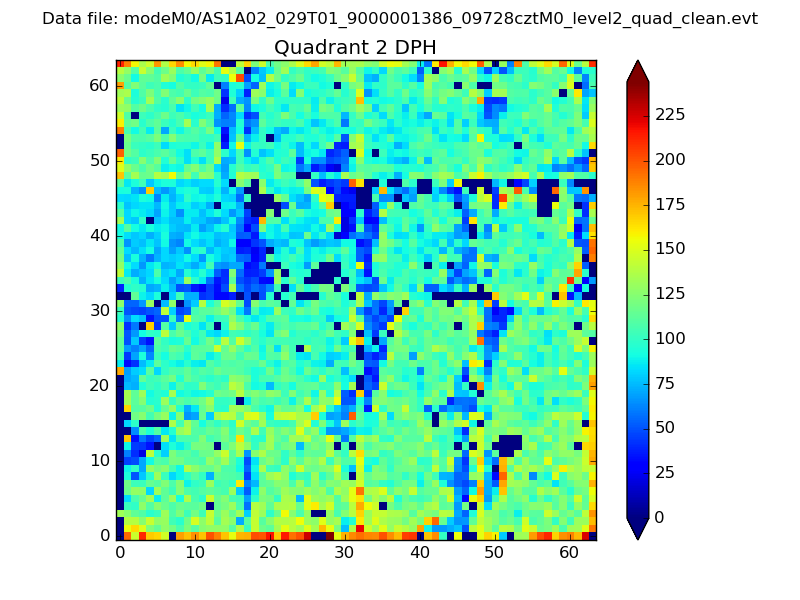 |
Quadrant C |
| Plot type | Count rate plots | Images |
|---|---|---|
| Comparison with Poisson distribution Blue bars denote a histogram of data divided into 1 sec bins. Red curve is a Poisson curve with rate = median count rate of data. |
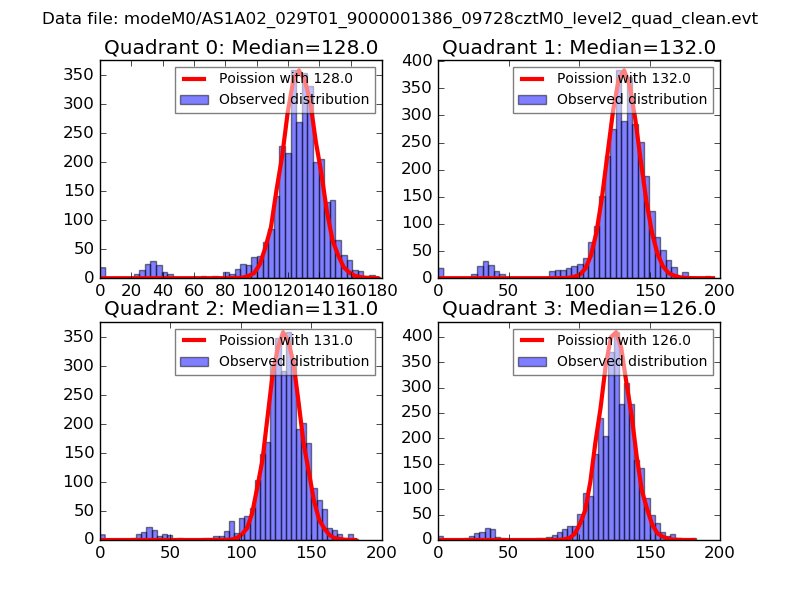 |
 |
| Quadrant-wise count rates Data is divided into 100 sec bins |
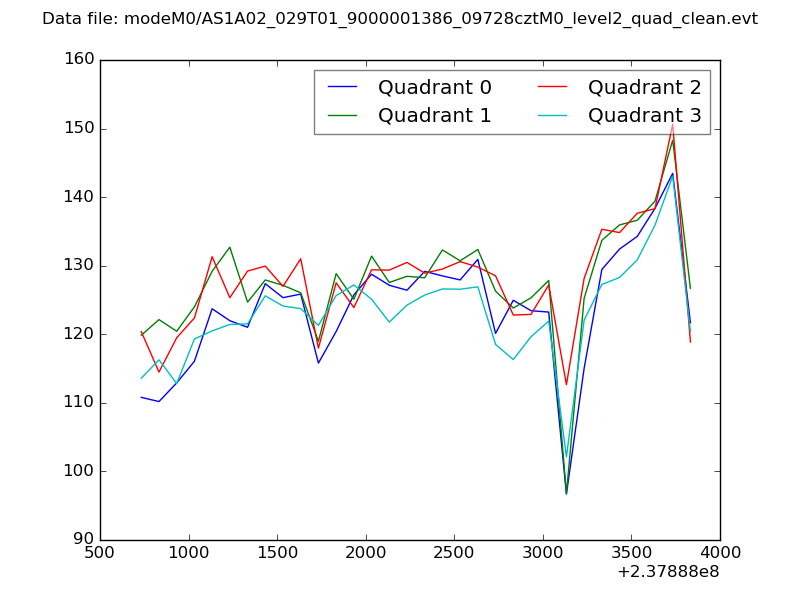 |
|
| Module-wise count rates for Quadrant A Data is divided into 100 sec bins |
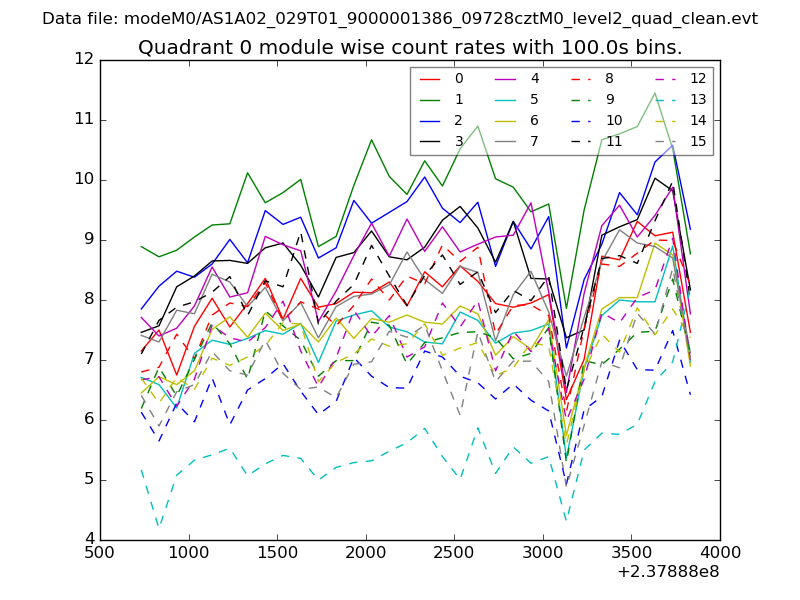 |
 |
| Module-wise count rates for Quadrant B Data is divided into 100 sec bins |
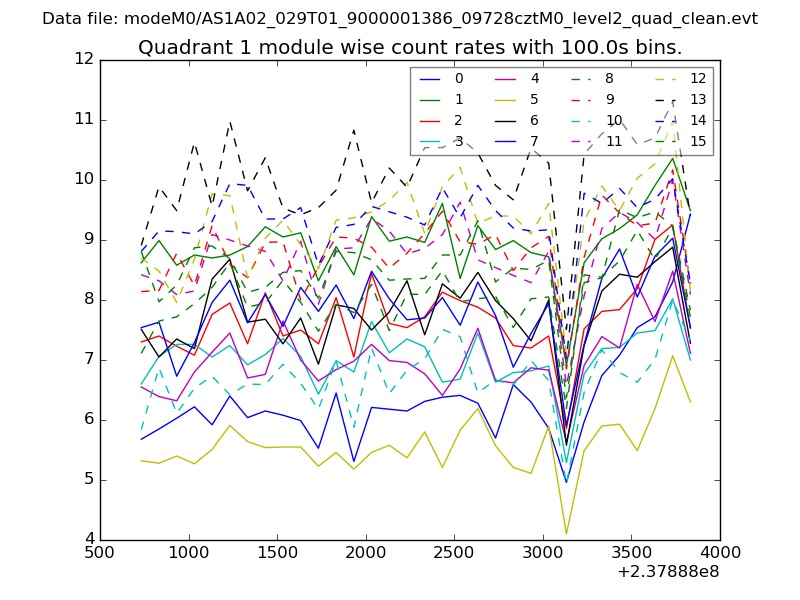 |
 |
| Module-wise count rates for Quadrant C Data is divided into 100 sec bins |
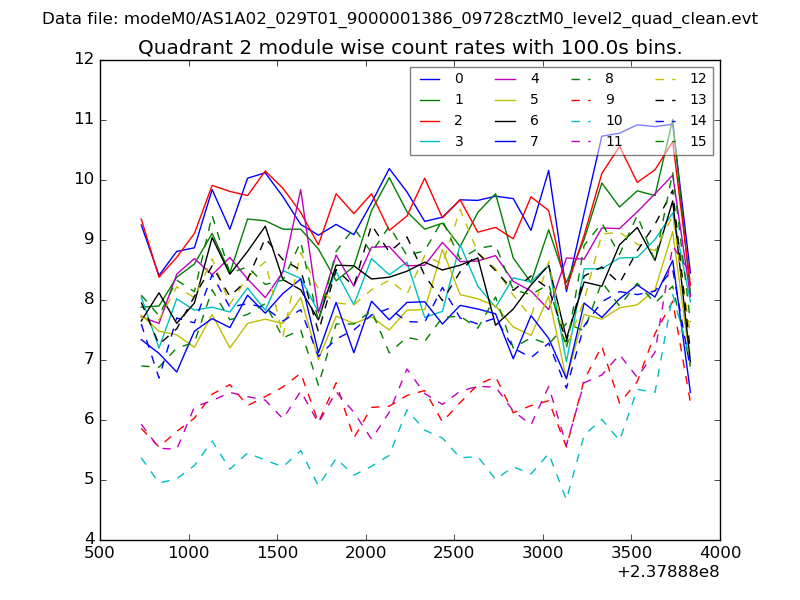 |
 |
| Module-wise count rates for Quadrant D Data is divided into 100 sec bins |
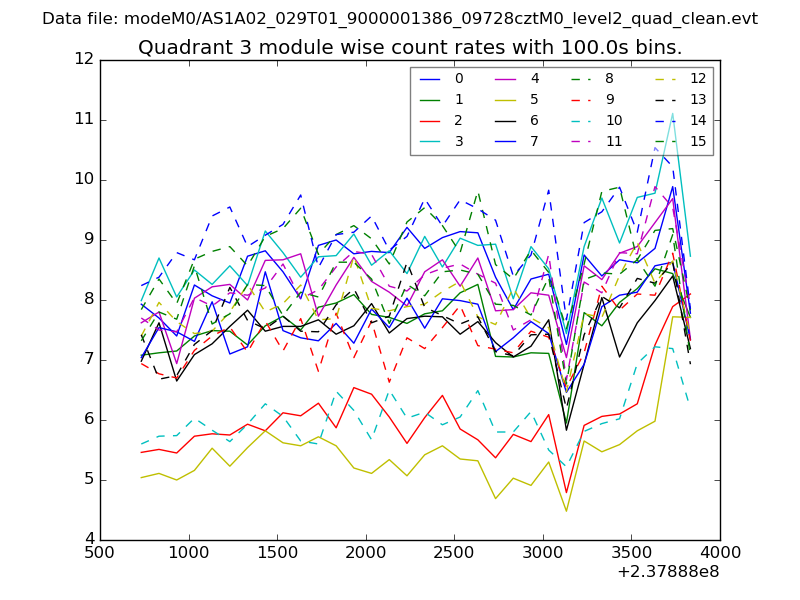 |
 |
| Parameter | Plot |
|---|---|
| CZT HV Monitor | 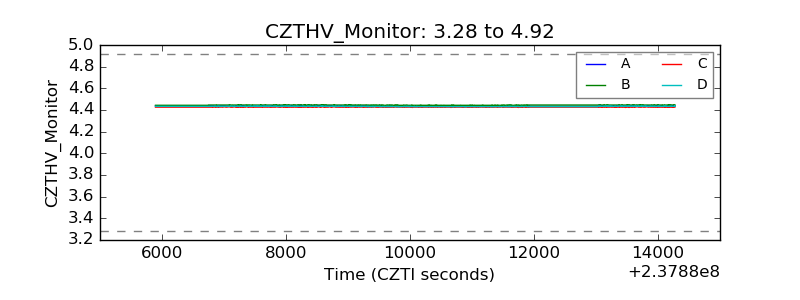 |
| D_VDD | 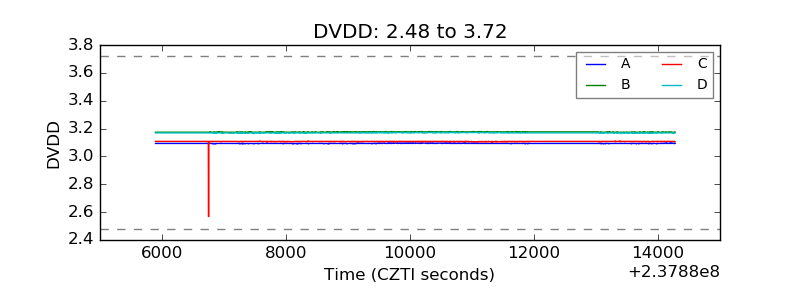 |
| Temperature 1 | 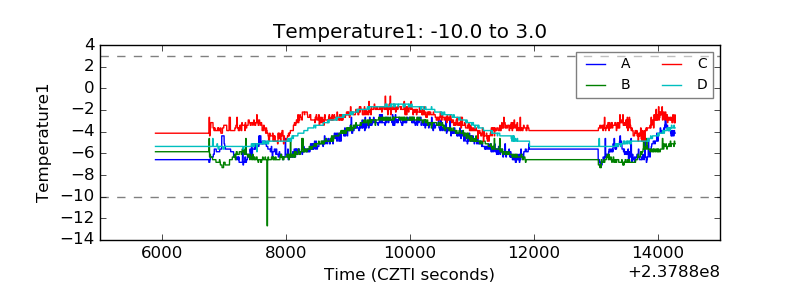 |
| Veto HV Monitor | 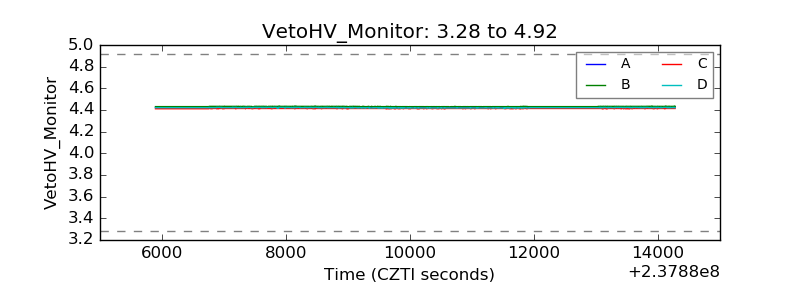 |
| Veto LLD | 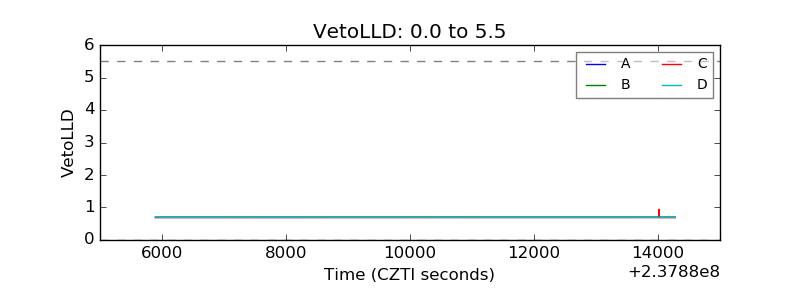 |
| Alpha Counter | 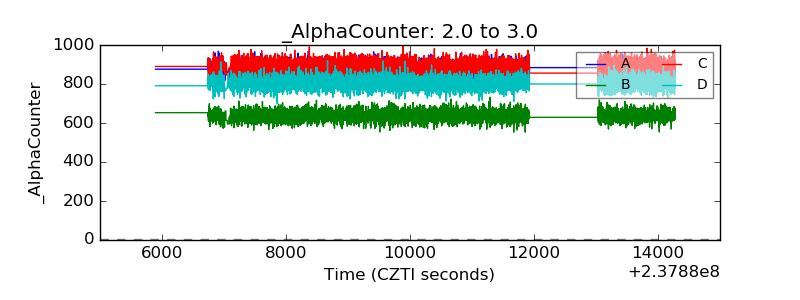 |
| _CPM_Rate | 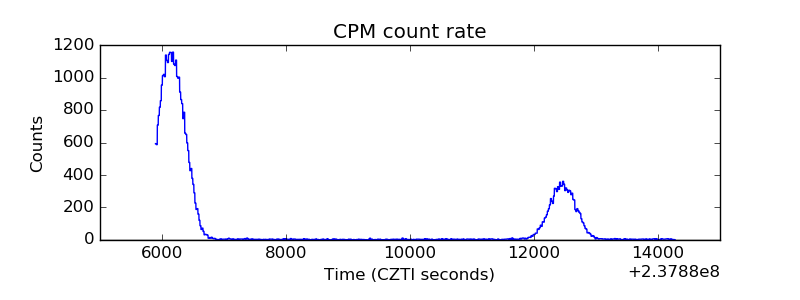 |
| CZT Counter | 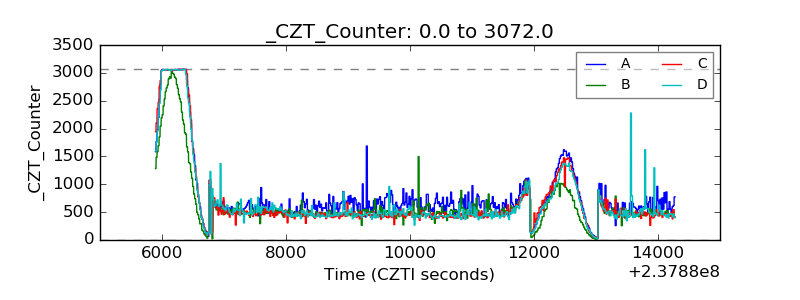 |
| +2.5 Volts monitor |  |
| +5 Volts monitor | 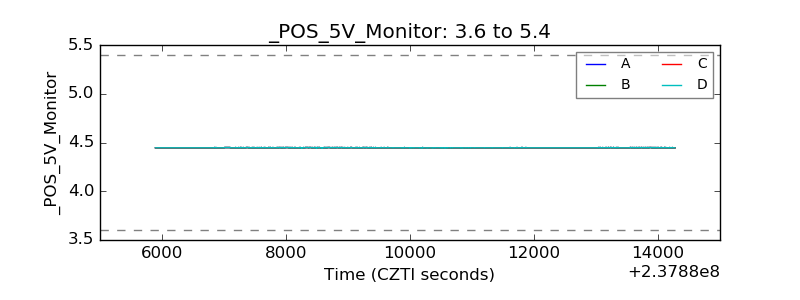 |
| _ROLL_ROT | 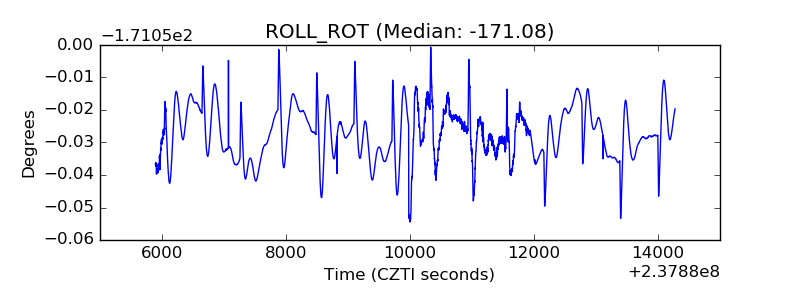 |
| _Roll_DEC | 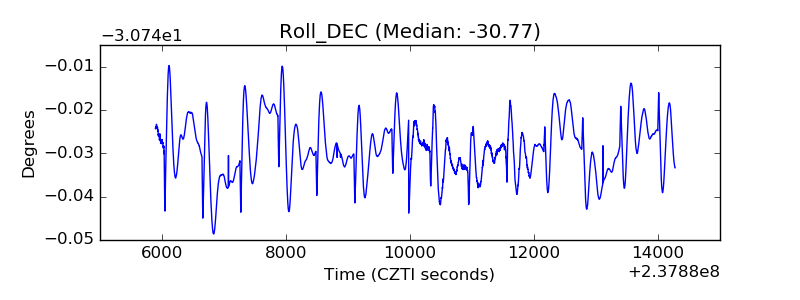 |
| _Roll_RA | 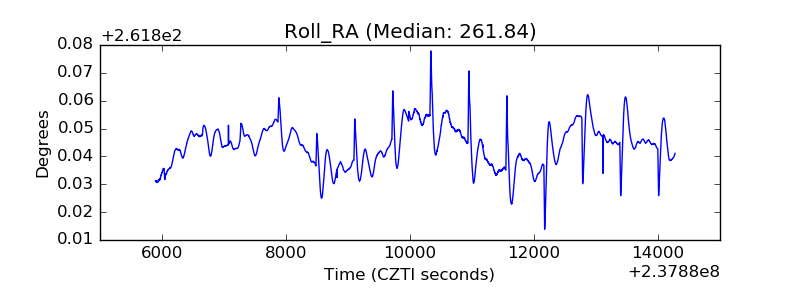 |
| Veto Counter | 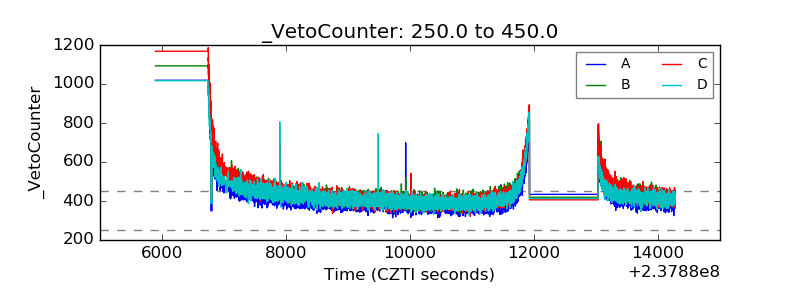 |