| Param | Original file | Final file |
|---|---|---|
| Filename | modeM0/AS1A02_029T01_9000001386_09730cztM0_level2.evt | modeM0/AS1A02_029T01_9000001386_09730cztM0_level2_quad_clean.evt |
| Size (bytes) | 588,510,720 | 95,990,400 |
| Size | 561.2 MB | 91.5 MB |
| Events in quadrant A | 4,483,179 | 582,618 |
| Events in quadrant B | 4,177,825 | 593,495 |
| Events in quadrant C | 3,970,601 | 589,812 |
| Events in quadrant D | 4,626,191 | 562,933 |
| Mode M0 | |||
|---|---|---|---|
| Quadrant | BADHDUFLAG | Total packets | Discarded packets |
| A | 0 | 18972 | 247 |
| B | 0 | 17906 | 245 |
| C | 0 | 17676 | 235 |
| D | 0 | 19643 | 231 |
| Mode M9 | |||
|---|---|---|---|
| Quadrant | BADHDUFLAG | Total packets | Discarded packets |
| A | 0 | 9 | 0 |
| B | 0 | 9 | 0 |
| C | 0 | 9 | 0 |
| D | 0 | 9 | 0 |
| Mode SS | |||
|---|---|---|---|
| Quadrant | BADHDUFLAG | Total packets | Discarded packets |
| A | 0 | 172 | 0 |
| B | 0 | 172 | 4 |
| C | 0 | 172 | 2 |
| D | 0 | 172 | 4 |
| Quadrant | Total seconds | Saturated seconds | Saturation percentage |
|---|---|---|---|
| A | 8326 | 424 | 5.092481% |
| B | 8321 | 416 | 4.999399% |
| C | 8321 | 320 | 3.845692% |
| D | 8327 | 502 | 6.028582% |
Noise dominated data is calculated using 1-second bins in cleaned event files. If a bin has >2000 counts, and if more than 50% of those come from <1% of pixels, then it is considered to be noise-dominated and hence unusable.
| Quadrant | # 1 sec bins | Bins with >0 counts | Bins with >2000 counts | High rate bins dominated by noise | Noise dominated (total time) | Noise dominated (detector-on time) | Marked lightcurve |
|---|---|---|---|---|---|---|---|
| A | 9286 | 8423 | 0 | 0 | 0.00% | 0.00% | 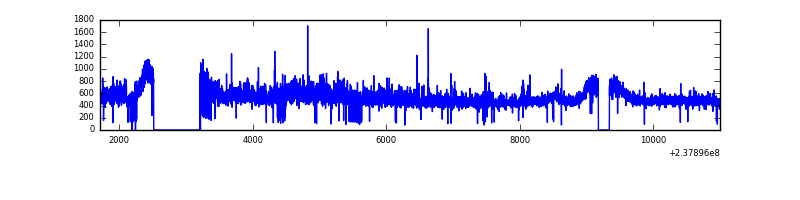 |
| B | 9286 | 8418 | 3 | 3 | 0.03% | 0.04% | 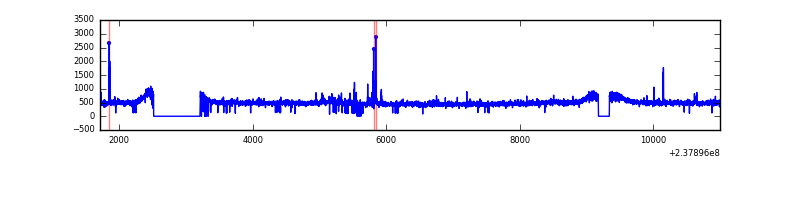 |
| C | 9286 | 8417 | 0 | 0 | 0.00% | 0.00% | 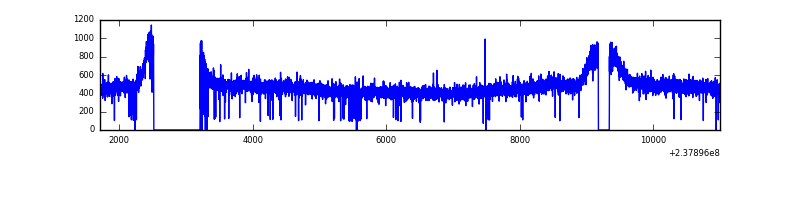 |
| D | 9286 | 8421 | 109 | 109 | 1.17% | 1.29% | 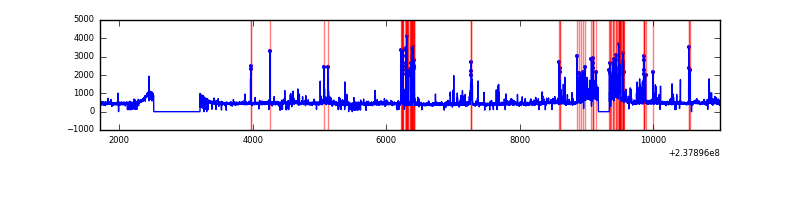 |
Top three noisy pixels from each quadrant. If the there are fewer than three noisy pixels in the level2.evt file, extra rows are filled as -1
| Pixel properties | Quadrant properties | ||||||
|---|---|---|---|---|---|---|---|
| Quadrant | DetID | PixID | Counts | Sigma | Mean | Median | Sigma |
| A | 1 | 162 | 230433 | 1060.77 | 1038 | 1012 | 216.3 |
| A | 1 | 178 | 93155 | 426.04 | 1038 | 1012 | 216.3 |
| A | 1 | 161 | 87401 | 399.44 | 1038 | 1012 | 216.3 |
| B | 0 | 219 | 36647 | 173.66 | 1041 | 1012 | 205.2 |
| B | 10 | 245 | 29999 | 141.26 | 1041 | 1012 | 205.2 |
| B | 0 | 214 | 24047 | 112.25 | 1041 | 1012 | 205.2 |
| C | 13 | 61 | 7699 | 28.06 | 1017 | 1018 | 238.1 |
| C | 8 | 222 | 3275 | 9.48 | 1017 | 1018 | 238.1 |
| C | 8 | 128 | 3056 | 8.56 | 1017 | 1018 | 238.1 |
| D | 1 | 52 | 333414 | 1379.05 | 998 | 971 | 241.1 |
| D | 12 | 233 | 271046 | 1120.33 | 998 | 971 | 241.1 |
| D | 10 | 253 | 169310 | 698.31 | 998 | 971 | 241.1 |
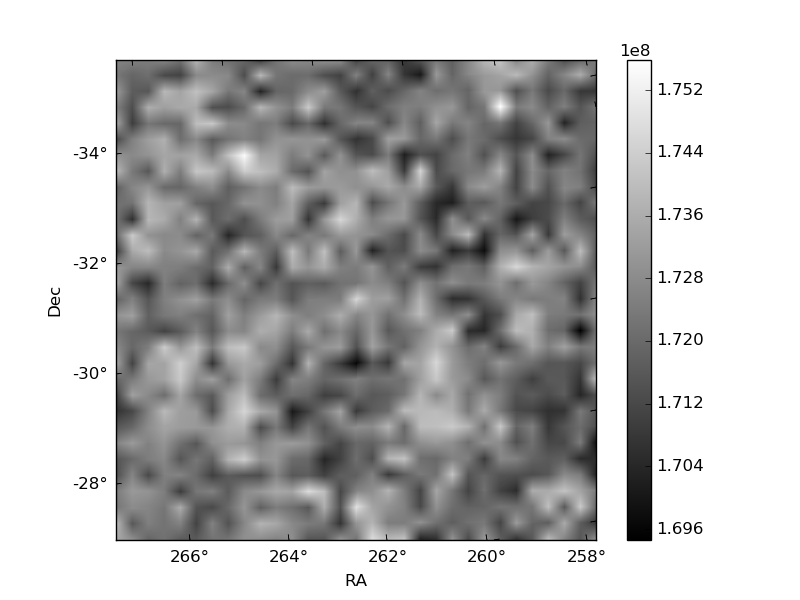
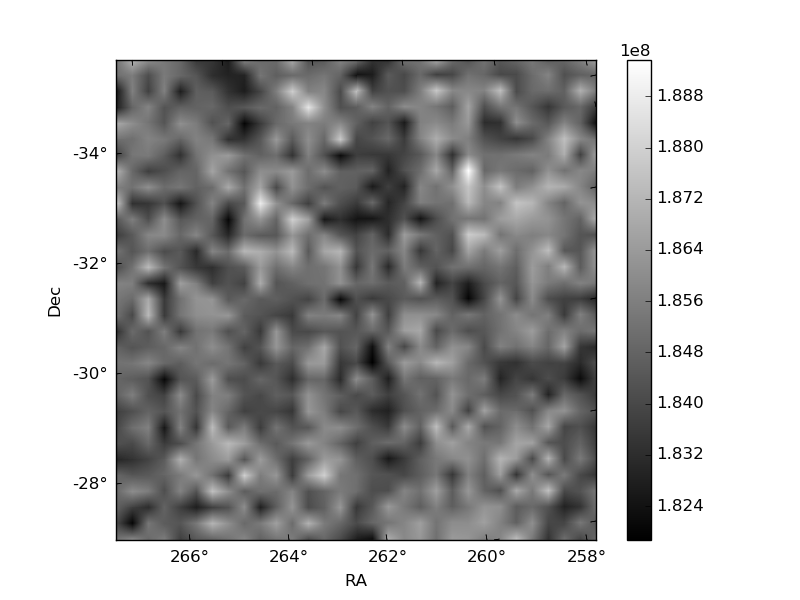
Histogram calculated using DETX and DETY for each event in the final _common_clean file
| Quadrant A | 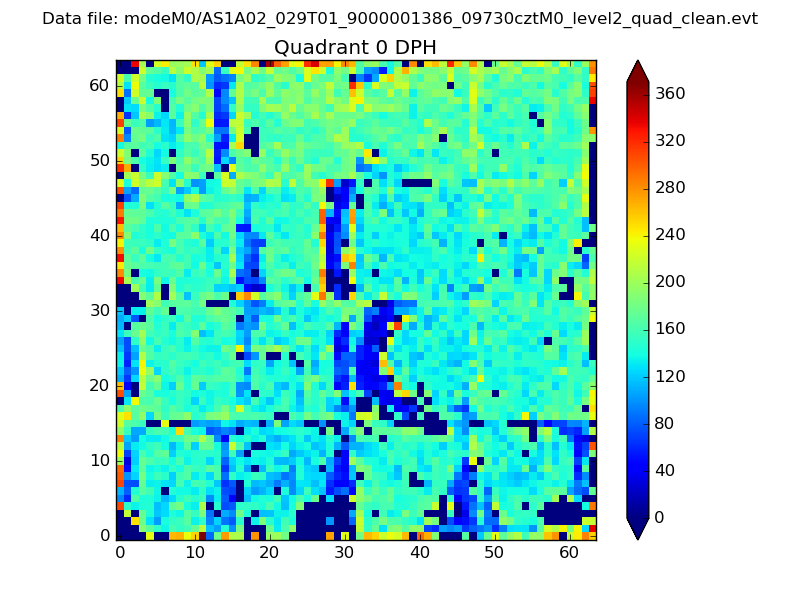 |
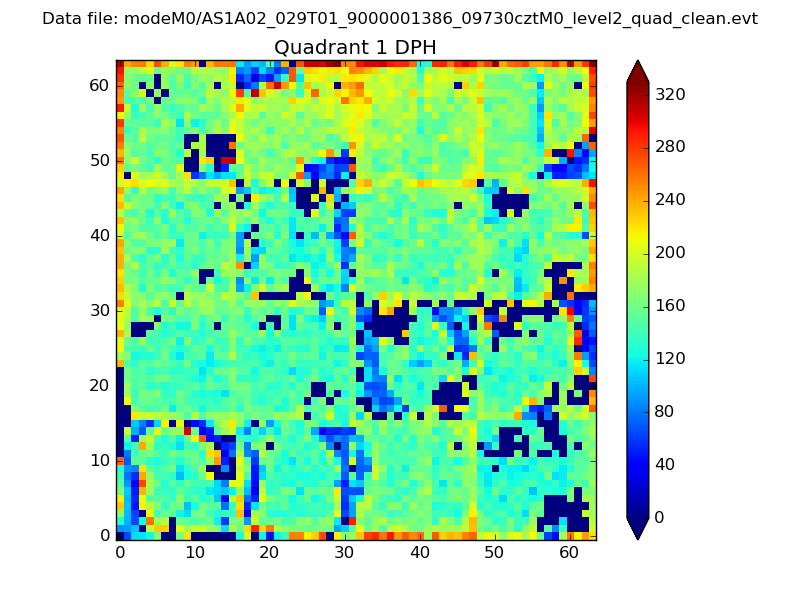 |
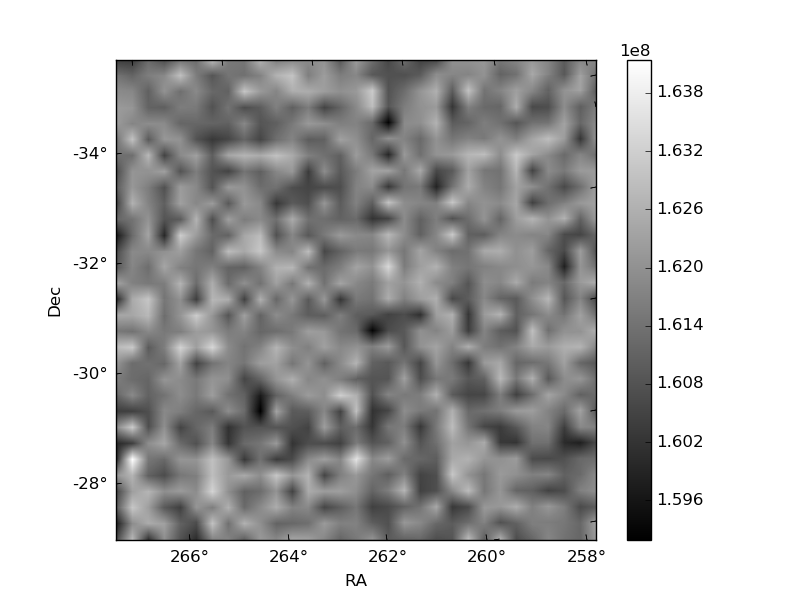
Quadrant B |
|---|---|---|---|
| Quadrant D | 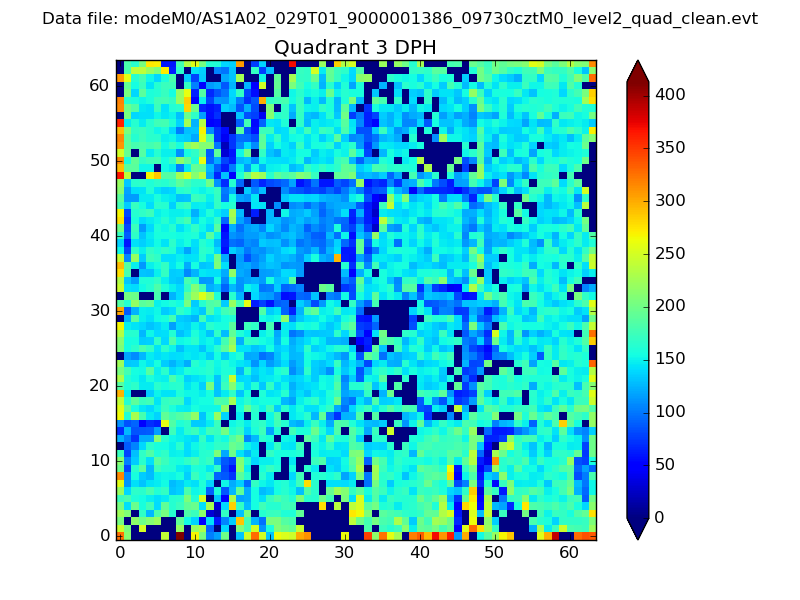 |
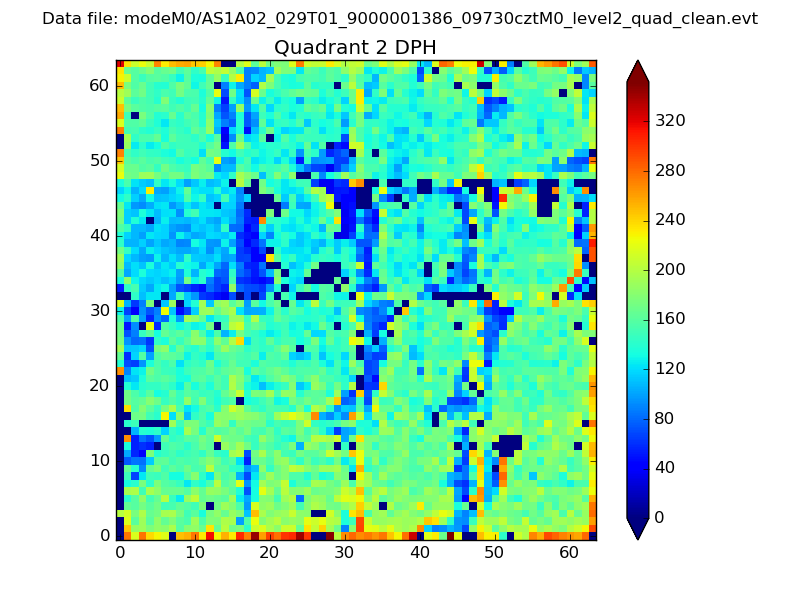 |
Quadrant C |
| Plot type | Count rate plots | Images |
|---|---|---|
| Comparison with Poisson distribution Blue bars denote a histogram of data divided into 1 sec bins. Red curve is a Poisson curve with rate = median count rate of data. |
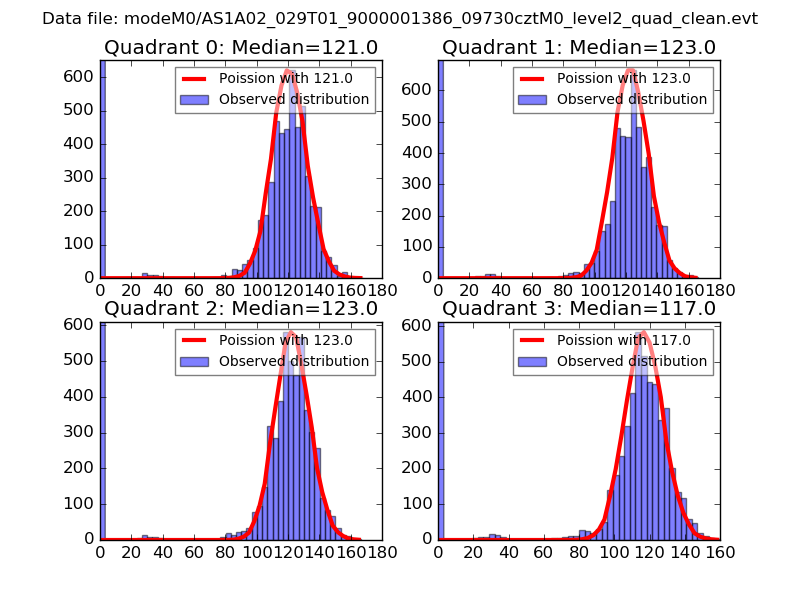 |
 |
| Quadrant-wise count rates Data is divided into 100 sec bins |
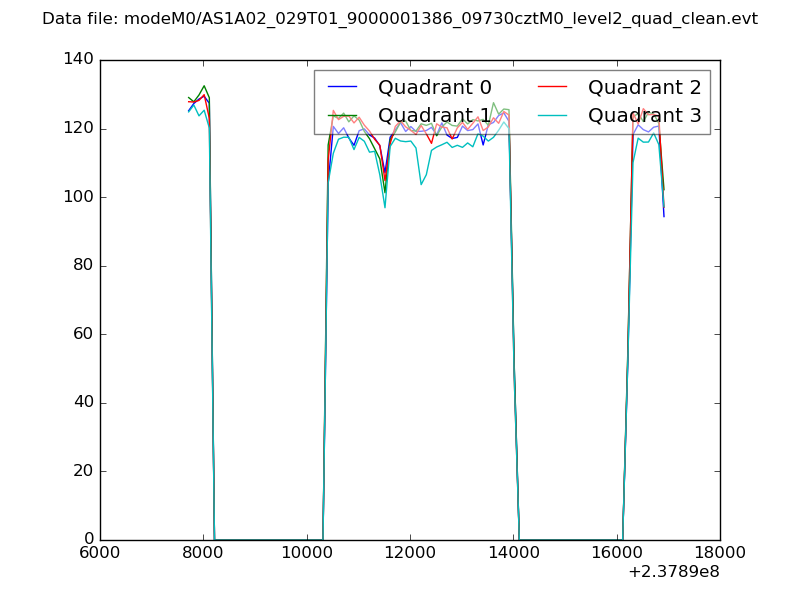 |
|
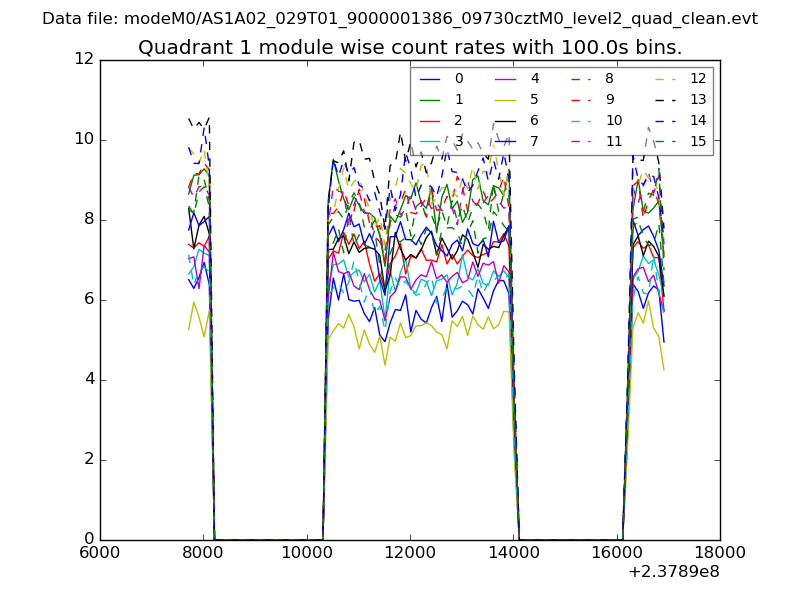
| Module-wise count rates for Quadrant A Data is divided into 100 sec bins |
 |
 |
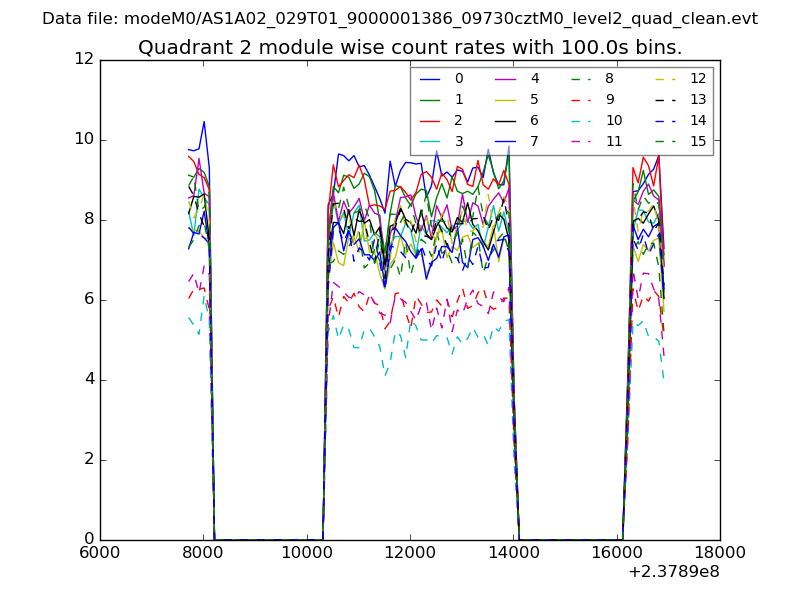
| Module-wise count rates for Quadrant B Data is divided into 100 sec bins |
 |
 |
| Module-wise count rates for Quadrant C Data is divided into 100 sec bins |
 |
 |
| Module-wise count rates for Quadrant D Data is divided into 100 sec bins |
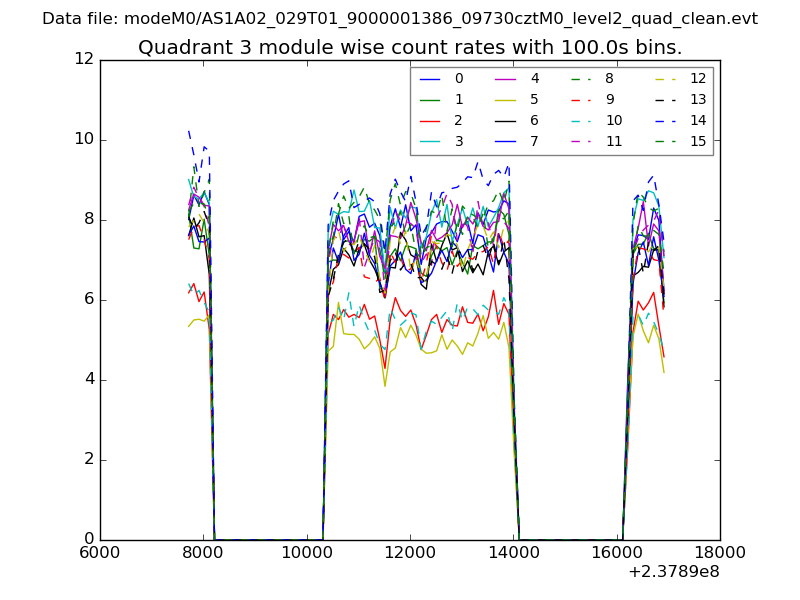 |
 |
| Parameter | Plot |
|---|---|
| CZT HV Monitor | 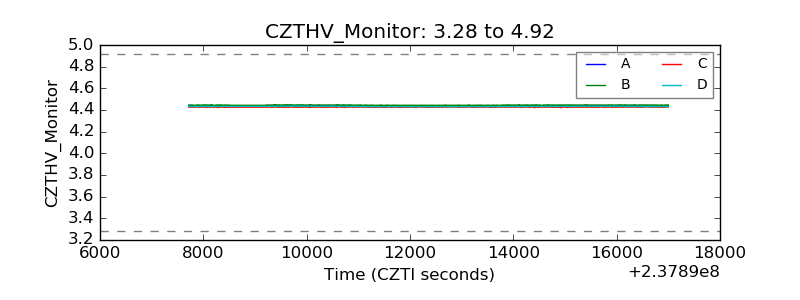 |
| D_VDD | 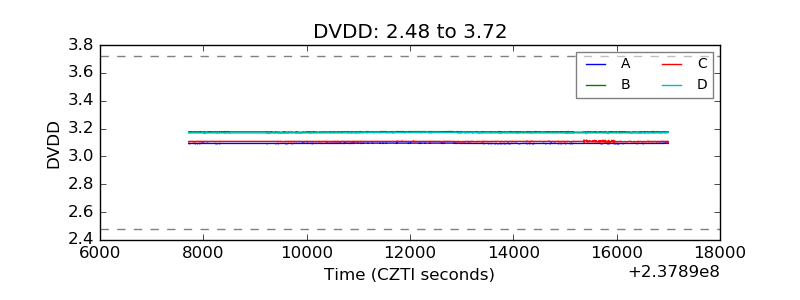 |
| Temperature 1 | 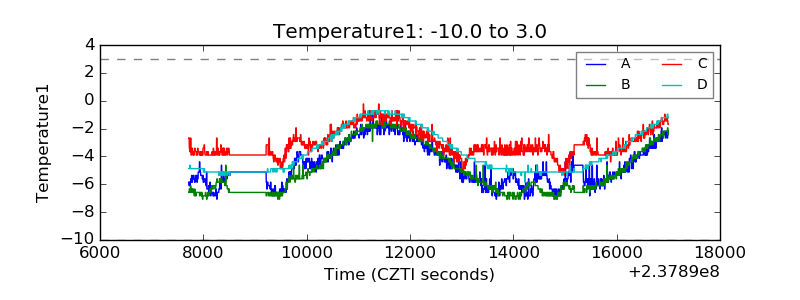 |
| Veto HV Monitor | 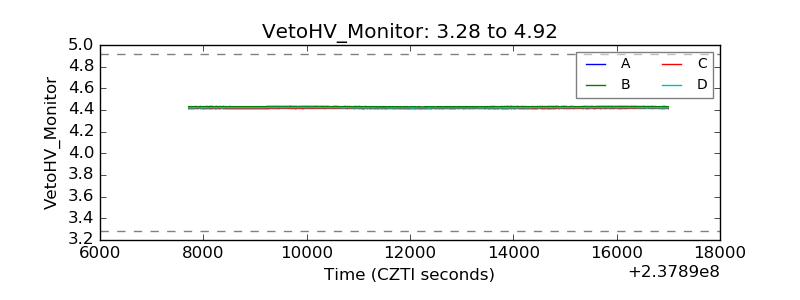 |
| Veto LLD | 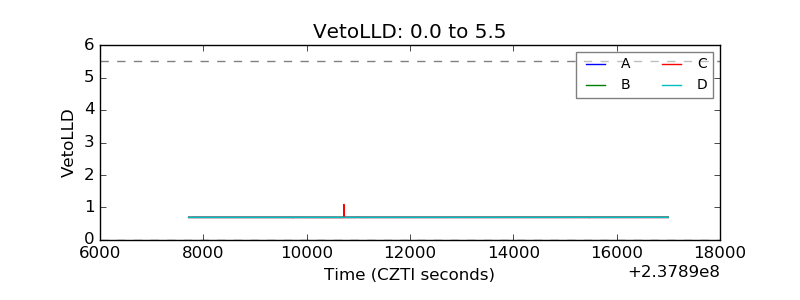 |
| Alpha Counter | 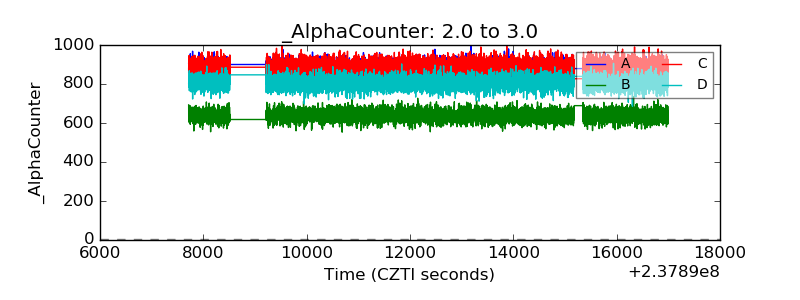 |
| _CPM_Rate | 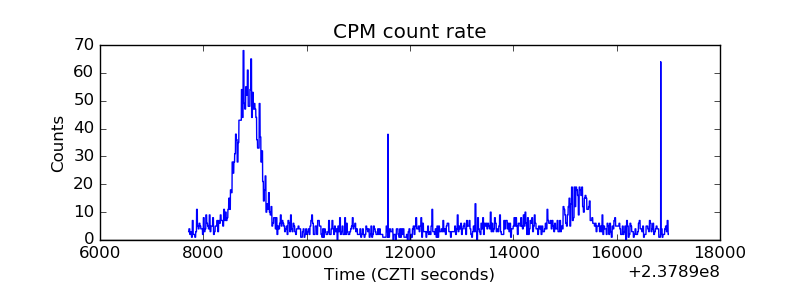 |
| CZT Counter | 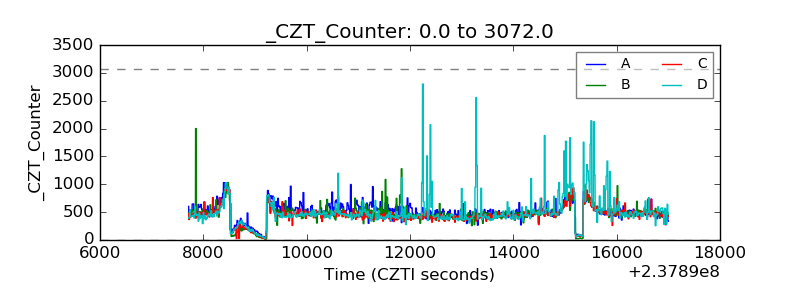 |
| +2.5 Volts monitor | 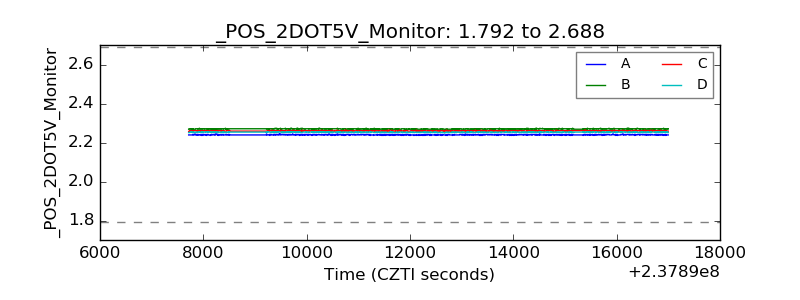 |
| +5 Volts monitor |  |
| _ROLL_ROT |  |
| _Roll_DEC | 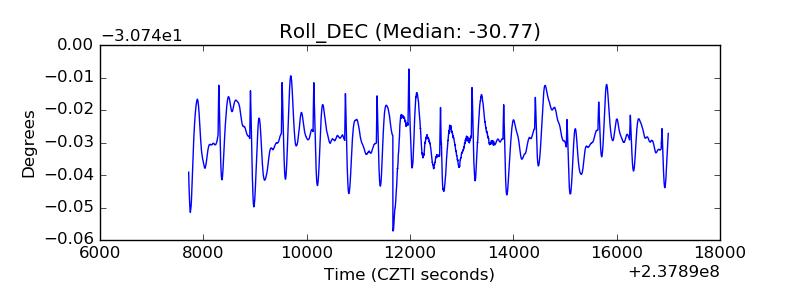 |
| _Roll_RA | 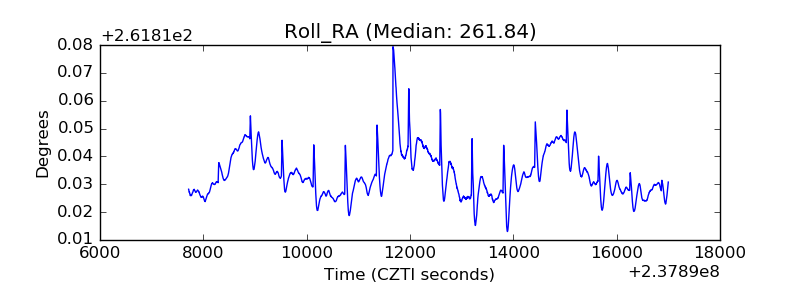 |
| Veto Counter |  |