| Param | Original file | Final file |
|---|---|---|
| Filename | modeM0/AS1A02_029T01_9000001386_09731cztM0_level2.evt | modeM0/AS1A02_029T01_9000001386_09731cztM0_level2_quad_clean.evt |
| Size (bytes) | 193,230,720 | 45,722,880 |
| Size | 184.3 MB | 43.6 MB |
| Events in quadrant A | 1,342,901 | 294,655 |
| Events in quadrant B | 1,447,350 | 297,899 |
| Events in quadrant C | 1,295,829 | 295,760 |
| Events in quadrant D | 1,559,219 | 281,765 |
| Mode M0 | |||
|---|---|---|---|
| Quadrant | BADHDUFLAG | Total packets | Discarded packets |
| A | 0 | 6077 | 32 |
| B | 0 | 6249 | 42 |
| C | 0 | 6063 | 43 |
| D | 0 | 6679 | 60 |
| Mode SS | |||
|---|---|---|---|
| Quadrant | BADHDUFLAG | Total packets | Discarded packets |
| A | 0 | 60 | 0 |
| B | 0 | 60 | 0 |
| C | 0 | 60 | 2 |
| D | 0 | 60 | 0 |
| Quadrant | Total seconds | Saturated seconds | Saturation percentage |
|---|---|---|---|
| A | 3013 | 4 | 0.132758% |
| B | 3008 | 5 | 0.166223% |
| C | 3007 | 1 | 0.033256% |
| D | 3008 | 26 | 0.864362% |
Noise dominated data is calculated using 1-second bins in cleaned event files. If a bin has >2000 counts, and if more than 50% of those come from <1% of pixels, then it is considered to be noise-dominated and hence unusable.
| Quadrant | # 1 sec bins | Bins with >0 counts | Bins with >2000 counts | High rate bins dominated by noise | Noise dominated (total time) | Noise dominated (detector-on time) | Marked lightcurve |
|---|---|---|---|---|---|---|---|
| A | 3029 | 3029 | 0 | 0 | 0.00% | 0.00% | 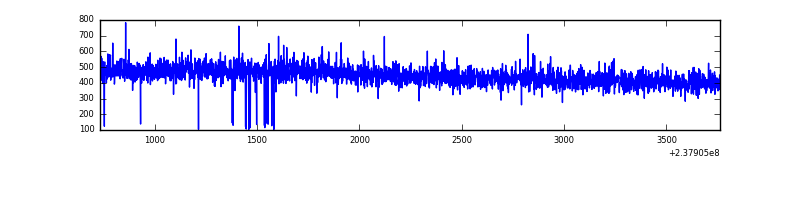 |
| B | 3029 | 3028 | 4 | 4 | 0.13% | 0.13% | 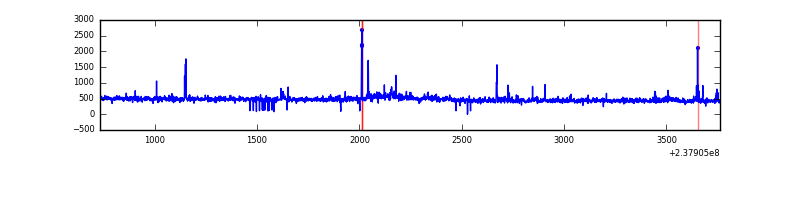 |
| C | 3029 | 3027 | 0 | 0 | 0.00% | 0.00% | 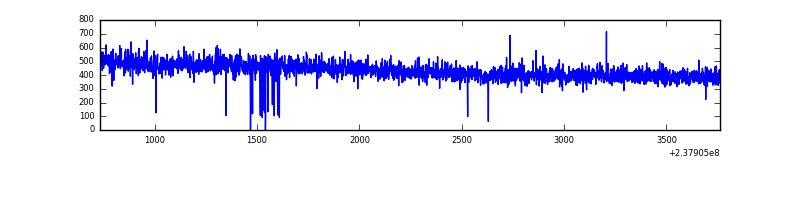 |
| D | 3029 | 3027 | 16 | 16 | 0.53% | 0.53% | 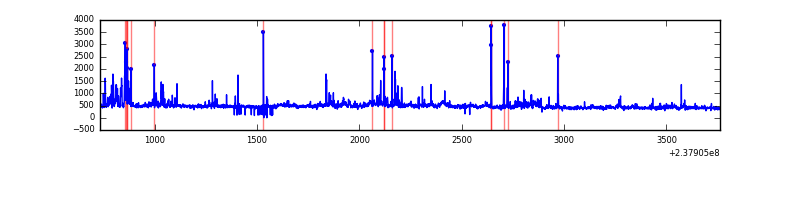 |
Top three noisy pixels from each quadrant. If the there are fewer than three noisy pixels in the level2.evt file, extra rows are filled as -1
| Pixel properties | Quadrant properties | ||||||
|---|---|---|---|---|---|---|---|
| Quadrant | DetID | PixID | Counts | Sigma | Mean | Median | Sigma |
| A | 0 | 226 | 3279 | 39.97 | 347 | 339 | 73.6 |
| A | 12 | 194 | 2992 | 36.07 | 347 | 339 | 73.6 |
| A | 13 | 248 | 2836 | 33.94 | 347 | 339 | 73.6 |
| B | 0 | 219 | 46969 | 681.42 | 344 | 336 | 68.4 |
| B | 10 | 245 | 35519 | 514.11 | 344 | 336 | 68.4 |
| B | 0 | 214 | 9795 | 138.22 | 344 | 336 | 68.4 |
| C | 13 | 61 | 2447 | 26.78 | 331 | 333 | 78.9 |
| C | 8 | 222 | 1367 | 13.1 | 331 | 333 | 78.9 |
| C | 9 | 54 | 1280 | 12.0 | 331 | 333 | 78.9 |
| D | 1 | 52 | 126147 | 1523.68 | 333 | 324 | 82.6 |
| D | 12 | 233 | 103120 | 1244.83 | 333 | 324 | 82.6 |
| D | 7 | 71 | 29775 | 356.64 | 333 | 324 | 82.6 |
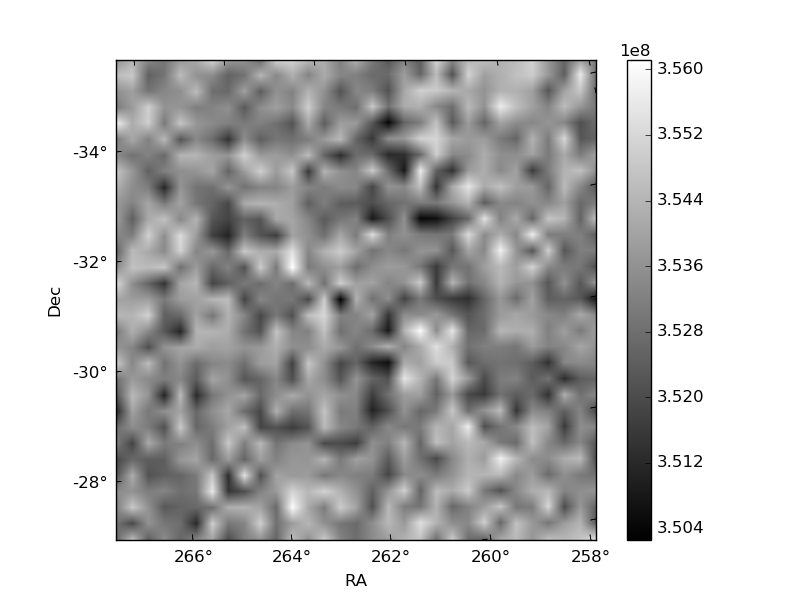
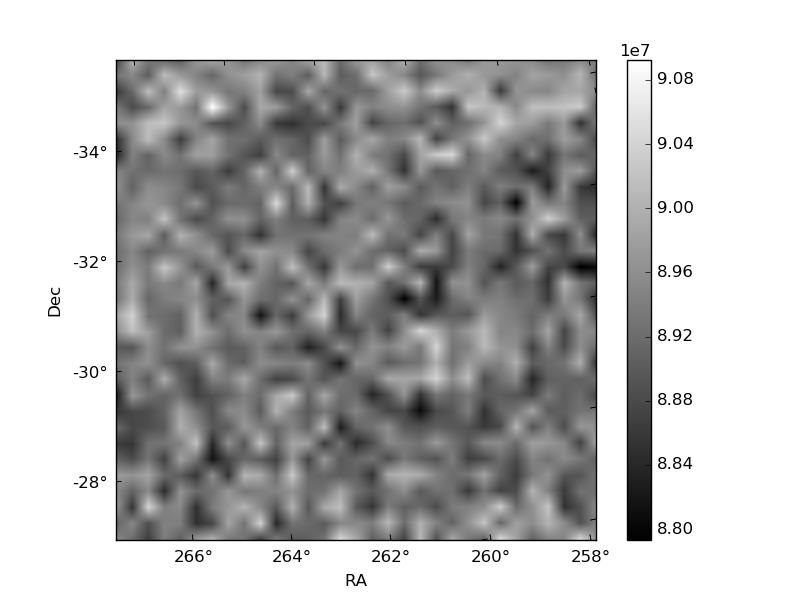
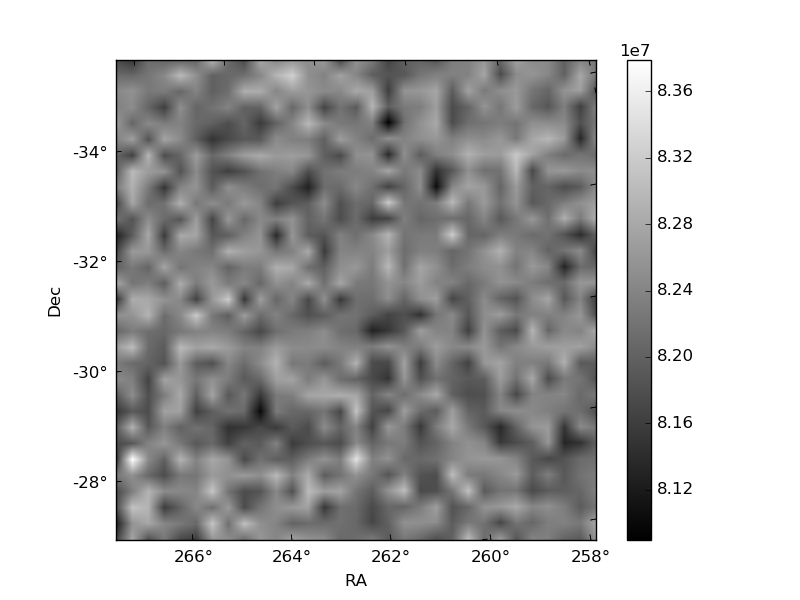
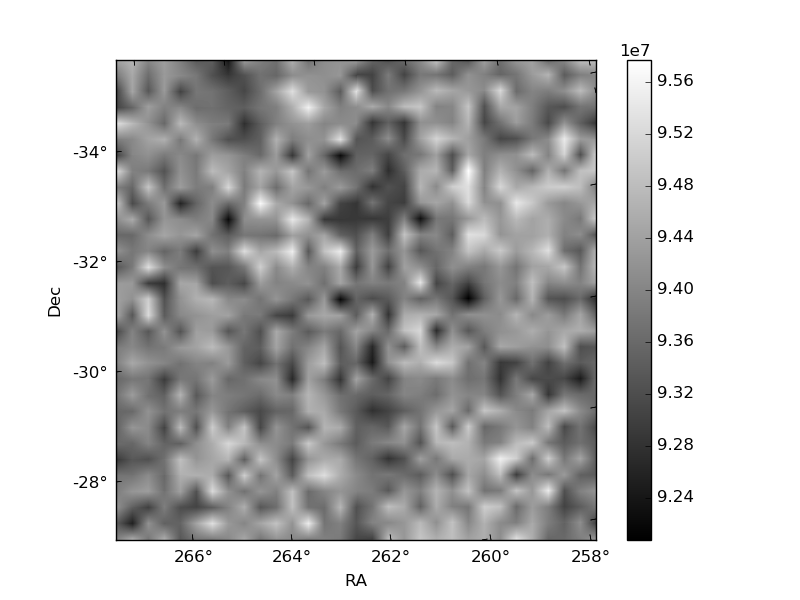
Histogram calculated using DETX and DETY for each event in the final _common_clean file
| Quadrant A | 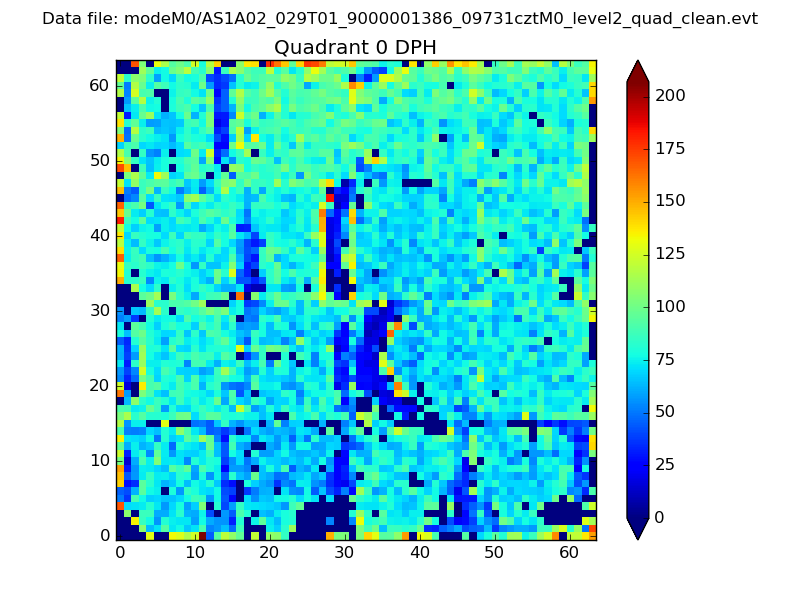 |
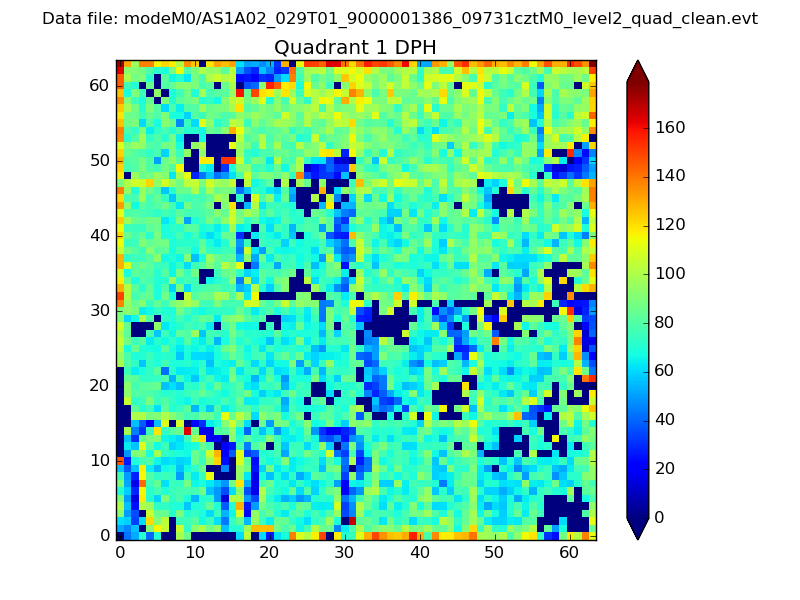 |
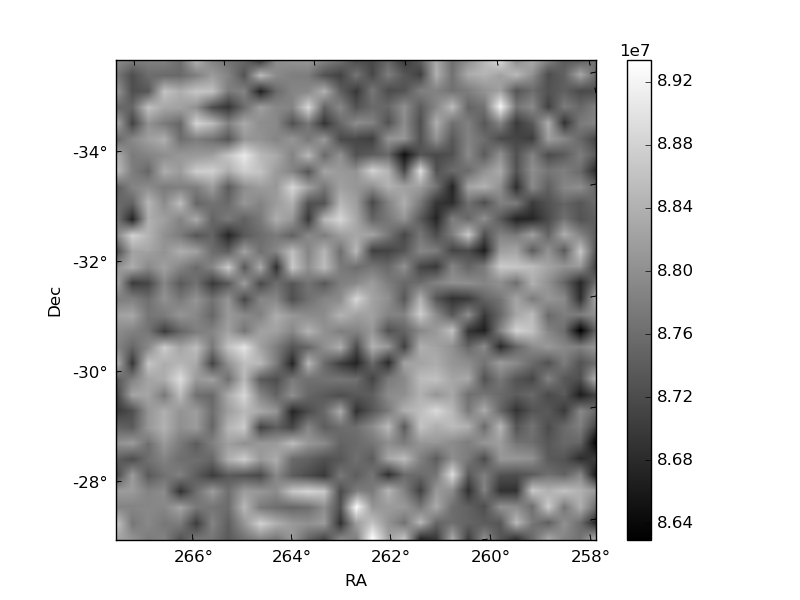
Quadrant B |
|---|---|---|---|
| Quadrant D | 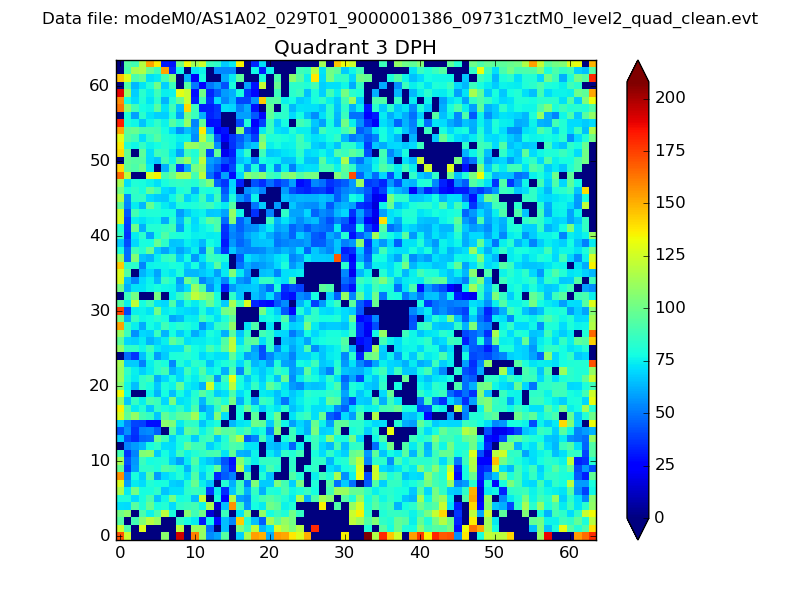 |
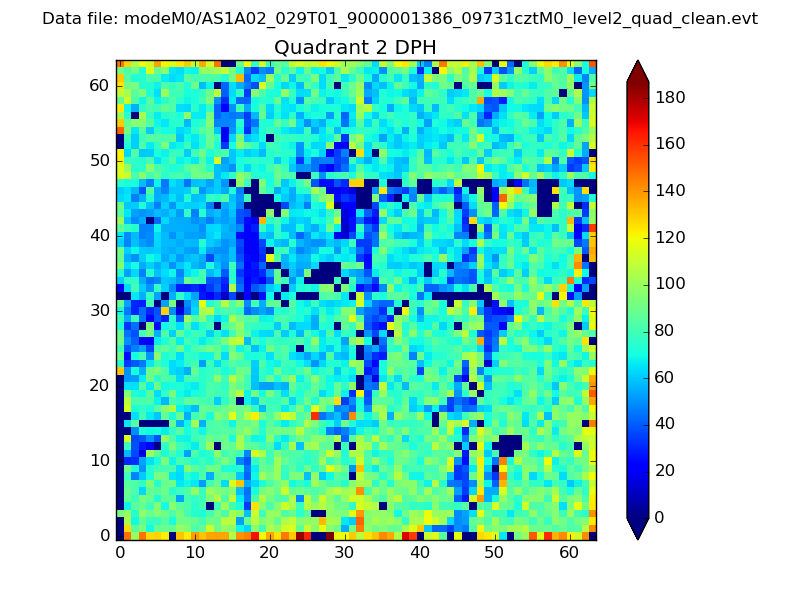 |
Quadrant C |
| Plot type | Count rate plots | Images |
|---|---|---|
| Comparison with Poisson distribution Blue bars denote a histogram of data divided into 1 sec bins. Red curve is a Poisson curve with rate = median count rate of data. |
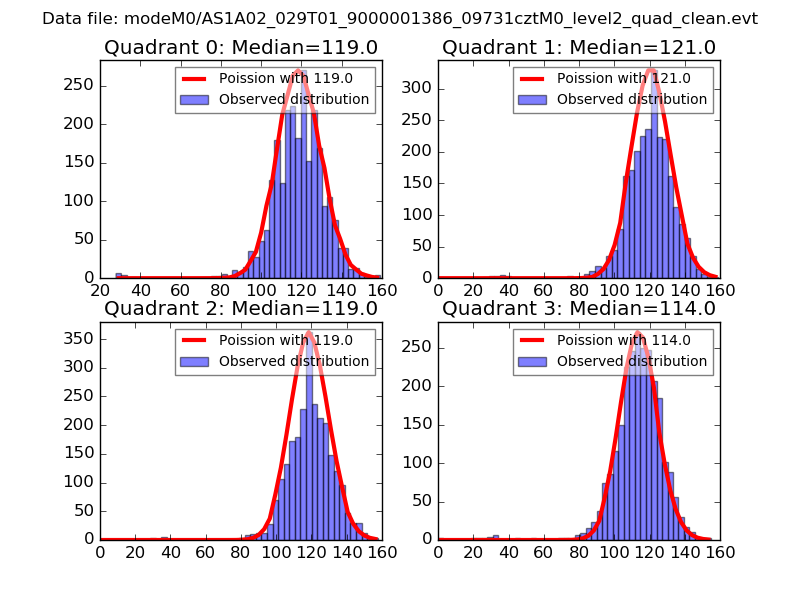 |
 |
| Quadrant-wise count rates Data is divided into 100 sec bins |
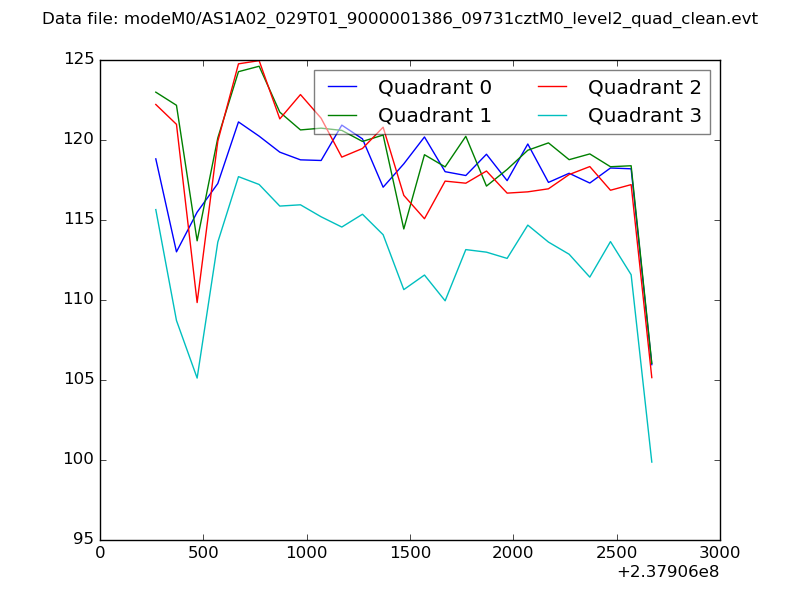 |
|
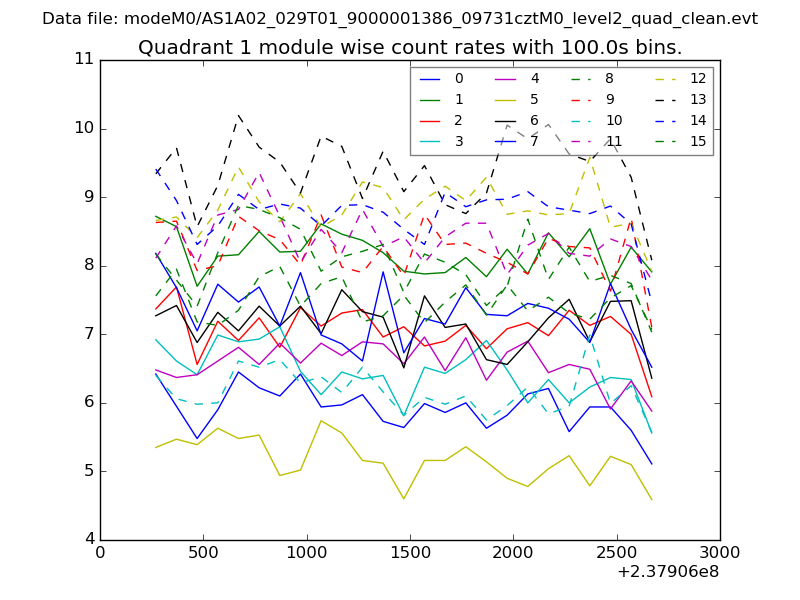
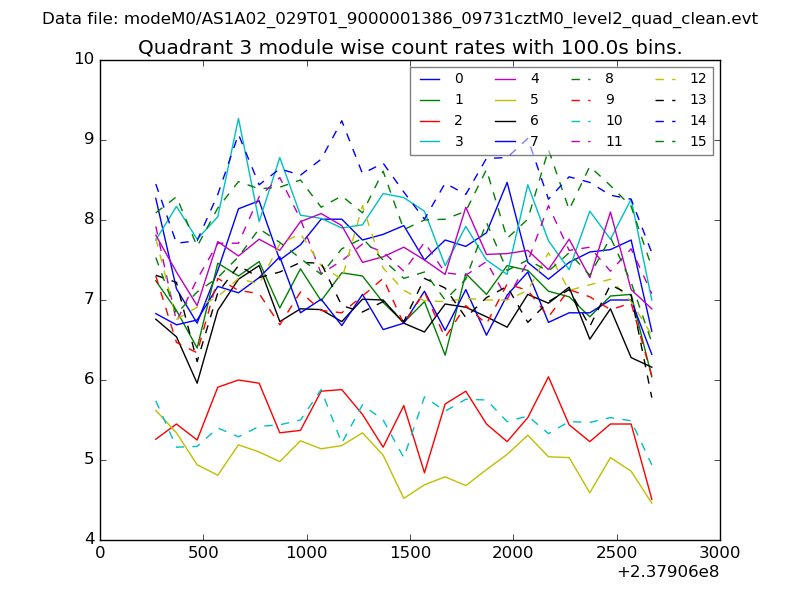
| Module-wise count rates for Quadrant A Data is divided into 100 sec bins |
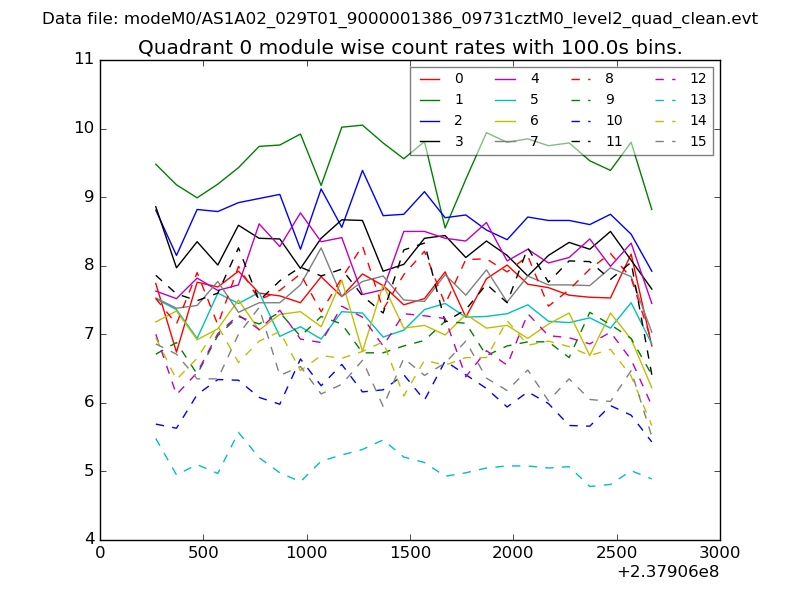 |
 |
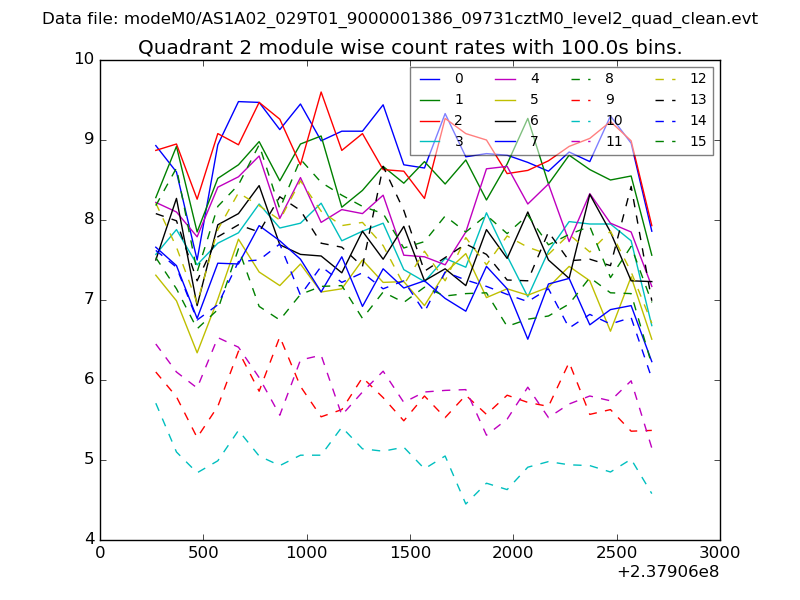
| Module-wise count rates for Quadrant B Data is divided into 100 sec bins |
 |
 |
| Module-wise count rates for Quadrant C Data is divided into 100 sec bins |
 |
 |
| Module-wise count rates for Quadrant D Data is divided into 100 sec bins |
 |
 |
| Parameter | Plot |
|---|---|
| CZT HV Monitor | 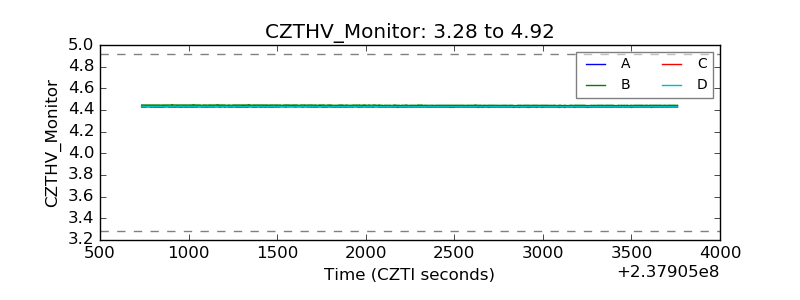 |
| D_VDD | 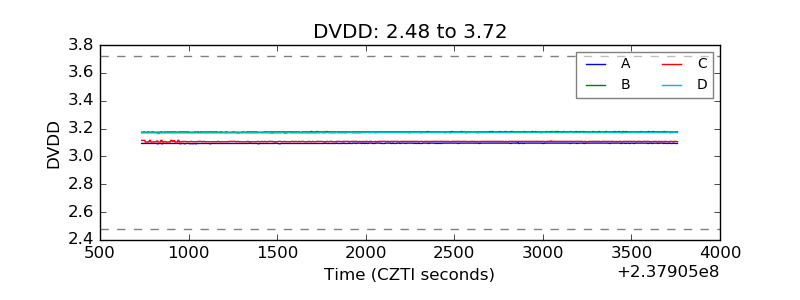 |
| Temperature 1 | 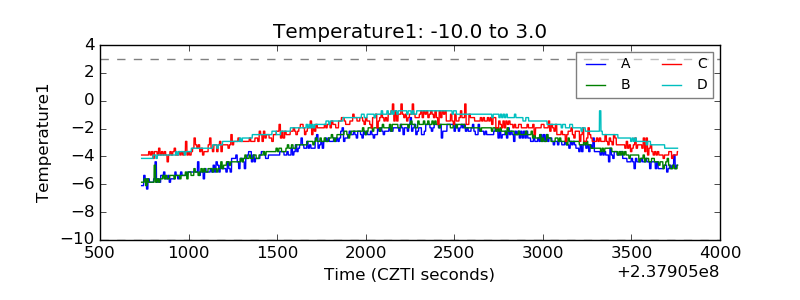 |
| Veto HV Monitor | 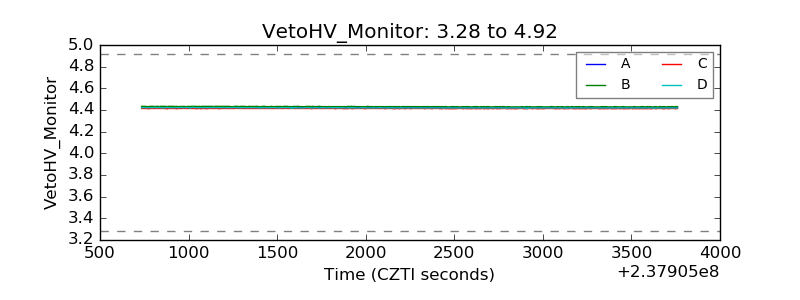 |
| Veto LLD | 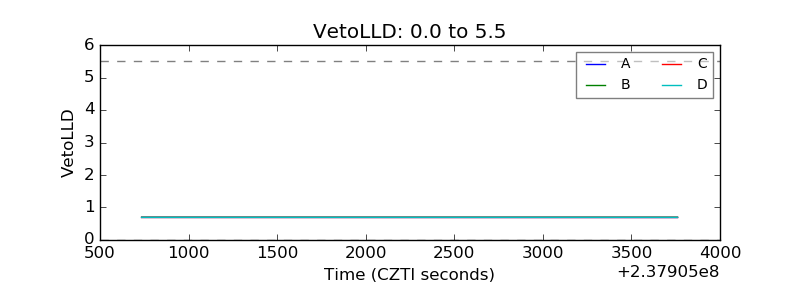 |
| Alpha Counter | 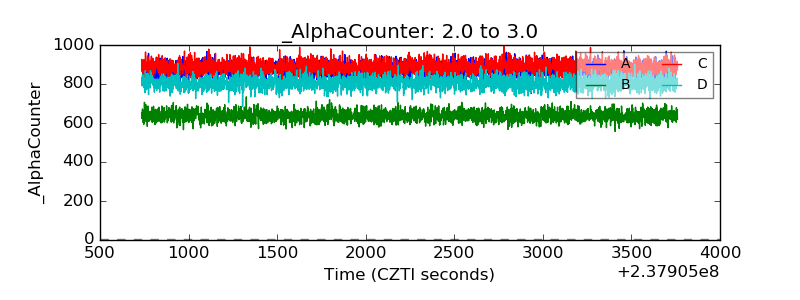 |
| _CPM_Rate | 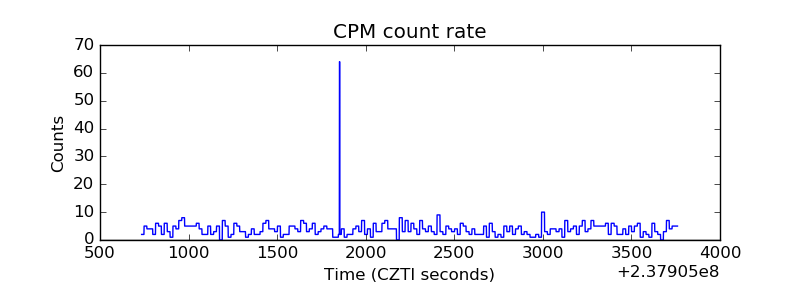 |
| CZT Counter | 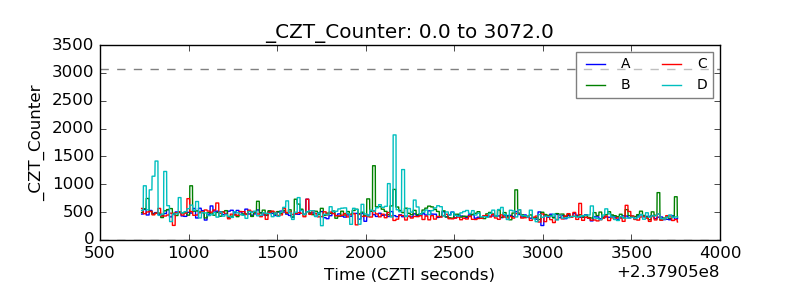 |
| +2.5 Volts monitor |  |
| +5 Volts monitor |  |
| _ROLL_ROT | 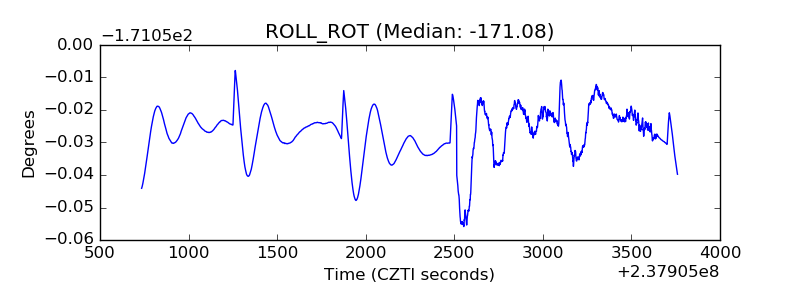 |
| _Roll_DEC | 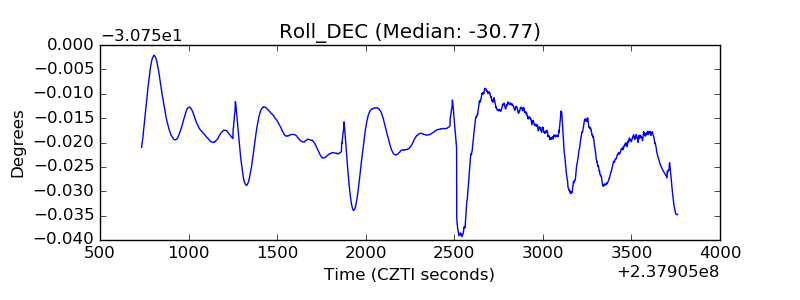 |
| _Roll_RA | 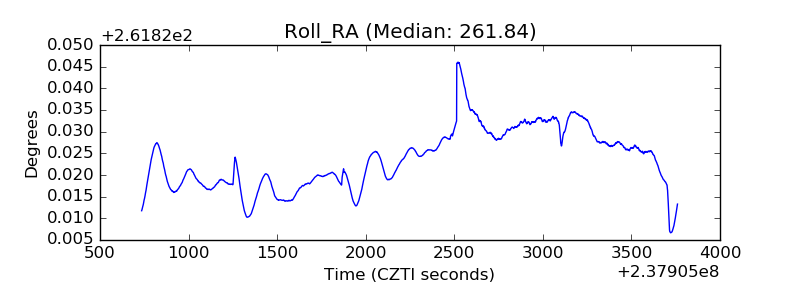 |
| Veto Counter | 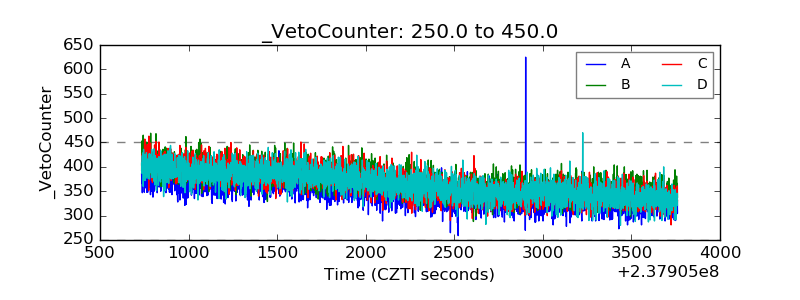 |