| Param | Original file | Final file |
|---|---|---|
| Filename | modeM0/AS1A03_119T01_9000001388cztM0_level2.fits | modeM0/AS1A03_119T01_9000001388cztM0_level2_quad_clean.evt |
| Size (bytes) | 455,783,040 | 379,434,240 |
| Size | 434.7 MB | 361.9 MB |
| Events in quadrant A | 2,762,486 | 2,138,089 |
| Events in quadrant B | 2,688,368 | 2,169,062 |
| Events in quadrant C | 2,692,372 | 2,030,560 |
| Events in quadrant D | 2,318,140 | 1,811,391 |
| Mode M9 | |||
|---|---|---|---|
| Quadrant | BADHDUFLAG | Total packets | Discarded packets |
| A | 0 | 73 | 0 |
| B | 0 | 73 | 0 |
| C | 0 | 72 | 0 |
| D | 0 | 72 | 0 |
| Mode M0 | |||
|---|---|---|---|
| Quadrant | BADHDUFLAG | Total packets | Discarded packets |
| A | 0 | 99992 | 0 |
| B | 0 | 99786 | 0 |
| C | 0 | 99802 | 0 |
| D | 0 | 115988 | 0 |
| Mode SS | |||
|---|---|---|---|
| Quadrant | BADHDUFLAG | Total packets | Discarded packets |
| A | 0 | 990 | 0 |
| B | 0 | 998 | 0 |
| C | 0 | 992 | 0 |
| D | 0 | 988 | 0 |
| Quadrant | Total seconds | Saturated seconds | Saturation percentage |
|---|---|---|---|
| A | 48695 | 468 | 0.961084% |
| B | 48686 | 592 | 1.215955% |
| C | 48700 | 425 | 0.872690% |
| D | 48621 | 2190 | 4.504227% |
Noise dominated data is calculated using 1-second bins in cleaned event files. If a bin has >2000 counts, and if more than 50% of those come from <1% of pixels, then it is considered to be noise-dominated and hence unusable.
| Quadrant | # 1 sec bins | Bins with >0 counts | Bins with >2000 counts | High rate bins dominated by noise | Noise dominated (total time) | Noise dominated (detector-on time) | Marked lightcurve |
|---|---|---|---|---|---|---|---|
| A | 56406 | 49160 | 0 | 0 | 0.00% | 0.00% |  |
| B | 56406 | 49155 | 0 | 0 | 0.00% | 0.00% |  |
| C | 56406 | 49155 | 0 | 0 | 0.00% | 0.00% |  |
| D | 56406 | 49071 | 0 | 0 | 0.00% | 0.00% |  |
Top three noisy pixels from each quadrant. If the there are fewer than three noisy pixels in the level2.evt file, extra rows are filled as -1
| Pixel properties | Quadrant properties | ||||||
|---|---|---|---|---|---|---|---|
| Quadrant | DetID | PixID | Counts | Sigma | Mean | Median | Sigma |
| A | 14 | 188 | 2803 | 11.63 | 717 | 668 | 183.5 |
| A | 0 | 29 | 2567 | 10.35 | 717 | 668 | 183.5 |
| A | 14 | 204 | 2389 | 9.38 | 717 | 668 | 183.5 |
| B | 2 | 9 | 2202 | 10.71 | 705 | 669 | 143.2 |
| B | 5 | 225 | 1781 | 7.77 | 705 | 669 | 143.2 |
| B | 3 | 17 | 1778 | 7.75 | 705 | 669 | 143.2 |
| C | 1 | 80 | 2006 | 7.13 | 711 | 660 | 188.8 |
| C | 1 | 81 | 1918 | 6.66 | 711 | 660 | 188.8 |
| C | 12 | 241 | 1884 | 6.48 | 711 | 660 | 188.8 |
| D | 6 | 231 | 1662 | 5.96 | 659 | 597 | 178.7 |
| D | 1 | 19 | 1648 | 5.88 | 659 | 597 | 178.7 |
| D | 7 | 5 | 1634 | 5.8 | 659 | 597 | 178.7 |
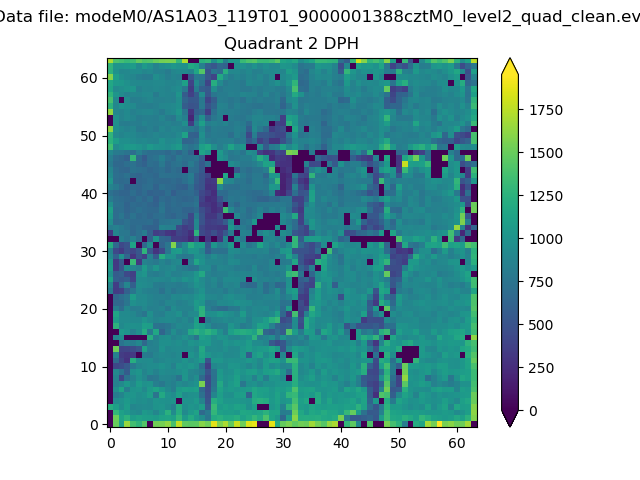
Histogram calculated using DETX and DETY for each event in the final _common_clean file
| Quadrant A |  |
 |
Quadrant B |
|---|---|---|---|
| Quadrant D | 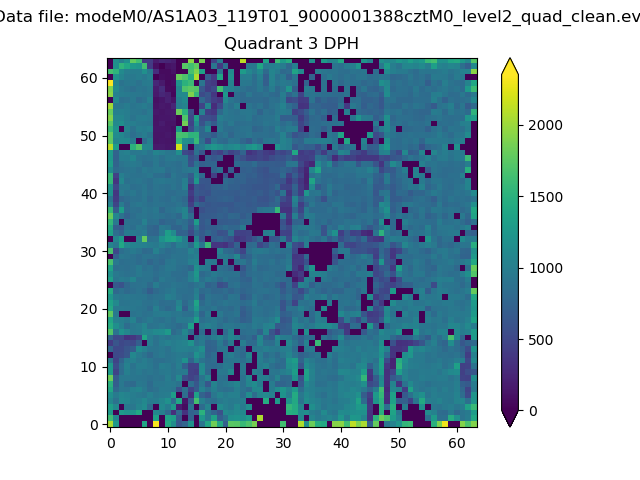 |
 |
Quadrant C |
| Plot type | Count rate plots | Images |
|---|---|---|
| Comparison with Poisson distribution Blue bars denote a histogram of data divided into 1 sec bins. Red curve is a Poisson curve with rate = median count rate of data. |
 |
 |
| Quadrant-wise count rates Data is divided into 100 sec bins |
 |
|
| Module-wise count rates for Quadrant A Data is divided into 100 sec bins |
 |
 |
| Module-wise count rates for Quadrant B Data is divided into 100 sec bins |
 |
 |
| Module-wise count rates for Quadrant C Data is divided into 100 sec bins |
 |
 |
| Module-wise count rates for Quadrant D Data is divided into 100 sec bins |
 |
 |
| Parameter | Plot |
|---|---|
| CZT HV Monitor |  |
| D_VDD |  |
| Temperature 1 | 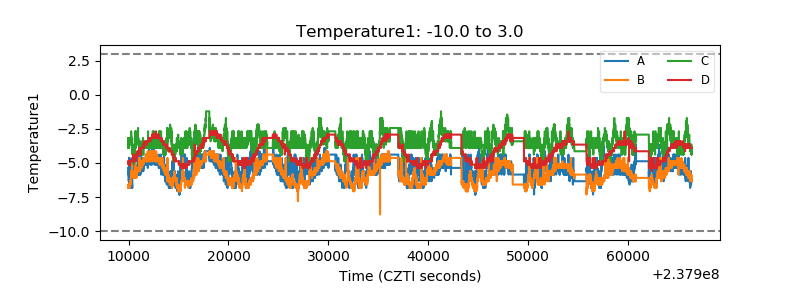 |
| Veto HV Monitor |  |
| Veto LLD |  |
| Alpha Counter |  |
| _CPM_Rate |  |
| CZT Counter |  |
| +2.5 Volts monitor | 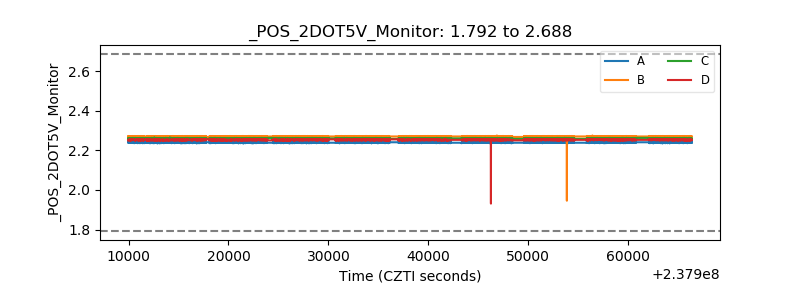 |
| +5 Volts monitor |  |
| _ROLL_ROT |  |
| _Roll_DEC |  |
| _Roll_RA |  |
| Veto Counter |  |