| Param | Original file | Final file |
|---|---|---|
| Filename | modeM0/AS1A03_119T01_9000001388_09731cztM0_level2.evt | modeM0/AS1A03_119T01_9000001388_09731cztM0_level2_quad_clean.evt |
| Size (bytes) | 217,494,720 | 23,143,680 |
| Size | 207.4 MB | 22.1 MB |
| Events in quadrant A | 1,557,343 | 120,615 |
| Events in quadrant B | 1,569,272 | 123,590 |
| Events in quadrant C | 1,525,190 | 118,577 |
| Events in quadrant D | 1,720,782 | 115,114 |
| Mode M9 | |||
|---|---|---|---|
| Quadrant | BADHDUFLAG | Total packets | Discarded packets |
| A | 0 | 2 | 0 |
| B | 0 | 2 | 0 |
| C | 0 | 2 | 0 |
| D | 0 | 2 | 0 |
| Mode M0 | |||
|---|---|---|---|
| Quadrant | BADHDUFLAG | Total packets | Discarded packets |
| A | 0 | 6621 | 6 |
| B | 0 | 6618 | 5 |
| C | 0 | 6596 | 5 |
| D | 0 | 7174 | 7 |
| Mode SS | |||
|---|---|---|---|
| Quadrant | BADHDUFLAG | Total packets | Discarded packets |
| A | 0 | 64 | 0 |
| B | 0 | 64 | 0 |
| C | 0 | 64 | 0 |
| D | 0 | 64 | 0 |
| Quadrant | Total seconds | Saturated seconds | Saturation percentage |
|---|---|---|---|
| A | 3121 | 126 | 4.037168% |
| B | 3121 | 171 | 5.479013% |
| C | 3121 | 136 | 4.357578% |
| D | 3121 | 138 | 4.421660% |
Noise dominated data is calculated using 1-second bins in cleaned event files. If a bin has >2000 counts, and if more than 50% of those come from <1% of pixels, then it is considered to be noise-dominated and hence unusable.
| Quadrant | # 1 sec bins | Bins with >0 counts | Bins with >2000 counts | High rate bins dominated by noise | Noise dominated (total time) | Noise dominated (detector-on time) | Marked lightcurve |
|---|---|---|---|---|---|---|---|
| A | 3248 | 3124 | 0 | 0 | 0.00% | 0.00% | 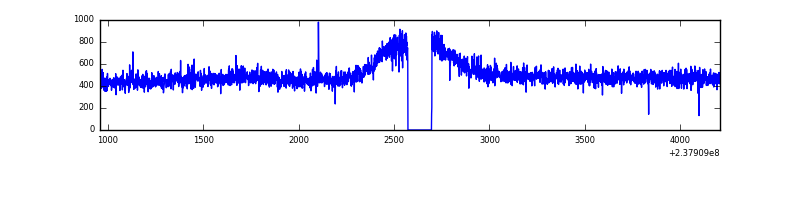 |
| B | 3248 | 3124 | 0 | 0 | 0.00% | 0.00% | 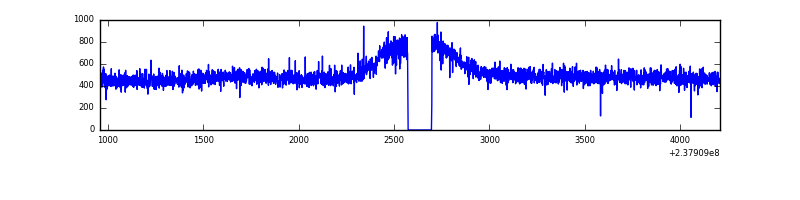 |
| C | 3248 | 3124 | 0 | 0 | 0.00% | 0.00% | 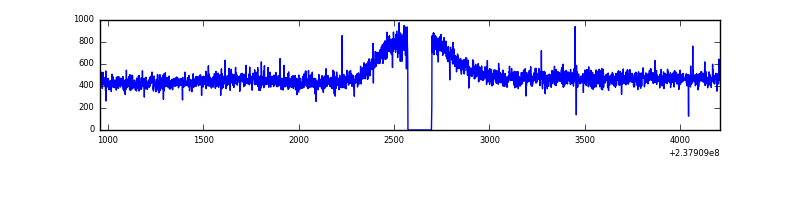 |
| D | 3248 | 3124 | 6 | 6 | 0.18% | 0.19% | 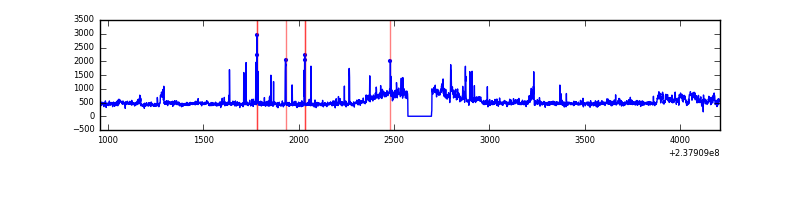 |
Top three noisy pixels from each quadrant. If the there are fewer than three noisy pixels in the level2.evt file, extra rows are filled as -1
| Pixel properties | Quadrant properties | ||||||
|---|---|---|---|---|---|---|---|
| Quadrant | DetID | PixID | Counts | Sigma | Mean | Median | Sigma |
| A | 0 | 226 | 3597 | 38.03 | 404 | 395 | 84.2 |
| A | 12 | 194 | 3178 | 33.05 | 404 | 395 | 84.2 |
| A | 13 | 251 | 2482 | 24.78 | 404 | 395 | 84.2 |
| B | 12 | 111 | 9461 | 113.45 | 403 | 392 | 79.9 |
| B | 11 | 111 | 7704 | 91.47 | 403 | 392 | 79.9 |
| B | 14 | 111 | 5901 | 68.92 | 403 | 392 | 79.9 |
| C | 8 | 128 | 4923 | 49.62 | 387 | 387 | 91.4 |
| C | 10 | 22 | 4156 | 41.23 | 387 | 387 | 91.4 |
| C | 13 | 61 | 2912 | 27.62 | 387 | 387 | 91.4 |
| D | 1 | 52 | 253154 | 2677.63 | 386 | 376 | 94.4 |
| D | 2 | 234 | 13200 | 135.84 | 386 | 376 | 94.4 |
| D | 14 | 226 | 3777 | 36.03 | 386 | 376 | 94.4 |
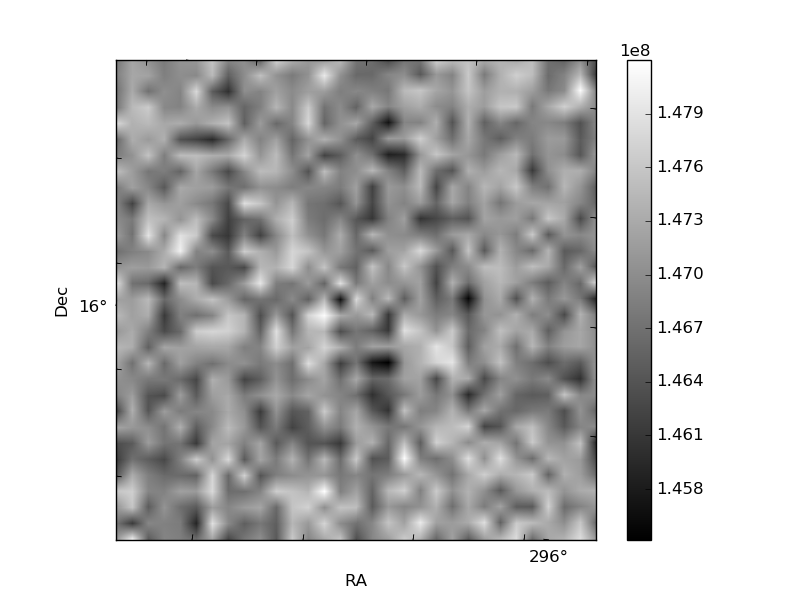
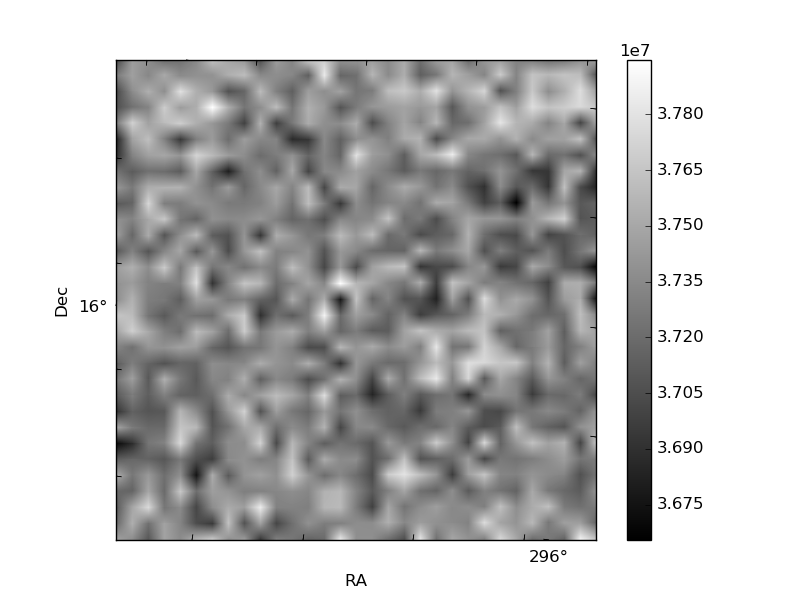
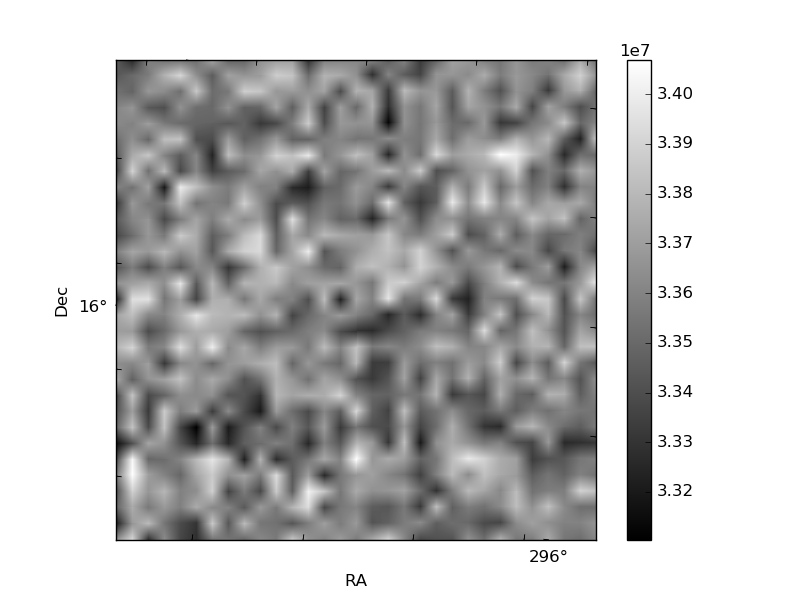
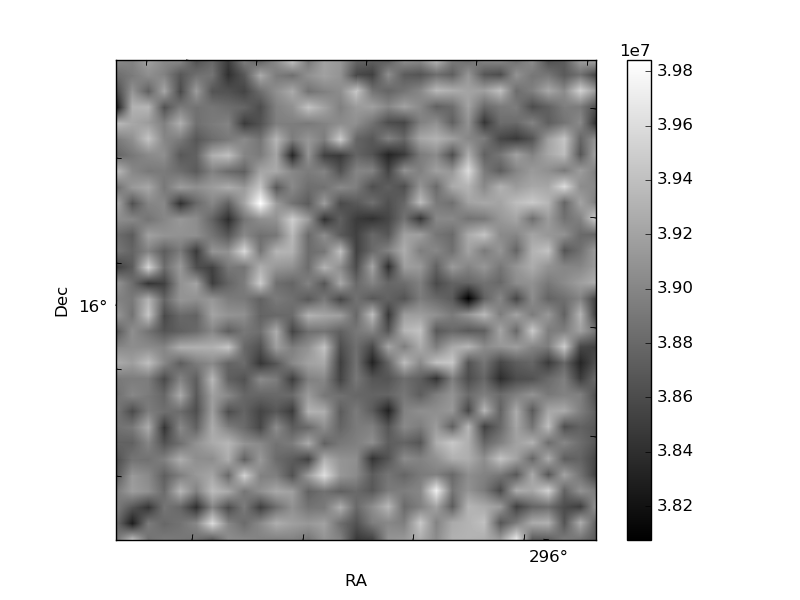
Histogram calculated using DETX and DETY for each event in the final _common_clean file
| Quadrant A | 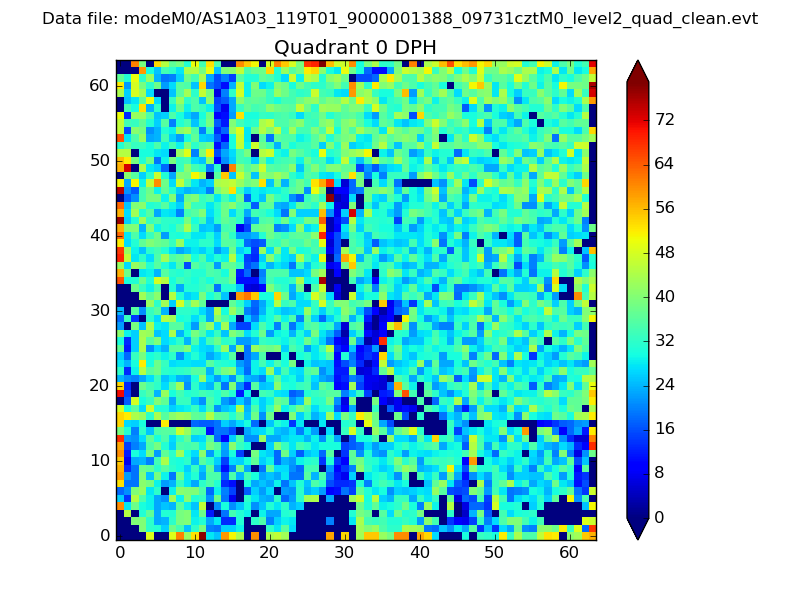 |
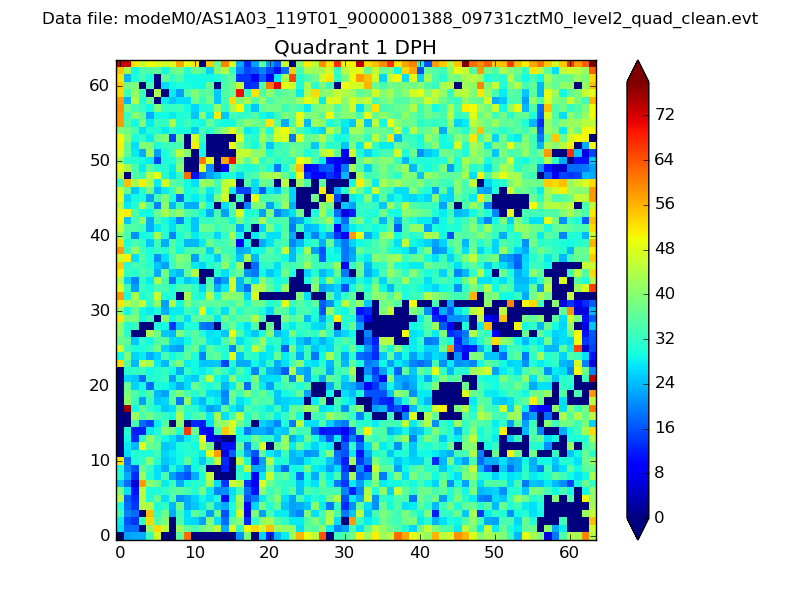 |
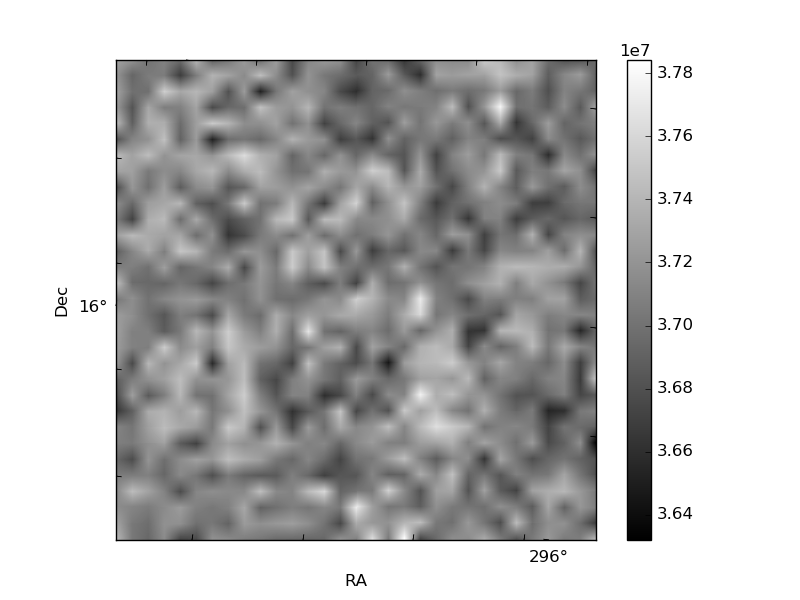
Quadrant B |
|---|---|---|---|
| Quadrant D | 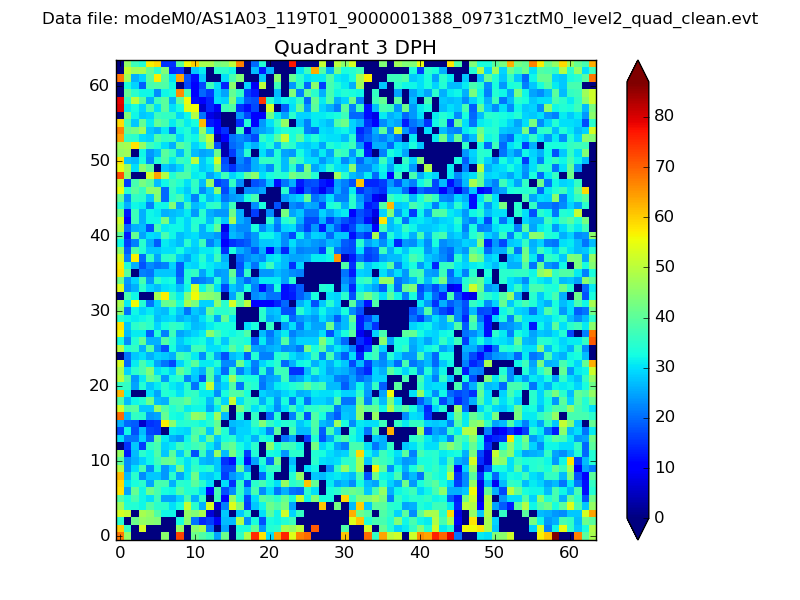 |
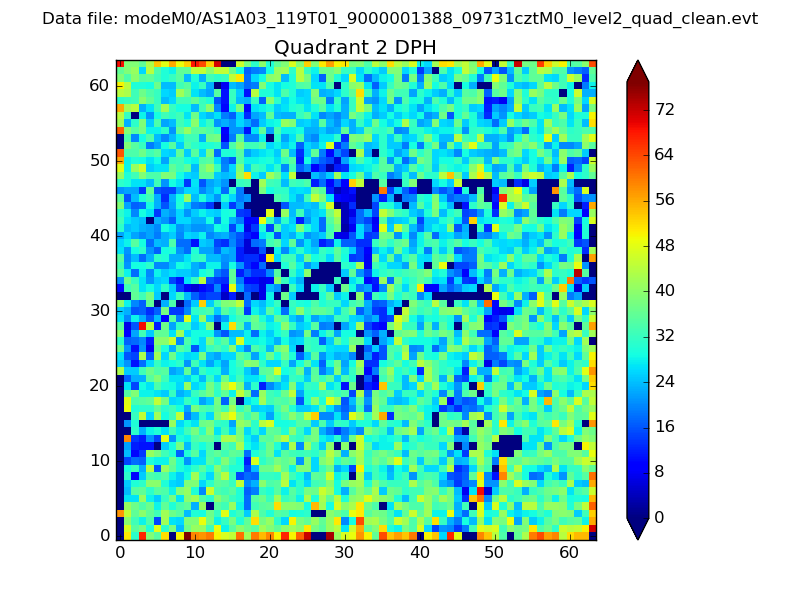 |
Quadrant C |
| Plot type | Count rate plots | Images |
|---|---|---|
| Comparison with Poisson distribution Blue bars denote a histogram of data divided into 1 sec bins. Red curve is a Poisson curve with rate = median count rate of data. |
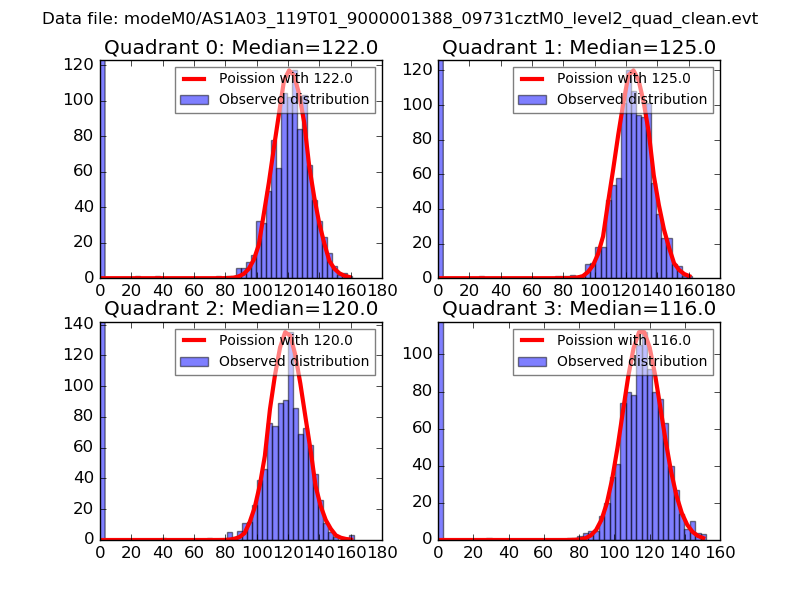 |
 |
| Quadrant-wise count rates Data is divided into 100 sec bins |
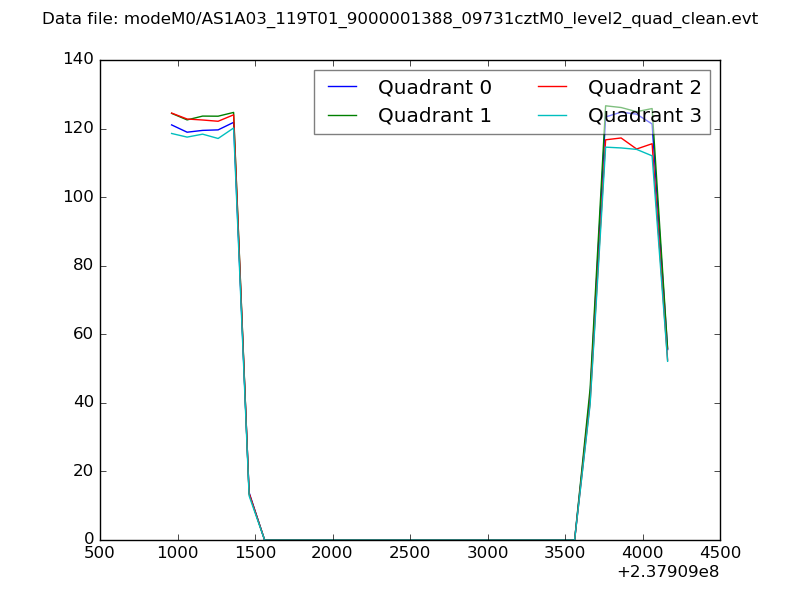 |
|
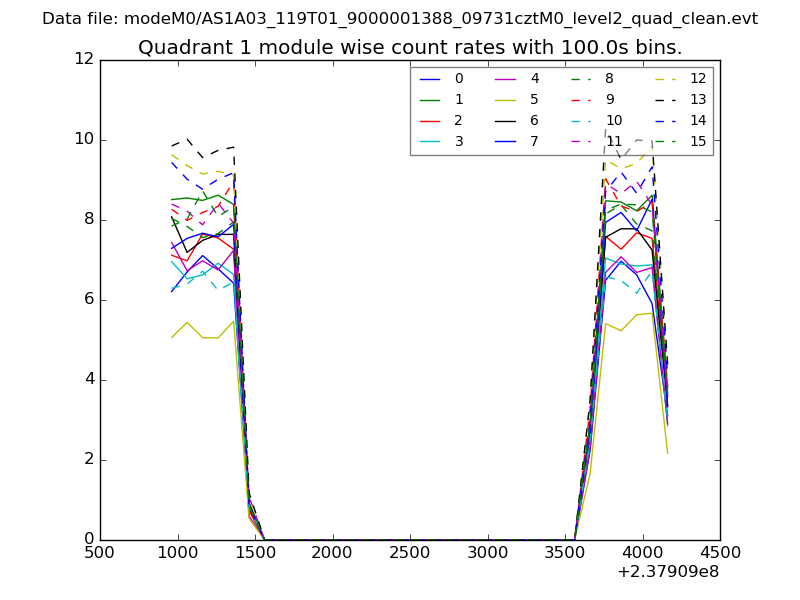
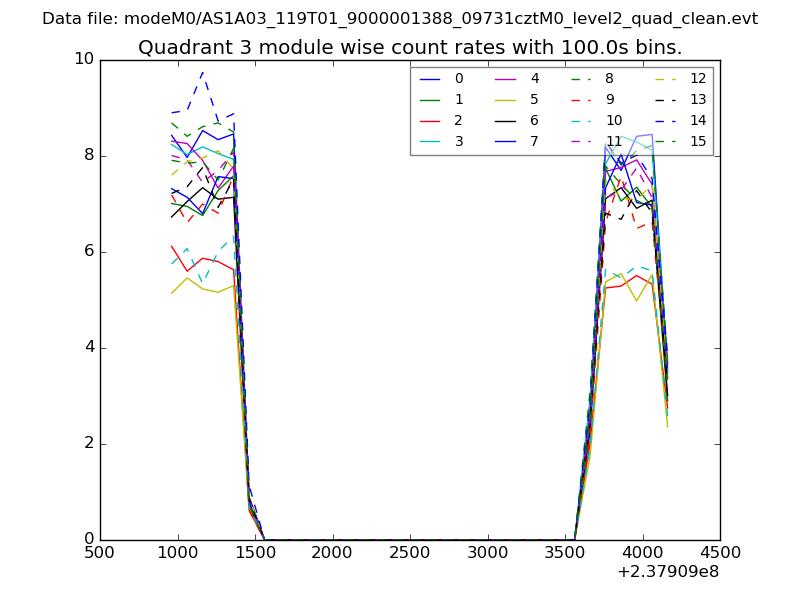
| Module-wise count rates for Quadrant A Data is divided into 100 sec bins |
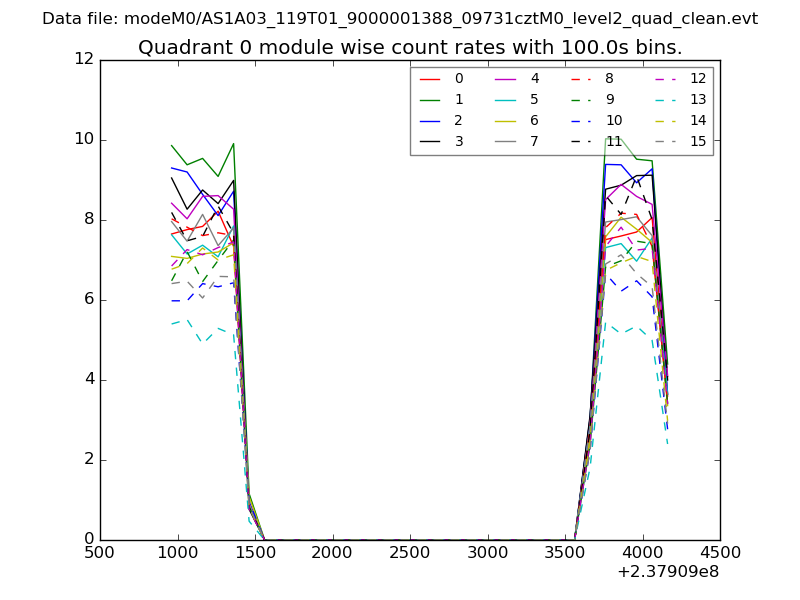 |
 |
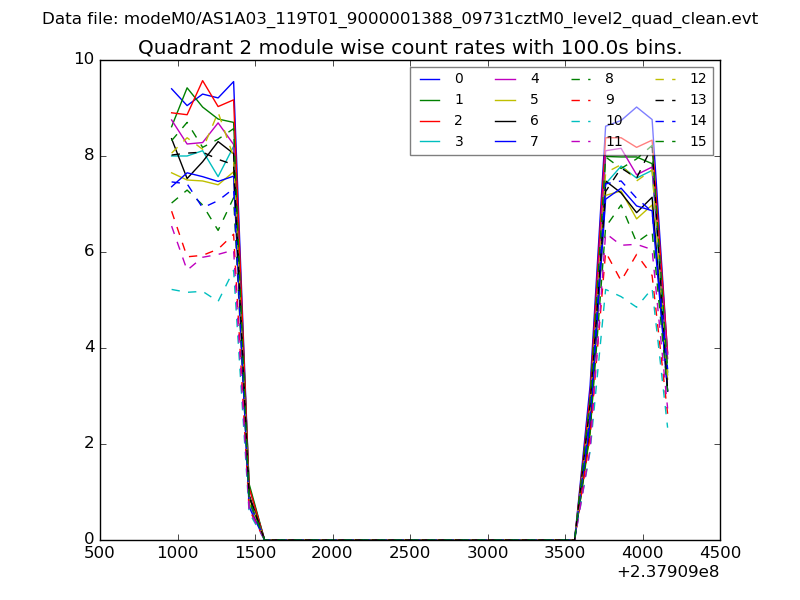
| Module-wise count rates for Quadrant B Data is divided into 100 sec bins |
 |
 |
| Module-wise count rates for Quadrant C Data is divided into 100 sec bins |
 |
 |
| Module-wise count rates for Quadrant D Data is divided into 100 sec bins |
 |
 |
| Parameter | Plot |
|---|---|
| CZT HV Monitor | 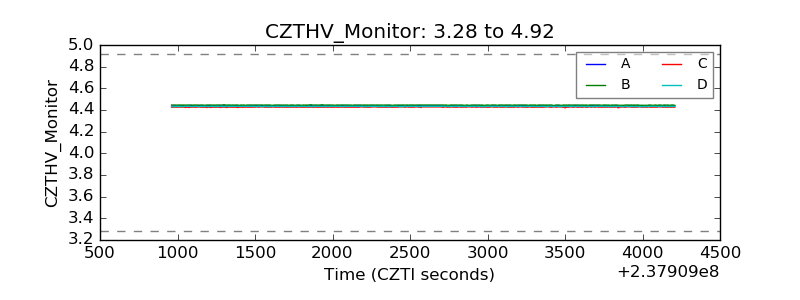 |
| D_VDD | 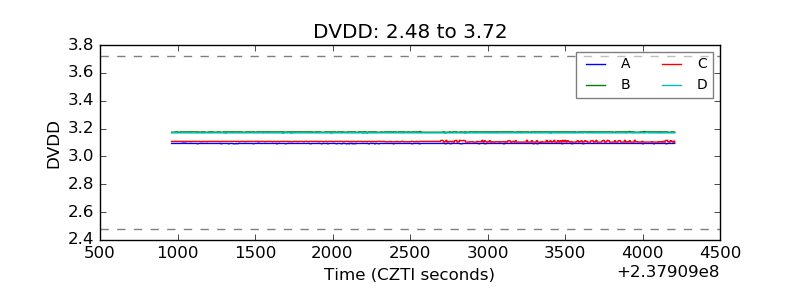 |
| Temperature 1 | 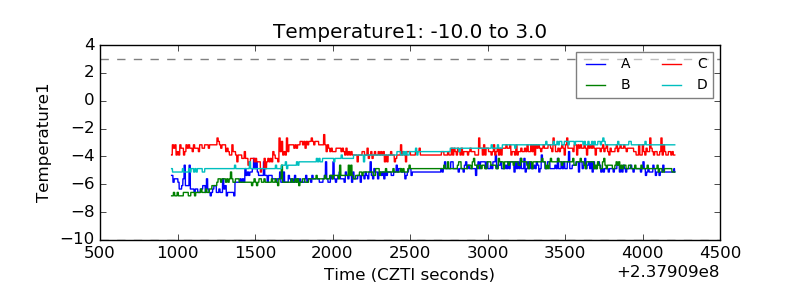 |
| Veto HV Monitor | 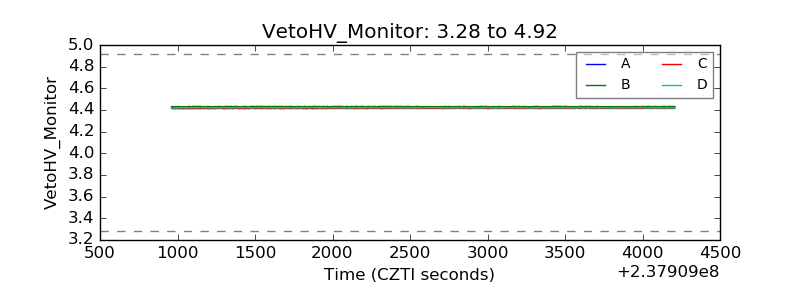 |
| Veto LLD | 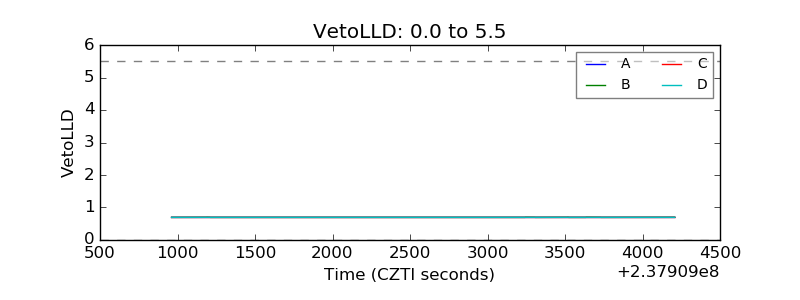 |
| Alpha Counter | 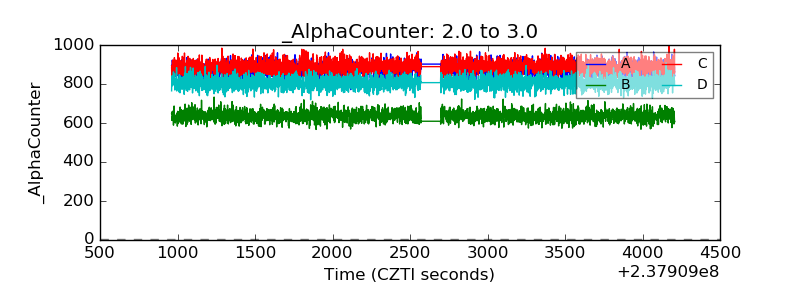 |
| _CPM_Rate | 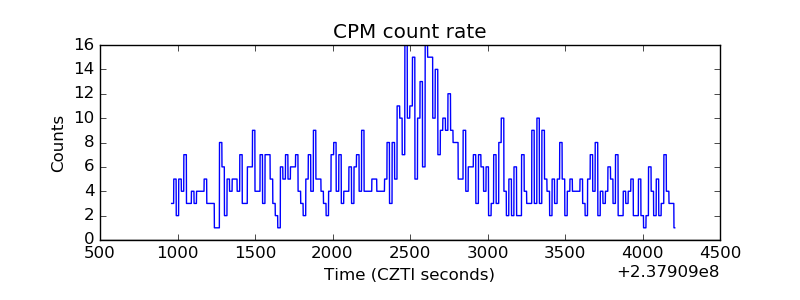 |
| CZT Counter | 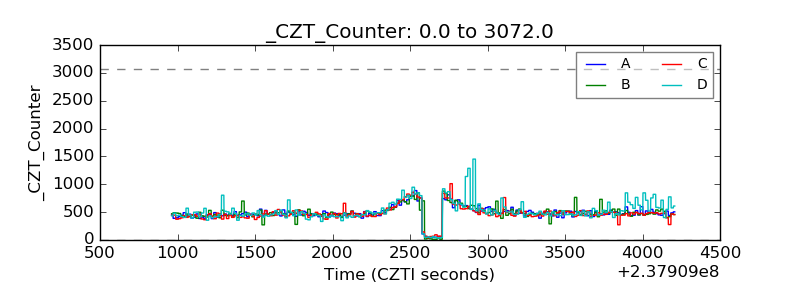 |
| +2.5 Volts monitor |  |
| +5 Volts monitor |  |
| _ROLL_ROT | 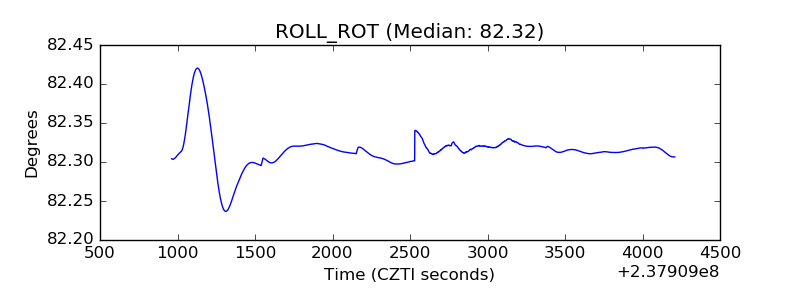 |
| _Roll_DEC | 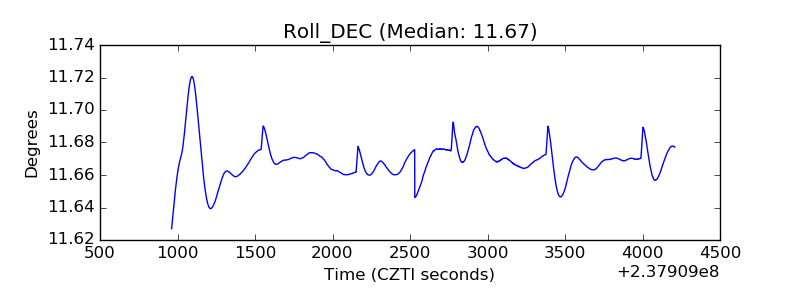 |
| _Roll_RA | 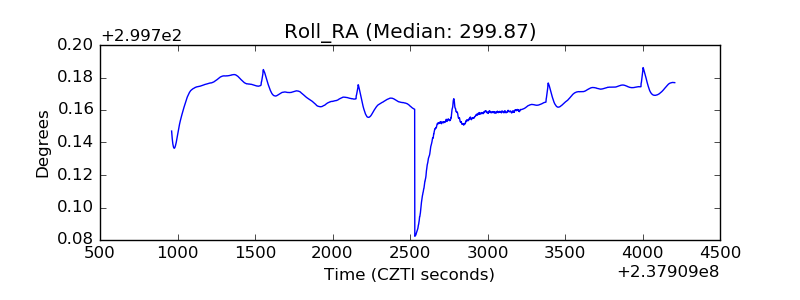 |
| Veto Counter | 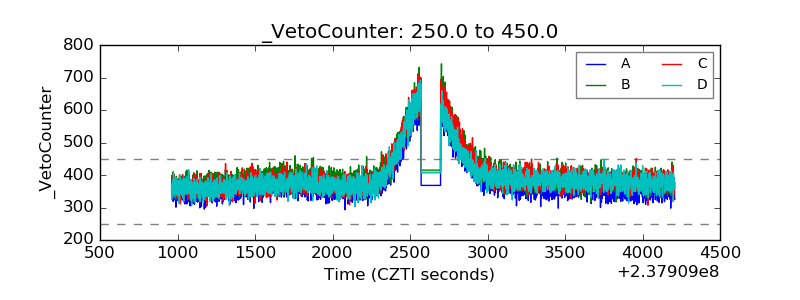 |