| Param | Original file | Final file |
|---|---|---|
| Filename | modeM0/AS1A03_119T01_9000001388_09734cztM0_level2.evt | modeM0/AS1A03_119T01_9000001388_09734cztM0_level2_quad_clean.evt |
| Size (bytes) | 636,212,160 | 122,777,280 |
| Size | 606.7 MB | 117.1 MB |
| Events in quadrant A | 4,475,991 | 780,620 |
| Events in quadrant B | 4,397,713 | 783,751 |
| Events in quadrant C | 4,388,170 | 779,029 |
| Events in quadrant D | 5,335,982 | 692,731 |
| Mode M9 | |||
|---|---|---|---|
| Quadrant | BADHDUFLAG | Total packets | Discarded packets |
| A | 0 | 16 | 1 |
| B | 0 | 16 | 0 |
| C | 0 | 16 | 2 |
| D | 0 | 16 | 2 |
| Mode M0 | |||
|---|---|---|---|
| Quadrant | BADHDUFLAG | Total packets | Discarded packets |
| A | 0 | 26884 | 6532 |
| B | 0 | 26707 | 6774 |
| C | 0 | 26660 | 6417 |
| D | 0 | 33116 | 10406 |
| Mode SS | |||
|---|---|---|---|
| Quadrant | BADHDUFLAG | Total packets | Discarded packets |
| A | 0 | 265 | 59 |
| B | 0 | 266 | 50 |
| C | 0 | 265 | 63 |
| D | 0 | 265 | 69 |
| Quadrant | Total seconds | Saturated seconds | Saturation percentage |
|---|---|---|---|
| A | 9921 | 81 | 0.816450% |
| B | 9788 | 83 | 0.847977% |
| C | 9961 | 65 | 0.652545% |
| D | 9507 | 387 | 4.070685% |
Noise dominated data is calculated using 1-second bins in cleaned event files. If a bin has >2000 counts, and if more than 50% of those come from <1% of pixels, then it is considered to be noise-dominated and hence unusable.
| Quadrant | # 1 sec bins | Bins with >0 counts | Bins with >2000 counts | High rate bins dominated by noise | Noise dominated (total time) | Noise dominated (detector-on time) | Marked lightcurve |
|---|---|---|---|---|---|---|---|
| A | 14570 | 11601 | 2 | 2 | 0.01% | 0.02% | 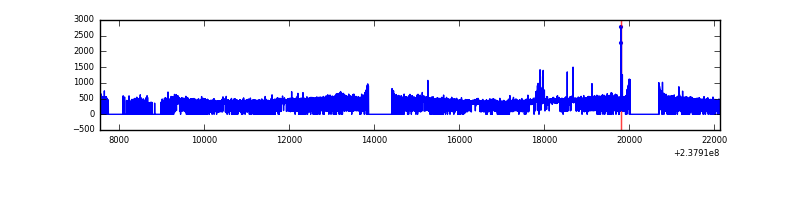 |
| B | 14569 | 11443 | 0 | 0 | 0.00% | 0.00% | 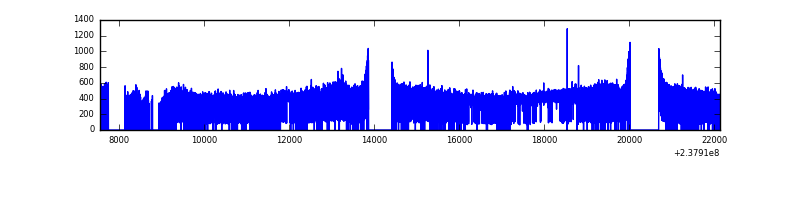 |
| C | 14567 | 11580 | 0 | 0 | 0.00% | 0.00% | 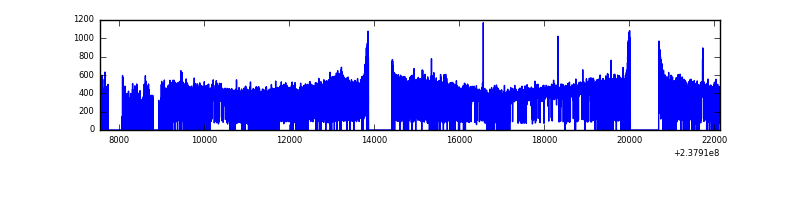 |
| D | 14555 | 11268 | 204 | 204 | 1.40% | 1.81% | 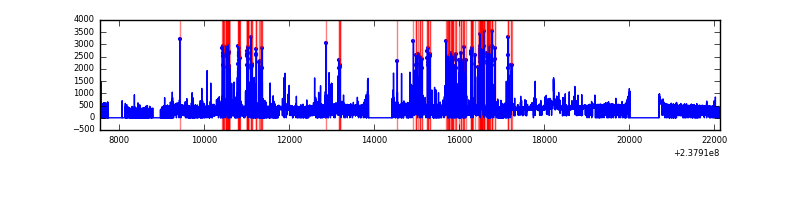 |
Top three noisy pixels from each quadrant. If the there are fewer than three noisy pixels in the level2.evt file, extra rows are filled as -1
| Pixel properties | Quadrant properties | ||||||
|---|---|---|---|---|---|---|---|
| Quadrant | DetID | PixID | Counts | Sigma | Mean | Median | Sigma |
| A | 15 | 239 | 36564 | 150.21 | 1148 | 1123 | 235.9 |
| A | 14 | 111 | 19553 | 78.11 | 1148 | 1123 | 235.9 |
| A | 0 | 226 | 10597 | 40.15 | 1148 | 1123 | 235.9 |
| B | 12 | 111 | 25612 | 112.0 | 1132 | 1103 | 218.8 |
| B | 11 | 111 | 21203 | 91.86 | 1132 | 1103 | 218.8 |
| B | 14 | 111 | 16498 | 70.35 | 1132 | 1103 | 218.8 |
| C | 13 | 61 | 8212 | 27.05 | 1122 | 1131 | 261.7 |
| C | 14 | 234 | 5407 | 16.34 | 1122 | 1131 | 261.7 |
| C | 9 | 237 | 4251 | 11.92 | 1122 | 1131 | 261.7 |
| D | 1 | 52 | 1290076 | 4680.92 | 1055 | 1033 | 275.4 |
| D | 2 | 234 | 33080 | 116.37 | 1055 | 1033 | 275.4 |
| D | 14 | 226 | 10680 | 35.03 | 1055 | 1033 | 275.4 |
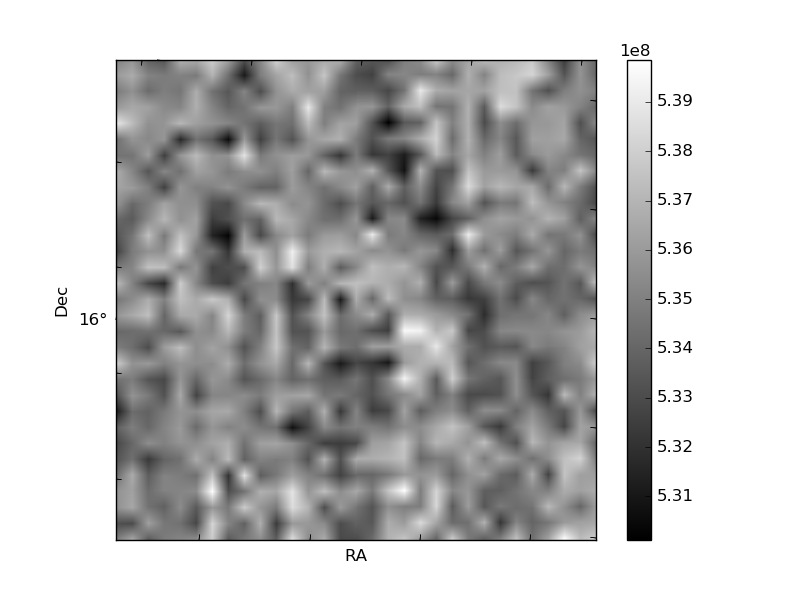
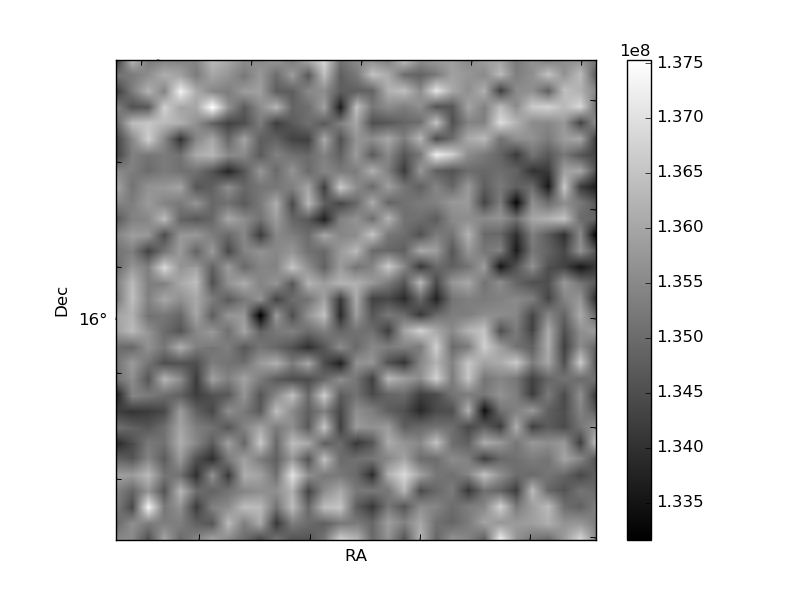
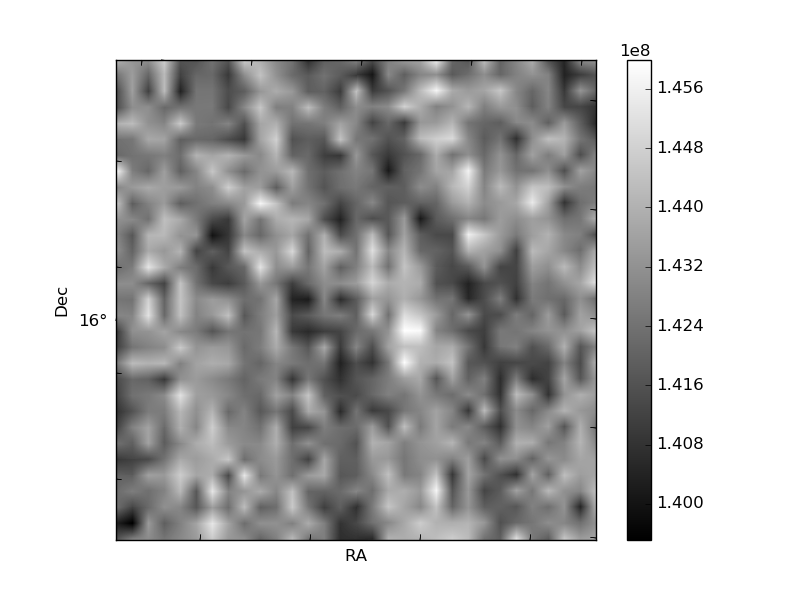
Histogram calculated using DETX and DETY for each event in the final _common_clean file
| Quadrant A | 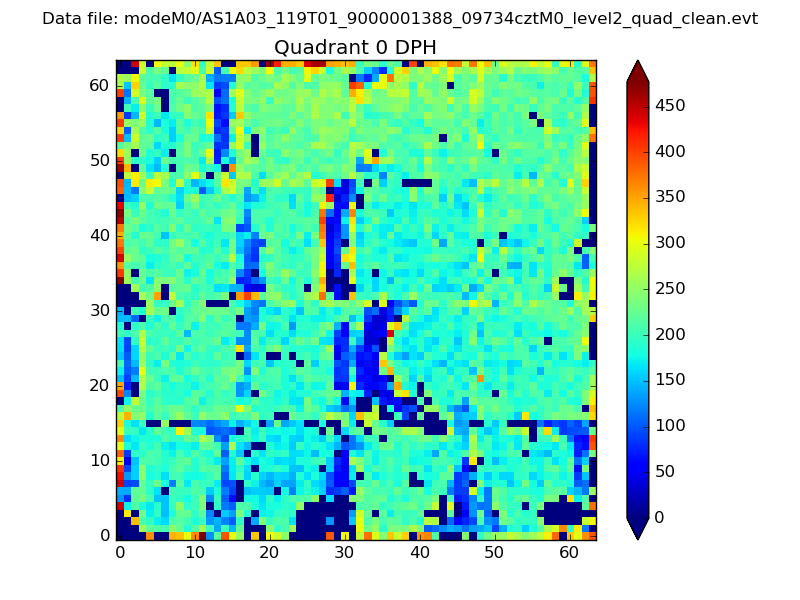 |
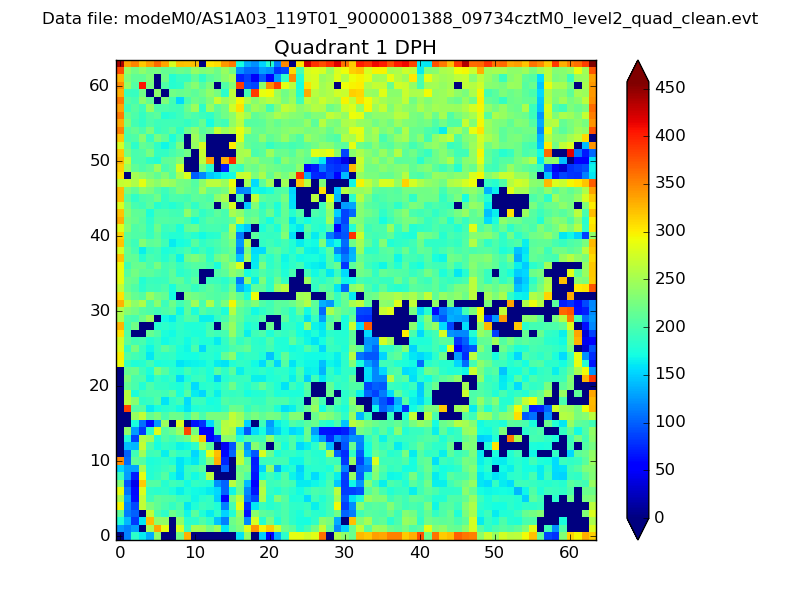 |
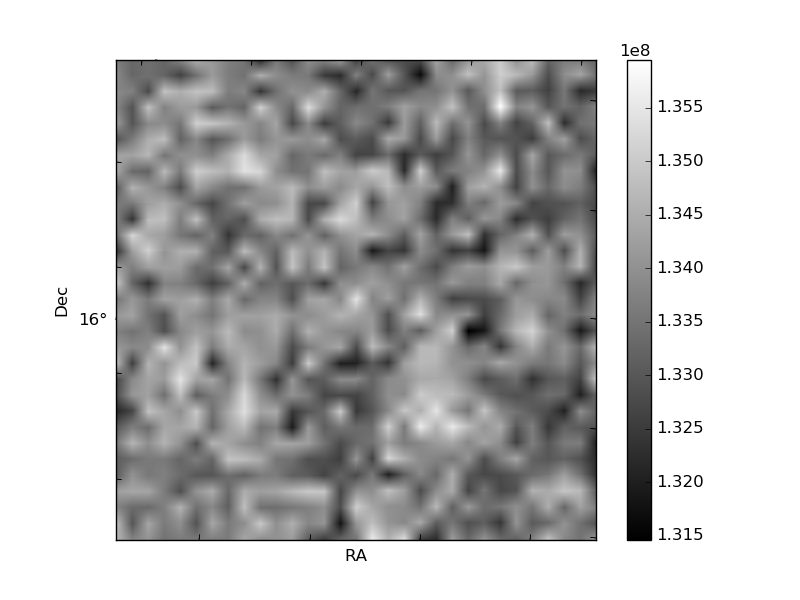
Quadrant B |
|---|---|---|---|
| Quadrant D | 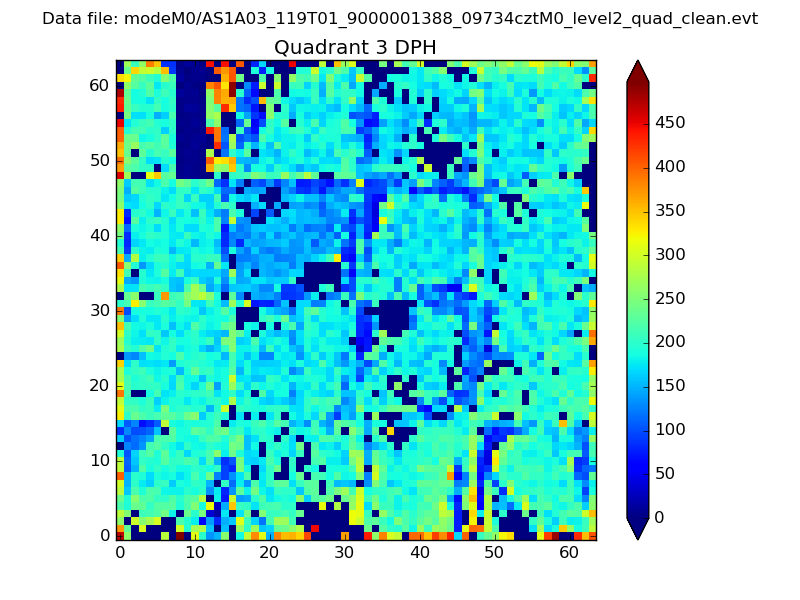 |
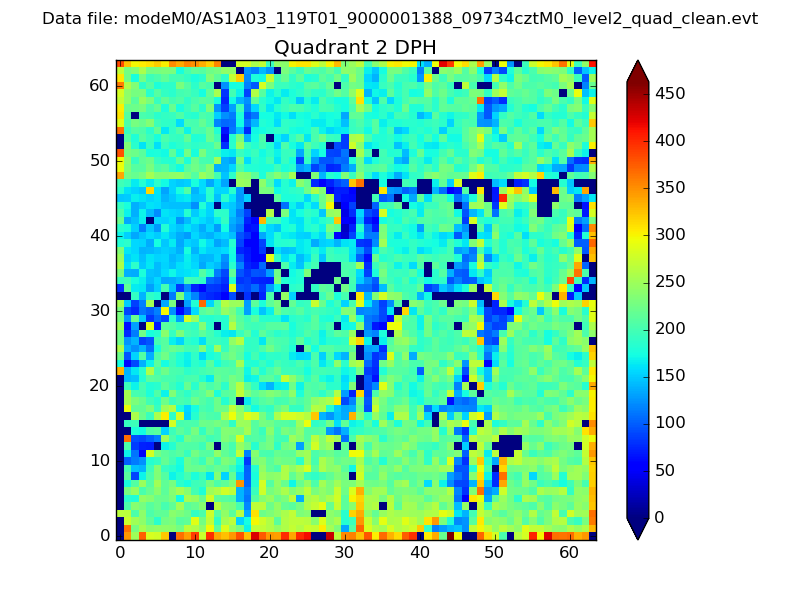 |
Quadrant C |
| Plot type | Count rate plots | Images |
|---|---|---|
| Comparison with Poisson distribution Blue bars denote a histogram of data divided into 1 sec bins. Red curve is a Poisson curve with rate = median count rate of data. |
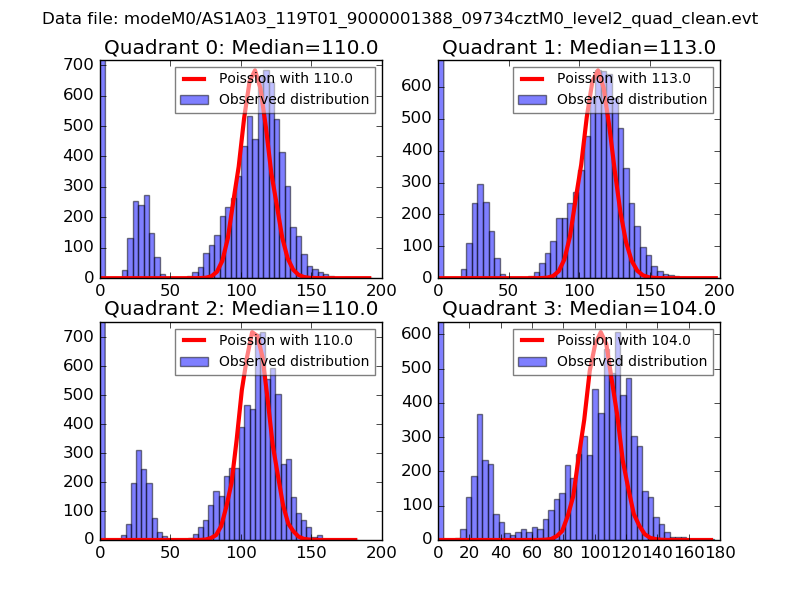 |
 |
| Quadrant-wise count rates Data is divided into 100 sec bins |
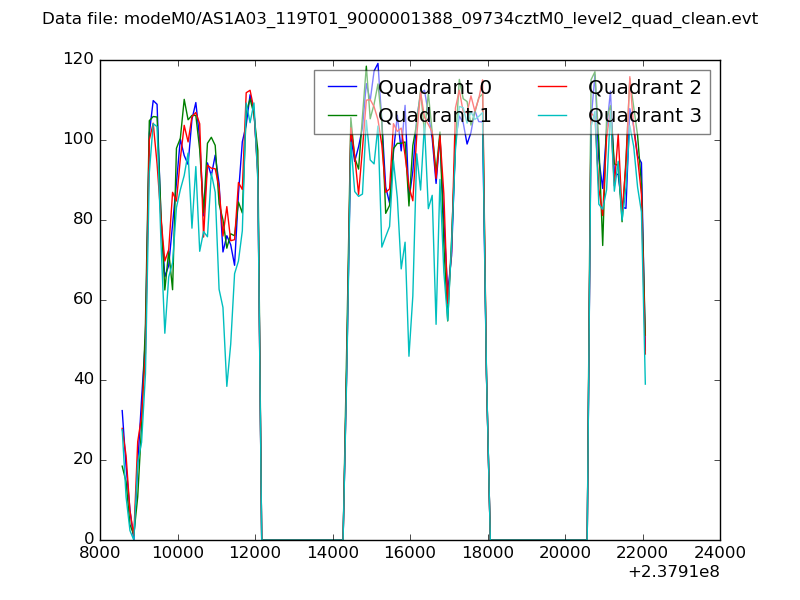 |
|
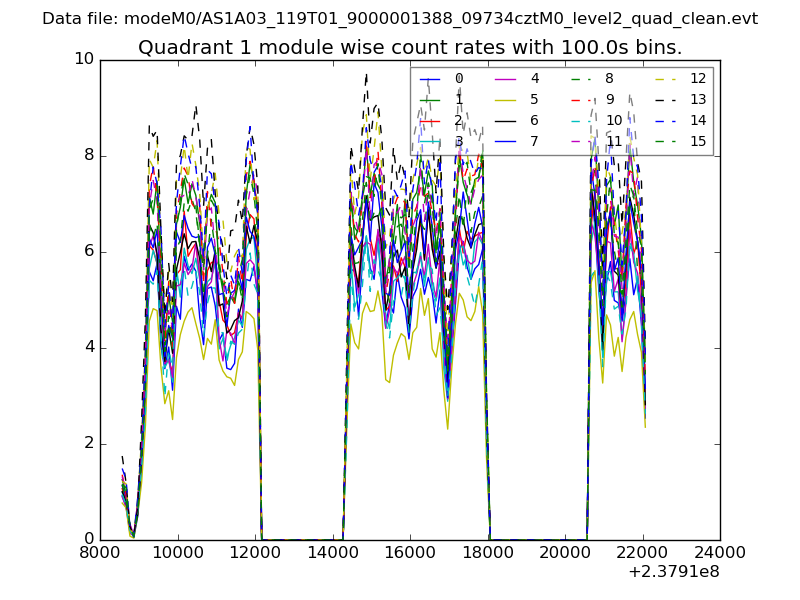
| Module-wise count rates for Quadrant A Data is divided into 100 sec bins |
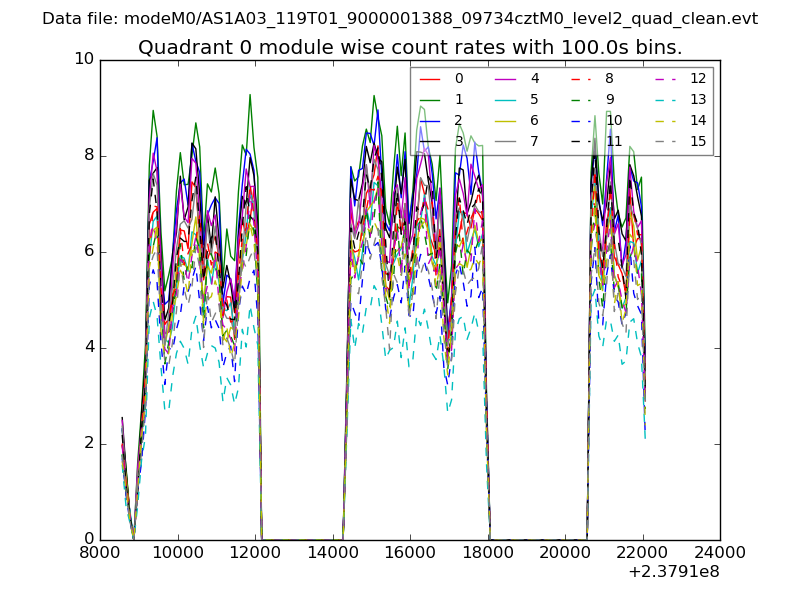 |
 |
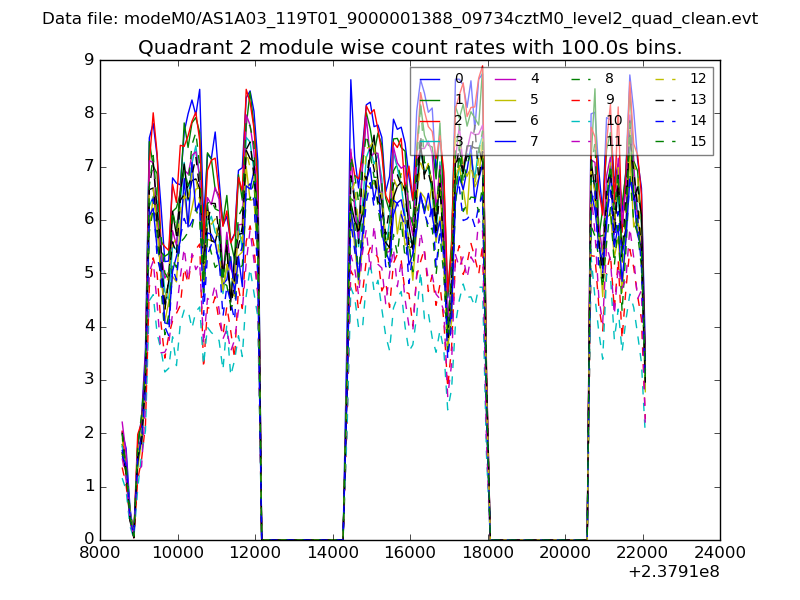
| Module-wise count rates for Quadrant B Data is divided into 100 sec bins |
 |
 |
| Module-wise count rates for Quadrant C Data is divided into 100 sec bins |
 |
 |
| Module-wise count rates for Quadrant D Data is divided into 100 sec bins |
 |
 |
| Parameter | Plot |
|---|---|
| CZT HV Monitor |  |
| D_VDD | 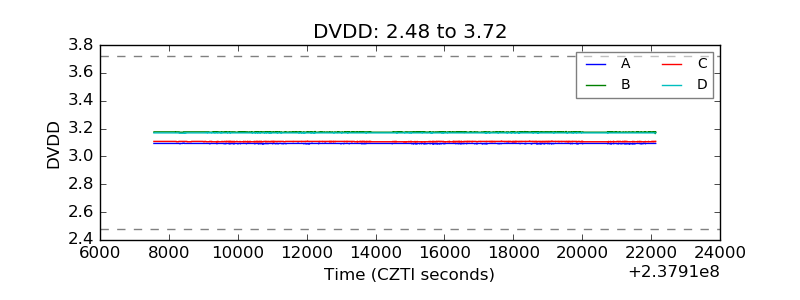 |
| Temperature 1 |  |
| Veto HV Monitor | 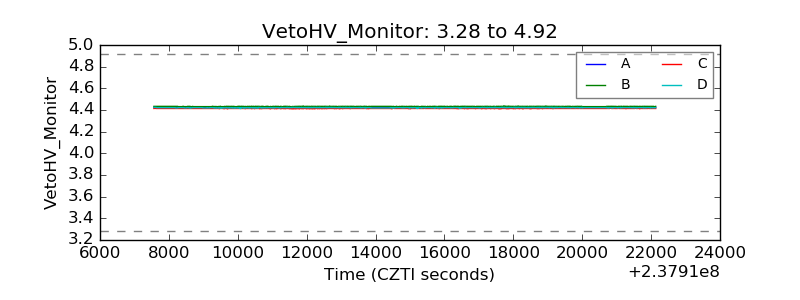 |
| Veto LLD | 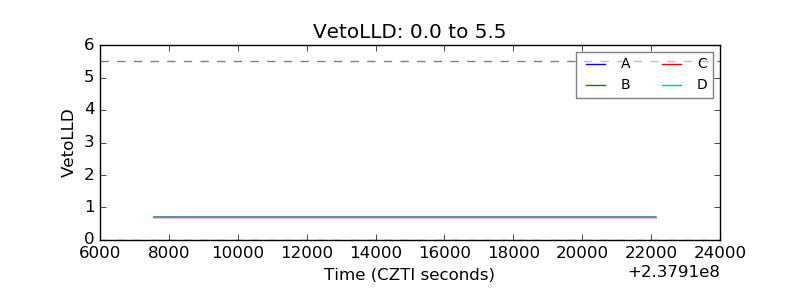 |
| Alpha Counter | 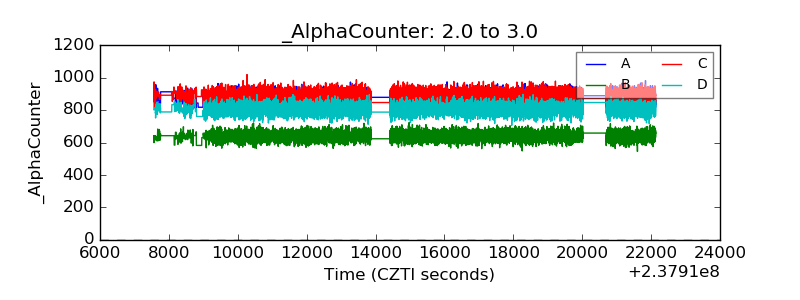 |
| _CPM_Rate | 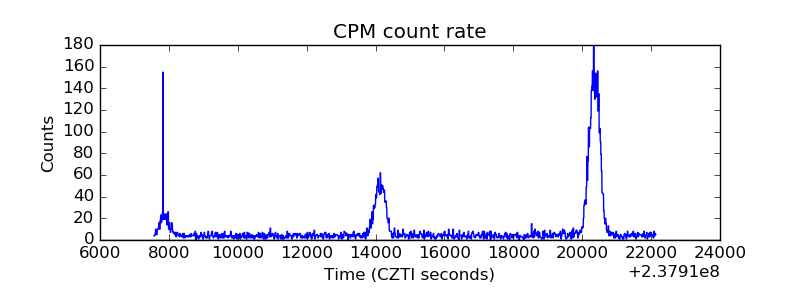 |
| CZT Counter | 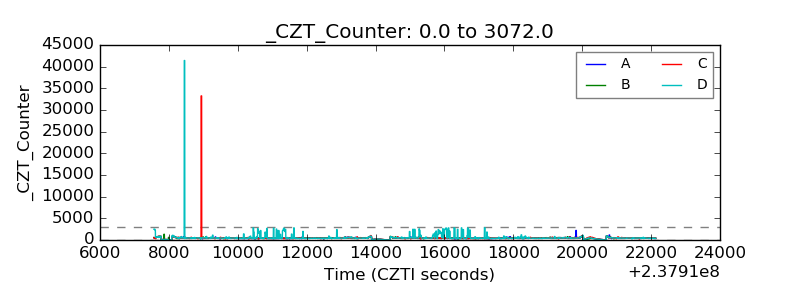 |
| +2.5 Volts monitor |  |
| +5 Volts monitor |  |
| _ROLL_ROT | 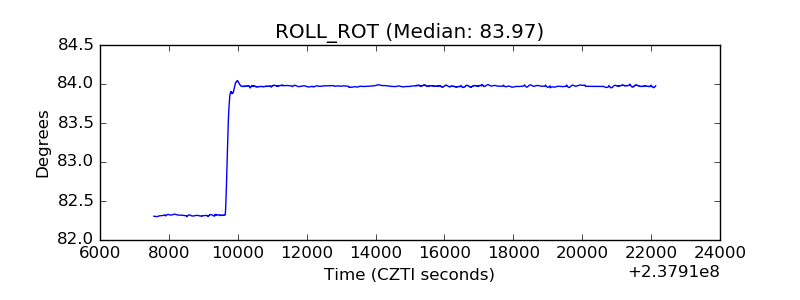 |
| _Roll_DEC | 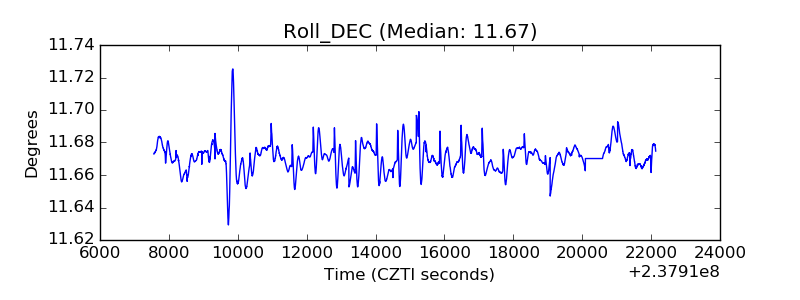 |
| _Roll_RA | 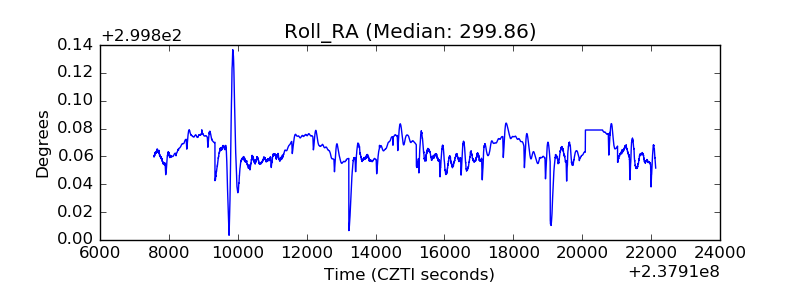 |
| Veto Counter | 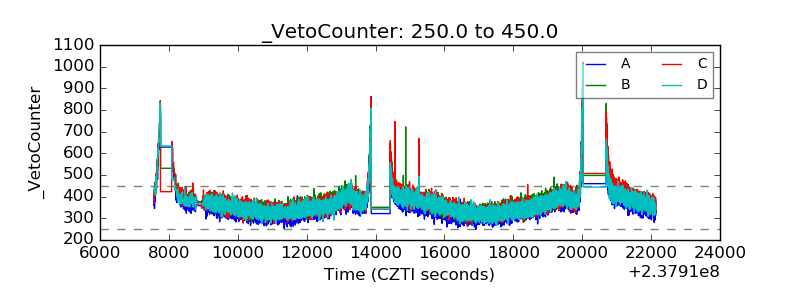 |