| Param | Original file | Final file |
|---|---|---|
| Filename | modeM0/AS1A03_119T01_9000001388_09736cztM0_level2.evt | modeM0/AS1A03_119T01_9000001388_09736cztM0_level2_quad_clean.evt |
| Size (bytes) | 398,217,600 | 86,569,920 |
| Size | 379.8 MB | 82.6 MB |
| Events in quadrant A | 2,886,045 | 544,326 |
| Events in quadrant B | 2,928,618 | 559,266 |
| Events in quadrant C | 2,876,133 | 543,464 |
| Events in quadrant D | 2,933,528 | 528,246 |
| Mode M9 | |||
|---|---|---|---|
| Quadrant | BADHDUFLAG | Total packets | Discarded packets |
| A | 0 | 14 | 0 |
| B | 0 | 14 | 0 |
| C | 0 | 14 | 0 |
| D | 0 | 15 | 1 |
| Mode M0 | |||
|---|---|---|---|
| Quadrant | BADHDUFLAG | Total packets | Discarded packets |
| A | 0 | 13600 | 515 |
| B | 0 | 13592 | 436 |
| C | 0 | 13639 | 505 |
| D | 0 | 13849 | 491 |
| Mode SS | |||
|---|---|---|---|
| Quadrant | BADHDUFLAG | Total packets | Discarded packets |
| A | 0 | 134 | 2 |
| B | 0 | 134 | 4 |
| C | 0 | 134 | 4 |
| D | 0 | 134 | 0 |
| Quadrant | Total seconds | Saturated seconds | Saturation percentage |
|---|---|---|---|
| A | 6372 | 37 | 0.580665% |
| B | 6413 | 41 | 0.639326% |
| C | 6375 | 30 | 0.470588% |
| D | 6384 | 37 | 0.579574% |
Noise dominated data is calculated using 1-second bins in cleaned event files. If a bin has >2000 counts, and if more than 50% of those come from <1% of pixels, then it is considered to be noise-dominated and hence unusable.
| Quadrant | # 1 sec bins | Bins with >0 counts | Bins with >2000 counts | High rate bins dominated by noise | Noise dominated (total time) | Noise dominated (detector-on time) | Marked lightcurve |
|---|---|---|---|---|---|---|---|
| A | 7645 | 6594 | 0 | 0 | 0.00% | 0.00% | 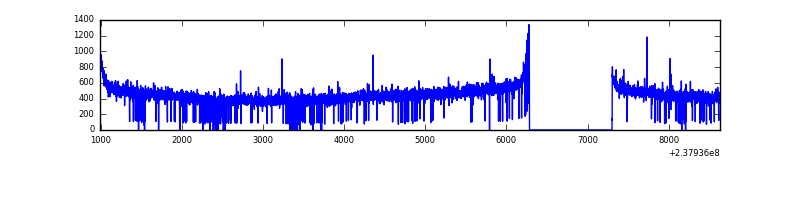 |
| B | 7645 | 6600 | 0 | 0 | 0.00% | 0.00% | 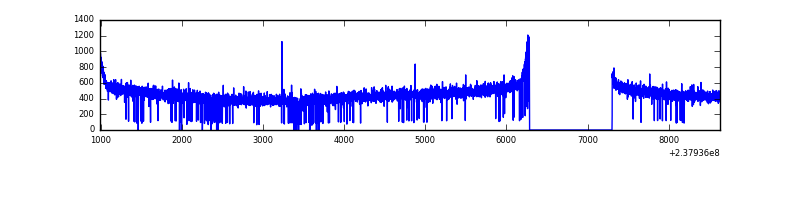 |
| C | 7645 | 6591 | 0 | 0 | 0.00% | 0.00% | 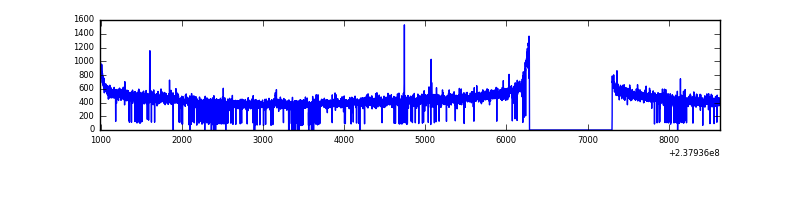 |
| D | 7645 | 6599 | 5 | 5 | 0.07% | 0.08% | 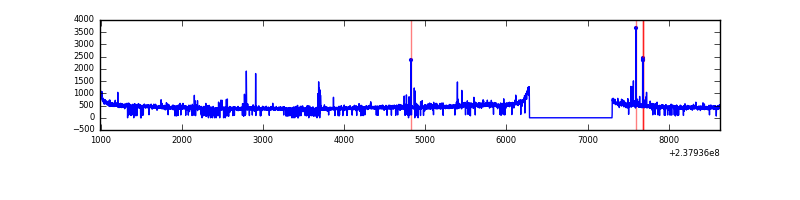 |
Top three noisy pixels from each quadrant. If the there are fewer than three noisy pixels in the level2.evt file, extra rows are filled as -1
| Pixel properties | Quadrant properties | ||||||
|---|---|---|---|---|---|---|---|
| Quadrant | DetID | PixID | Counts | Sigma | Mean | Median | Sigma |
| A | 0 | 226 | 6984 | 41.45 | 746 | 731 | 150.9 |
| A | 14 | 111 | 6925 | 41.06 | 746 | 731 | 150.9 |
| A | 12 | 194 | 5959 | 34.65 | 746 | 731 | 150.9 |
| B | 12 | 111 | 16734 | 109.99 | 754 | 739 | 145.4 |
| B | 11 | 111 | 13873 | 90.31 | 754 | 739 | 145.4 |
| B | 14 | 111 | 11277 | 72.46 | 754 | 739 | 145.4 |
| C | 9 | 237 | 7549 | 39.6 | 734 | 738 | 172.0 |
| C | 13 | 61 | 5387 | 27.03 | 734 | 738 | 172.0 |
| C | 8 | 222 | 3039 | 13.38 | 734 | 738 | 172.0 |
| D | 1 | 52 | 109555 | 573.5 | 725 | 711 | 189.8 |
| D | 8 | 195 | 46422 | 240.85 | 725 | 711 | 189.8 |
| D | 2 | 234 | 20049 | 101.89 | 725 | 711 | 189.8 |
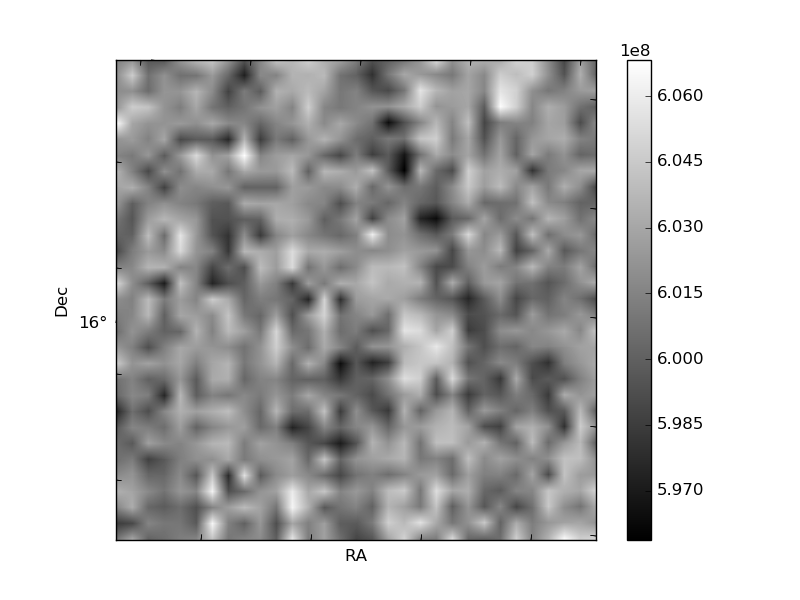
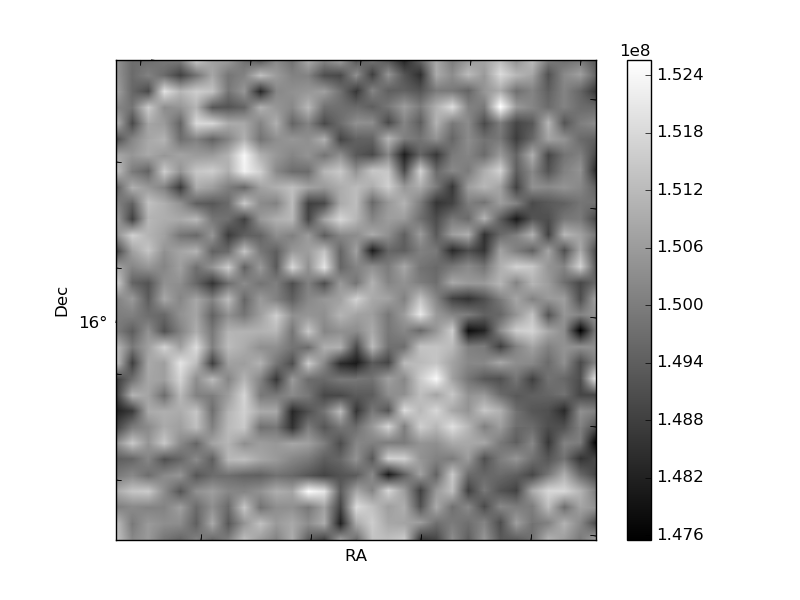
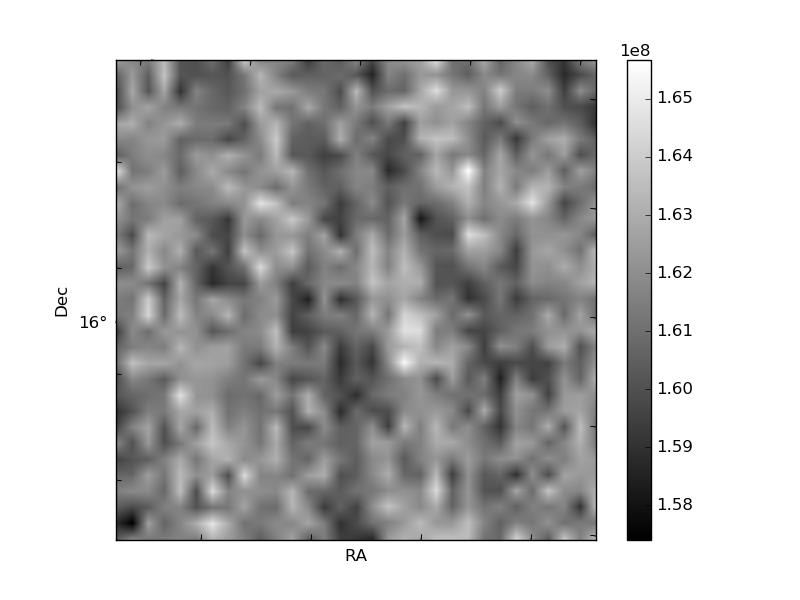
Histogram calculated using DETX and DETY for each event in the final _common_clean file
| Quadrant A | 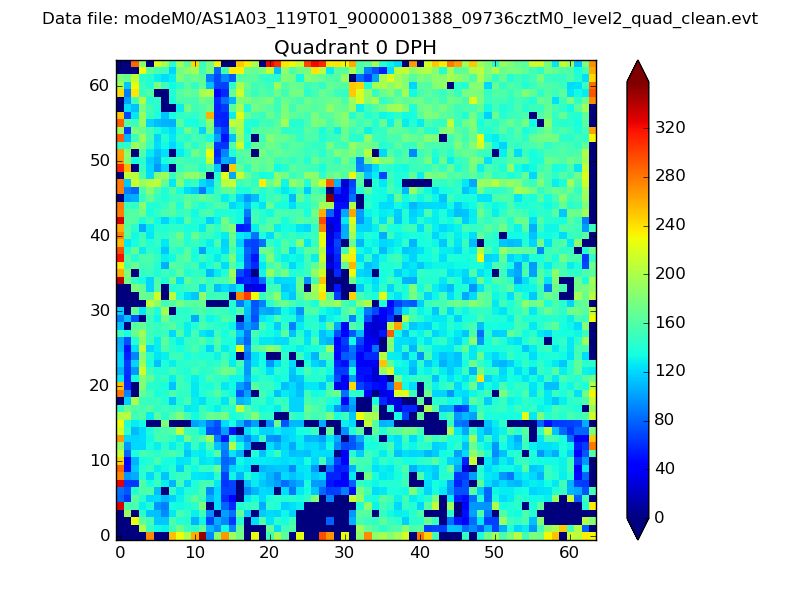 |
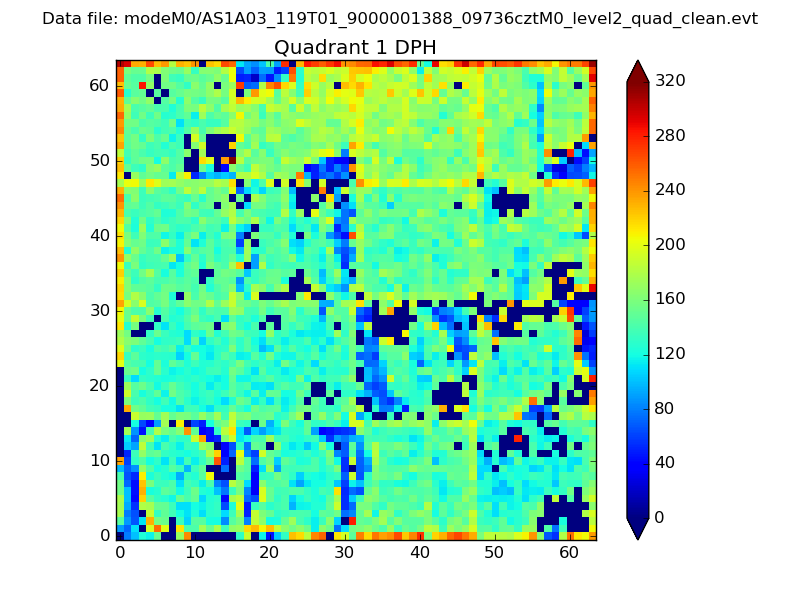 |
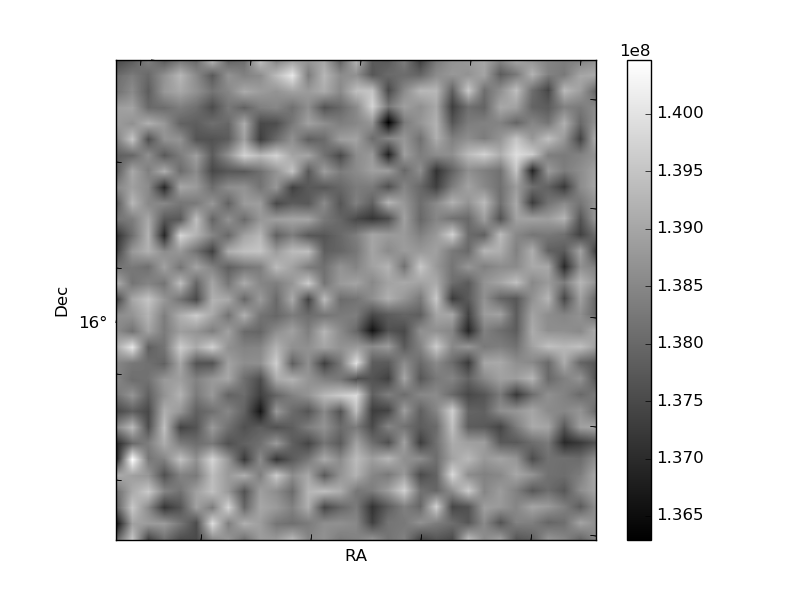
Quadrant B |
|---|---|---|---|
| Quadrant D | 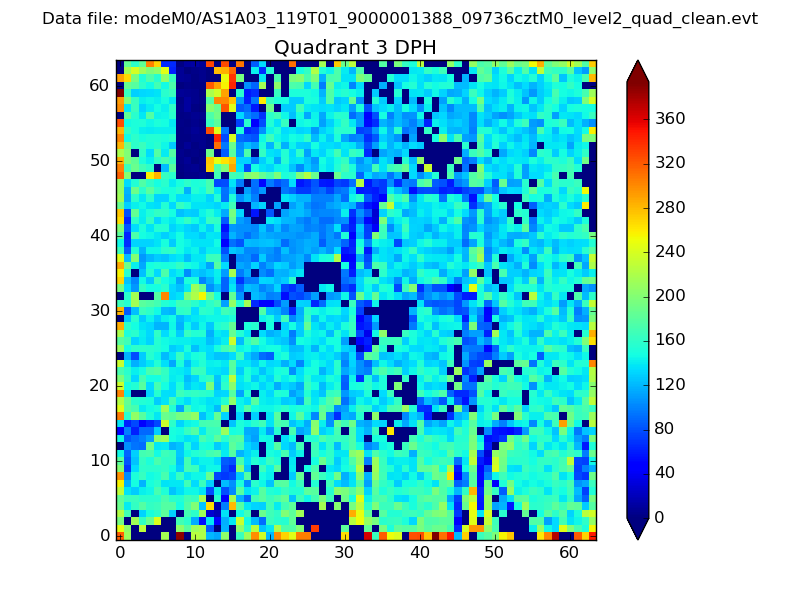 |
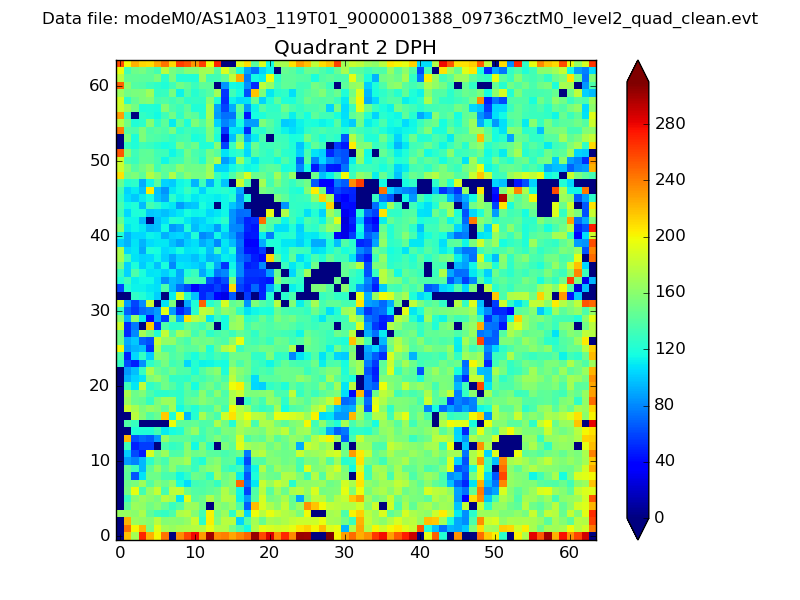 |
Quadrant C |
| Plot type | Count rate plots | Images |
|---|---|---|
| Comparison with Poisson distribution Blue bars denote a histogram of data divided into 1 sec bins. Red curve is a Poisson curve with rate = median count rate of data. |
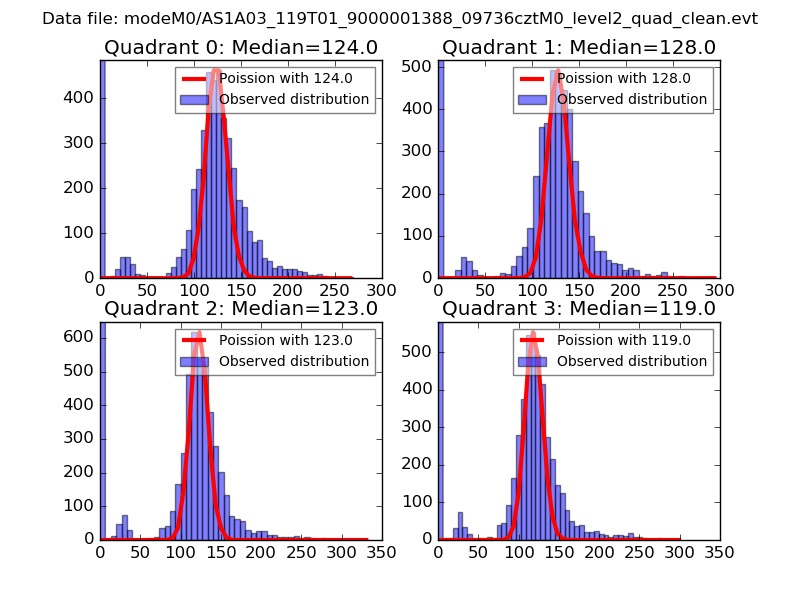 |
 |
| Quadrant-wise count rates Data is divided into 100 sec bins |
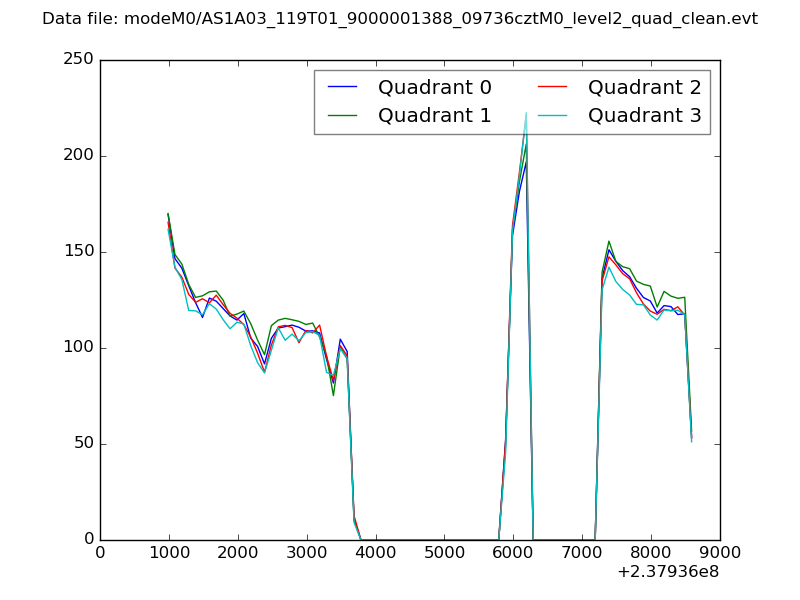 |
|
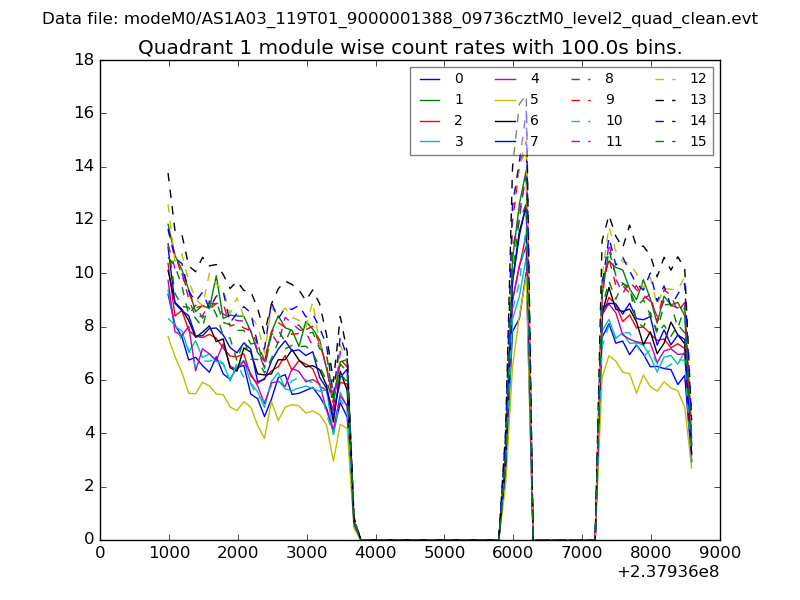
| Module-wise count rates for Quadrant A Data is divided into 100 sec bins |
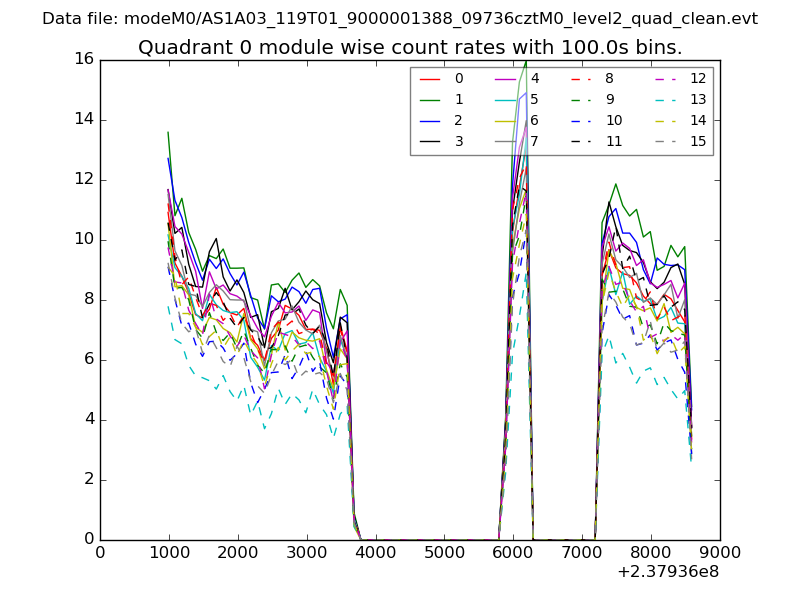 |
 |
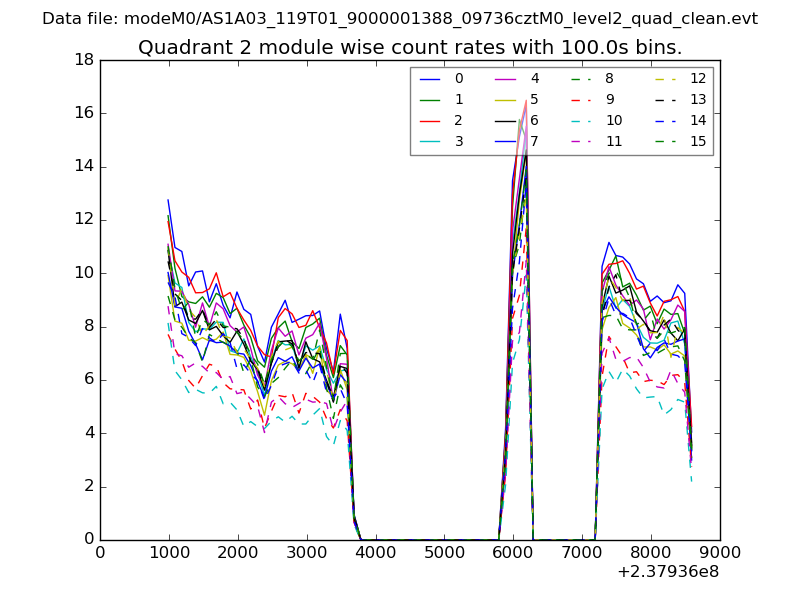
| Module-wise count rates for Quadrant B Data is divided into 100 sec bins |
 |
 |
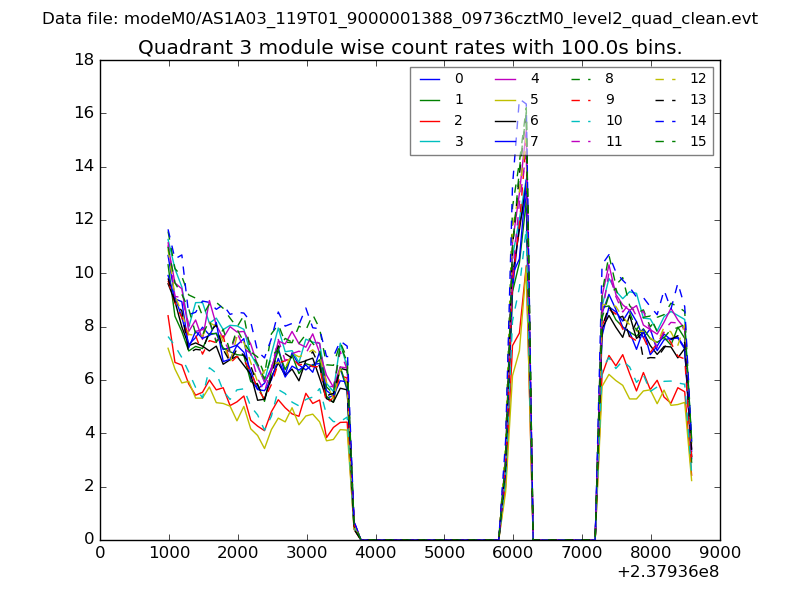
| Module-wise count rates for Quadrant C Data is divided into 100 sec bins |
 |
 |
| Module-wise count rates for Quadrant D Data is divided into 100 sec bins |
 |
 |
| Parameter | Plot |
|---|---|
| CZT HV Monitor | 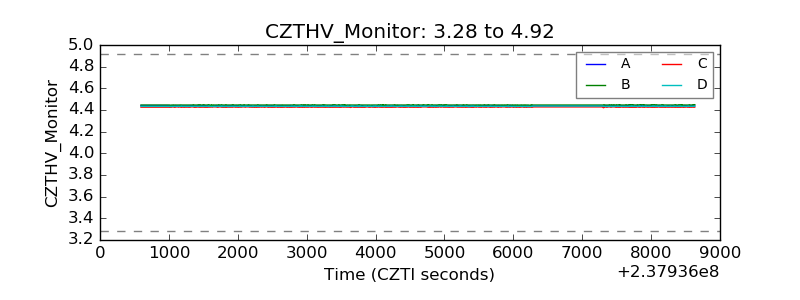 |
| D_VDD | 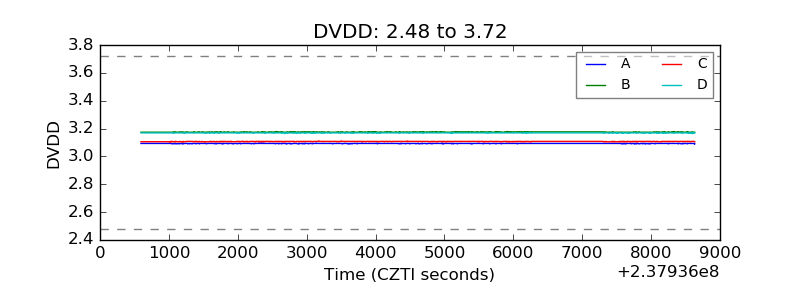 |
| Temperature 1 | 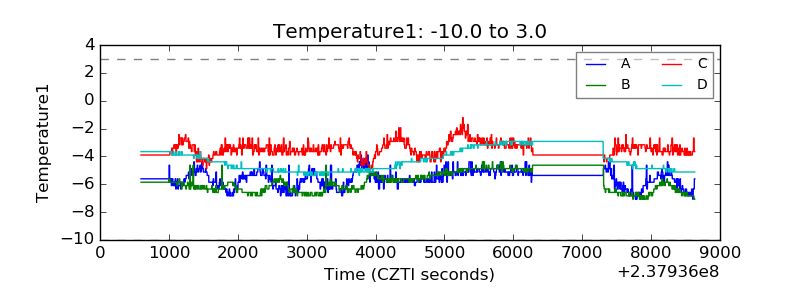 |
| Veto HV Monitor | 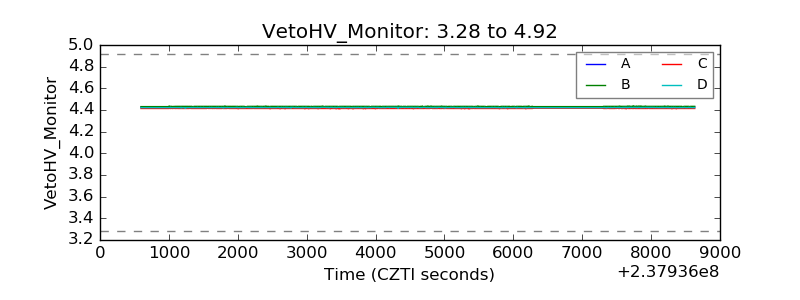 |
| Veto LLD | 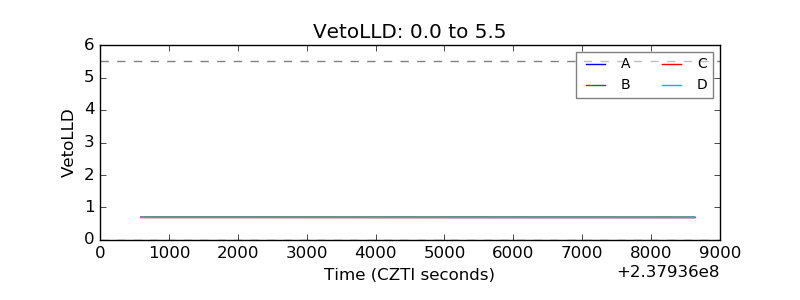 |
| Alpha Counter | 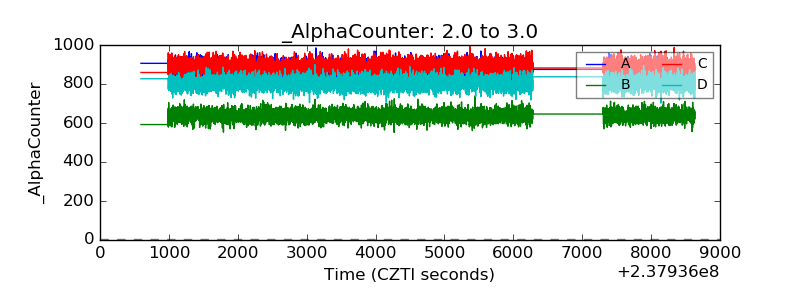 |
| _CPM_Rate | 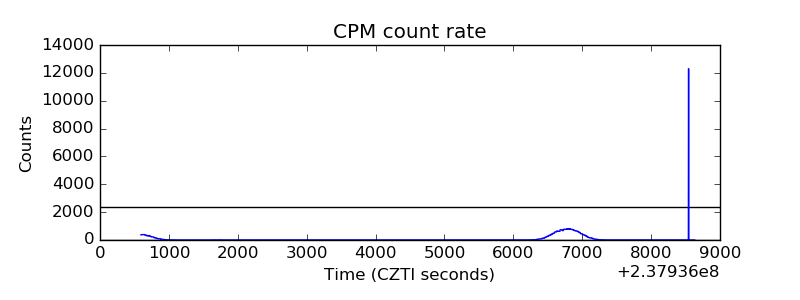 |
| CZT Counter | 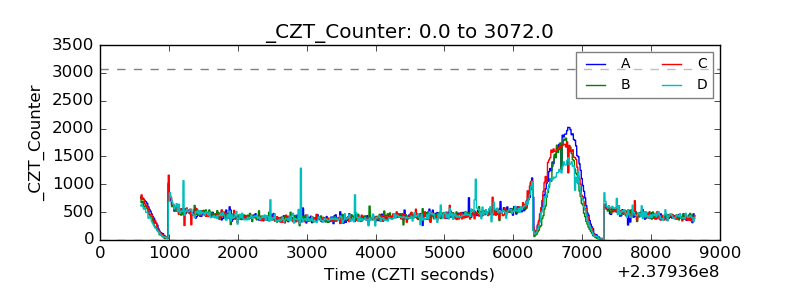 |
| +2.5 Volts monitor | 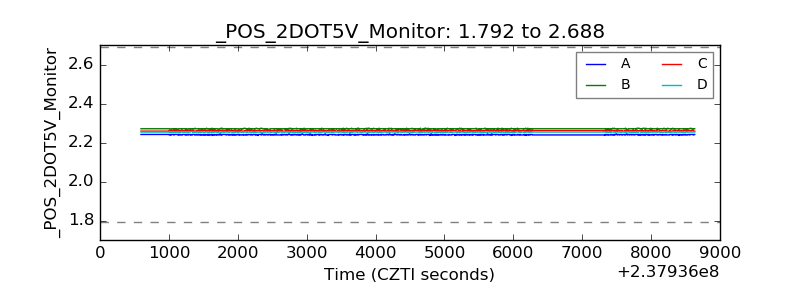 |
| +5 Volts monitor |  |
| _ROLL_ROT | 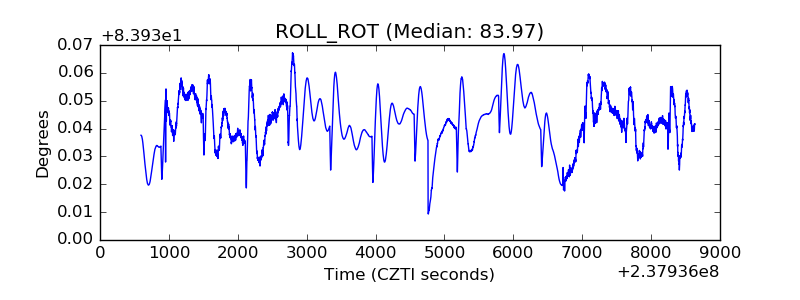 |
| _Roll_DEC | 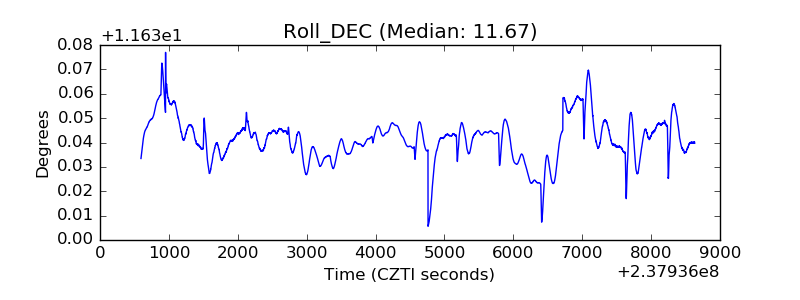 |
| _Roll_RA | 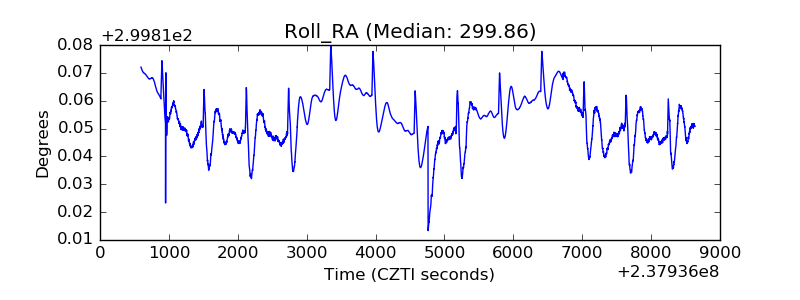 |
| Veto Counter | 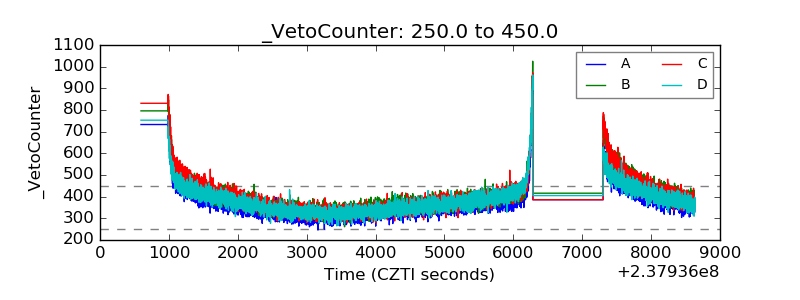 |