| Param | Original file | Final file |
|---|---|---|
| Filename | modeM0/AS1A03_119T01_9000001388_09739cztM0_level2.evt | modeM0/AS1A03_119T01_9000001388_09739cztM0_level2_quad_clean.evt |
| Size (bytes) | 404,858,880 | 88,130,880 |
| Size | 386.1 MB | 84.0 MB |
| Events in quadrant A | 2,928,037 | 562,888 |
| Events in quadrant B | 2,983,926 | 582,798 |
| Events in quadrant C | 2,895,108 | 554,765 |
| Events in quadrant D | 3,028,691 | 532,264 |
| Mode M9 | |||
|---|---|---|---|
| Quadrant | BADHDUFLAG | Total packets | Discarded packets |
| A | 0 | 15 | 0 |
| B | 0 | 15 | 0 |
| C | 0 | 15 | 0 |
| D | 0 | 16 | 0 |
| Mode M0 | |||
|---|---|---|---|
| Quadrant | BADHDUFLAG | Total packets | Discarded packets |
| A | 0 | 12900 | 135 |
| B | 0 | 12950 | 73 |
| C | 0 | 12968 | 97 |
| D | 0 | 13416 | 93 |
| Mode SS | |||
|---|---|---|---|
| Quadrant | BADHDUFLAG | Total packets | Discarded packets |
| A | 0 | 128 | 0 |
| B | 0 | 128 | 0 |
| C | 0 | 128 | 2 |
| D | 0 | 128 | 2 |
| Quadrant | Total seconds | Saturated seconds | Saturation percentage |
|---|---|---|---|
| A | 6234 | 33 | 0.529355% |
| B | 6262 | 53 | 0.846375% |
| C | 6250 | 40 | 0.640000% |
| D | 6258 | 45 | 0.719080% |
Noise dominated data is calculated using 1-second bins in cleaned event files. If a bin has >2000 counts, and if more than 50% of those come from <1% of pixels, then it is considered to be noise-dominated and hence unusable.
| Quadrant | # 1 sec bins | Bins with >0 counts | Bins with >2000 counts | High rate bins dominated by noise | Noise dominated (total time) | Noise dominated (detector-on time) | Marked lightcurve |
|---|---|---|---|---|---|---|---|
| A | 7503 | 6294 | 0 | 0 | 0.00% | 0.00% | 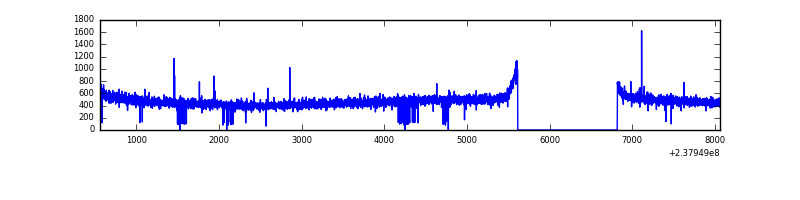 |
| B | 7503 | 6294 | 0 | 0 | 0.00% | 0.00% | 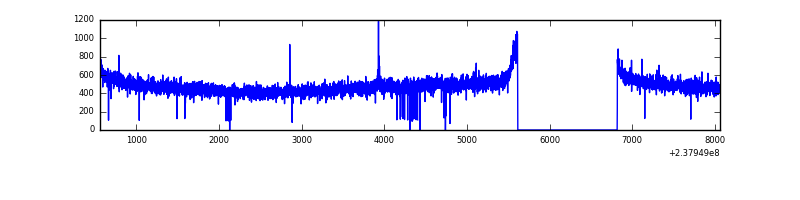 |
| C | 7503 | 6295 | 5 | 5 | 0.07% | 0.08% | 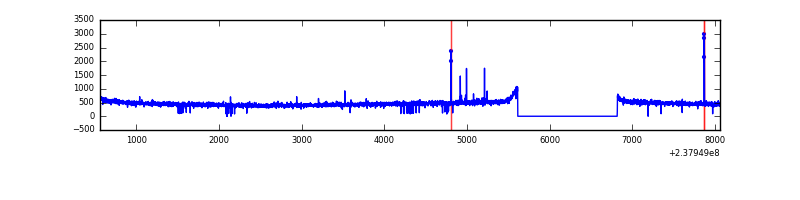 |
| D | 7503 | 6298 | 7 | 7 | 0.09% | 0.11% | 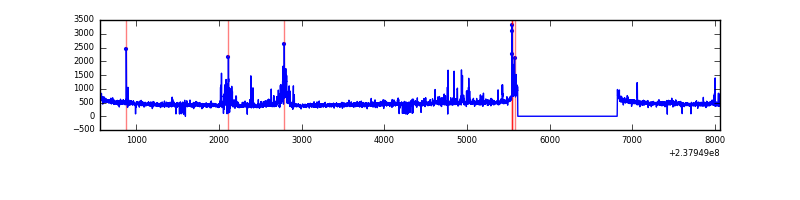 |
Top three noisy pixels from each quadrant. If the there are fewer than three noisy pixels in the level2.evt file, extra rows are filled as -1
| Pixel properties | Quadrant properties | ||||||
|---|---|---|---|---|---|---|---|
| Quadrant | DetID | PixID | Counts | Sigma | Mean | Median | Sigma |
| A | 0 | 226 | 6946 | 40.52 | 760 | 745 | 153.0 |
| A | 12 | 194 | 6005 | 34.37 | 760 | 745 | 153.0 |
| A | 13 | 253 | 3741 | 19.58 | 760 | 745 | 153.0 |
| B | 12 | 111 | 17039 | 111.44 | 766 | 747 | 146.2 |
| B | 11 | 111 | 13659 | 88.32 | 766 | 747 | 146.2 |
| B | 14 | 111 | 11266 | 71.95 | 766 | 747 | 146.2 |
| C | 9 | 237 | 19091 | 108.02 | 733 | 737 | 169.9 |
| C | 14 | 234 | 13358 | 74.28 | 733 | 737 | 169.9 |
| C | 13 | 61 | 5707 | 29.25 | 733 | 737 | 169.9 |
| D | 1 | 52 | 247611 | 1320.67 | 722 | 708 | 187.0 |
| D | 2 | 234 | 19747 | 101.84 | 722 | 708 | 187.0 |
| D | 8 | 195 | 8694 | 42.72 | 722 | 708 | 187.0 |
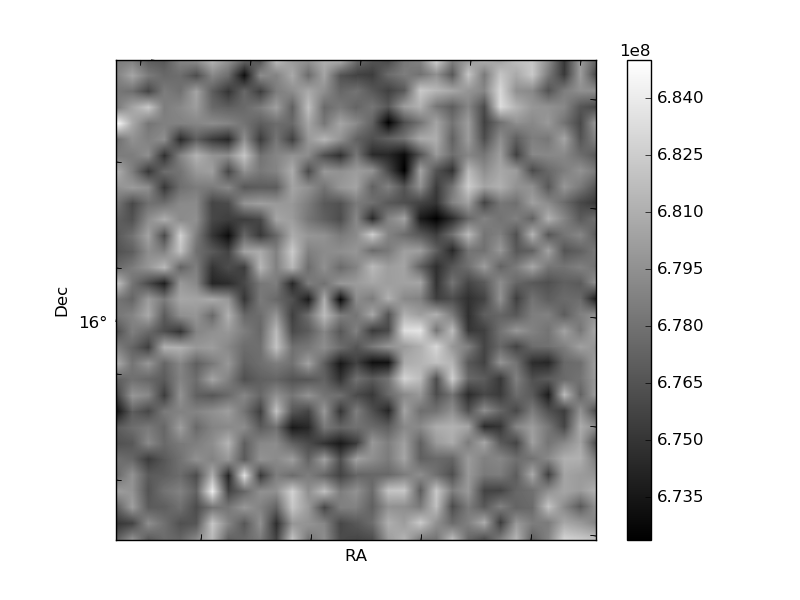
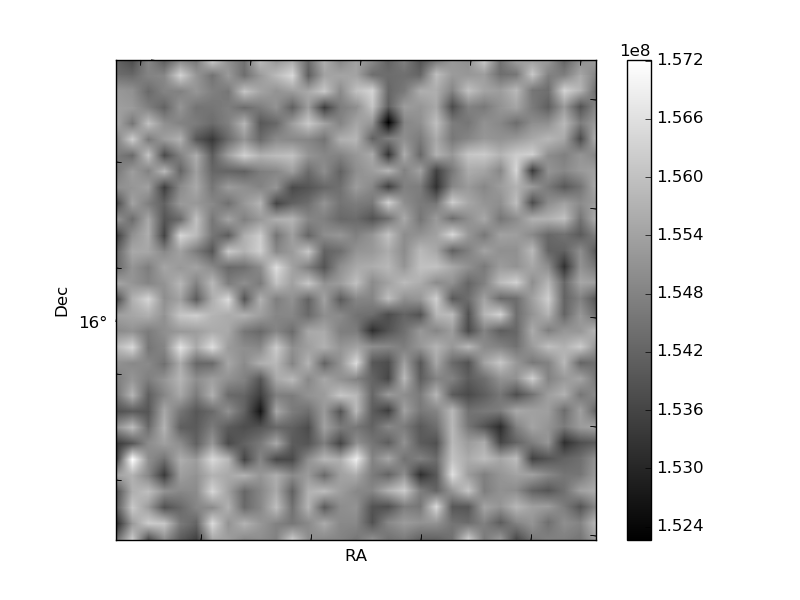
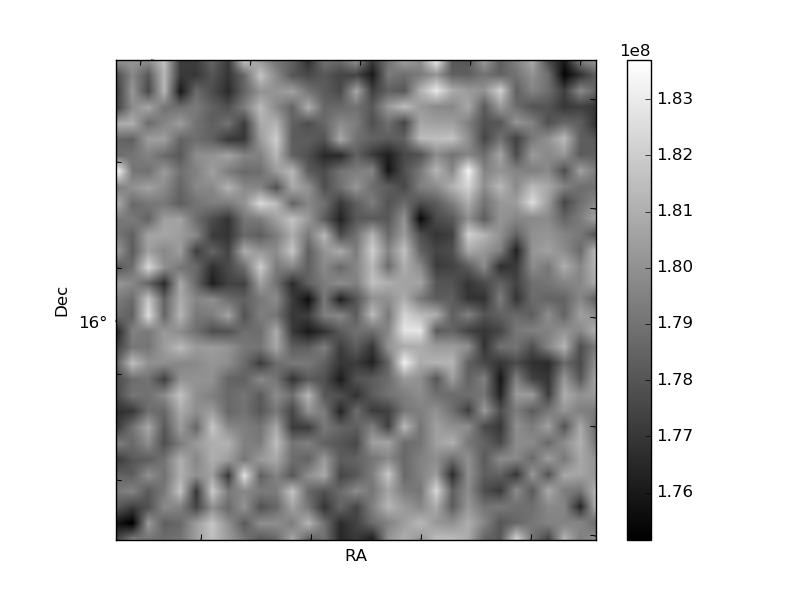
Histogram calculated using DETX and DETY for each event in the final _common_clean file
| Quadrant A | 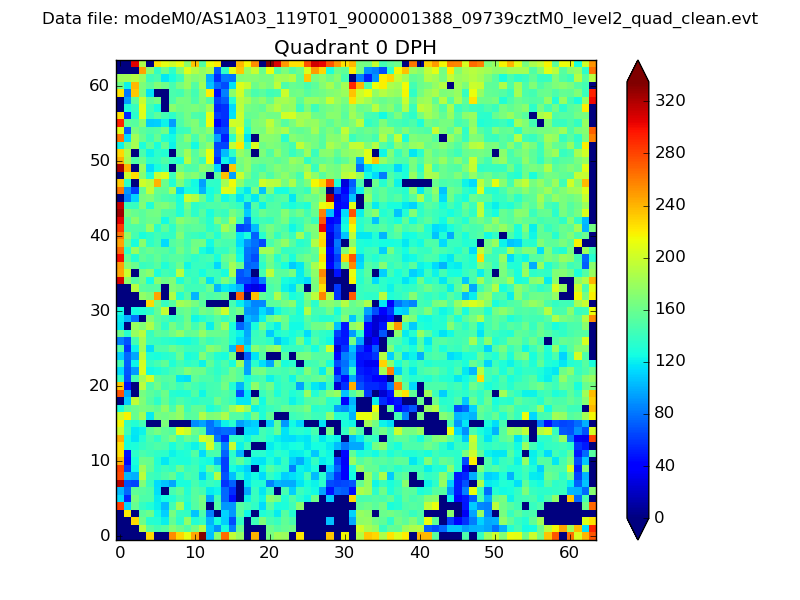 |
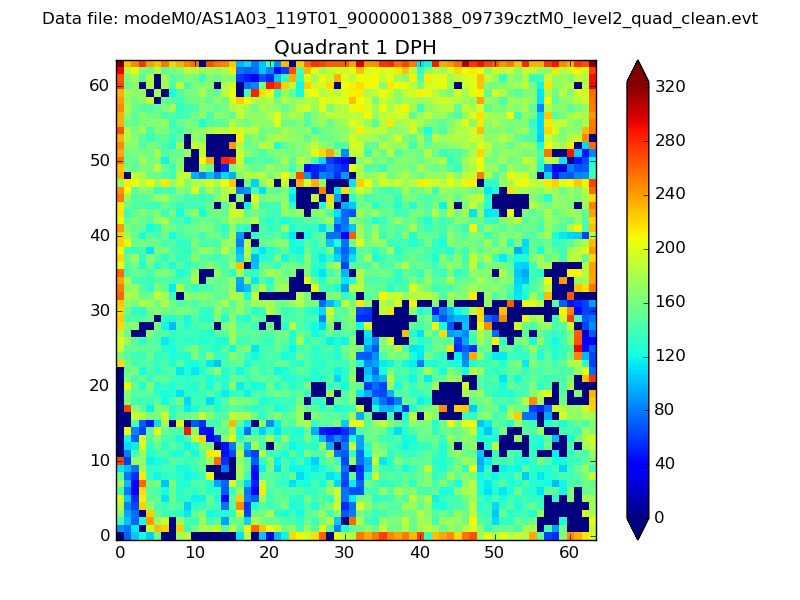 |
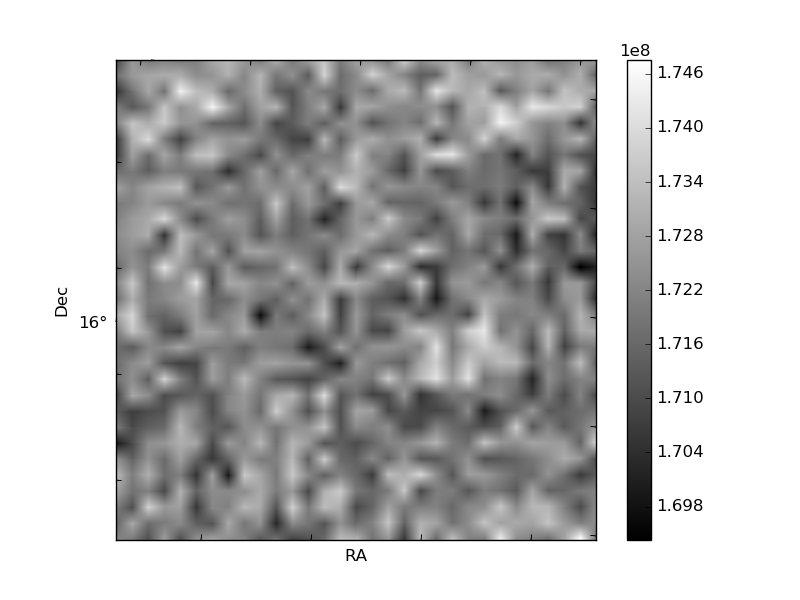
Quadrant B |
|---|---|---|---|
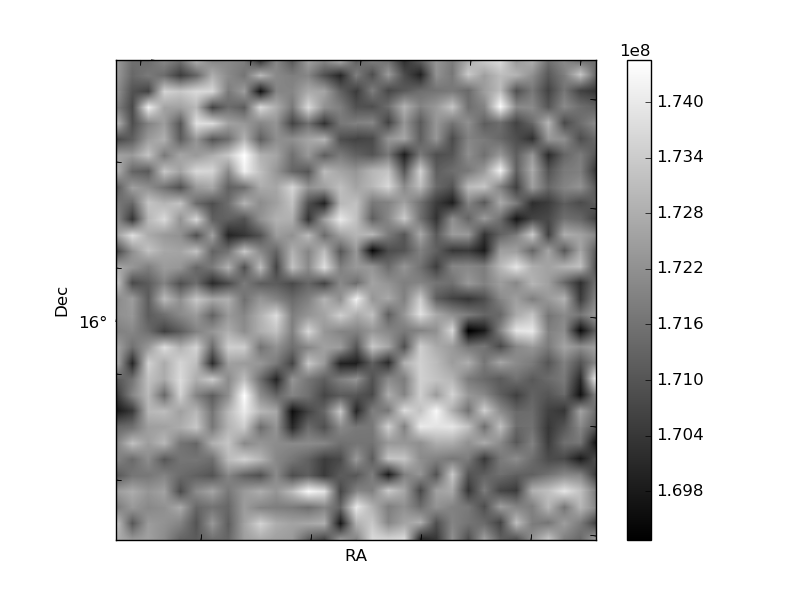
| Quadrant D | 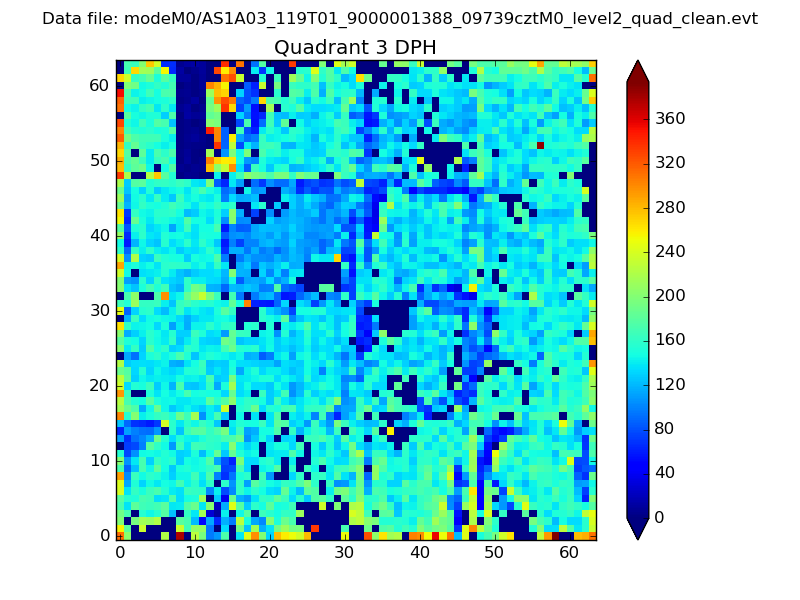 |
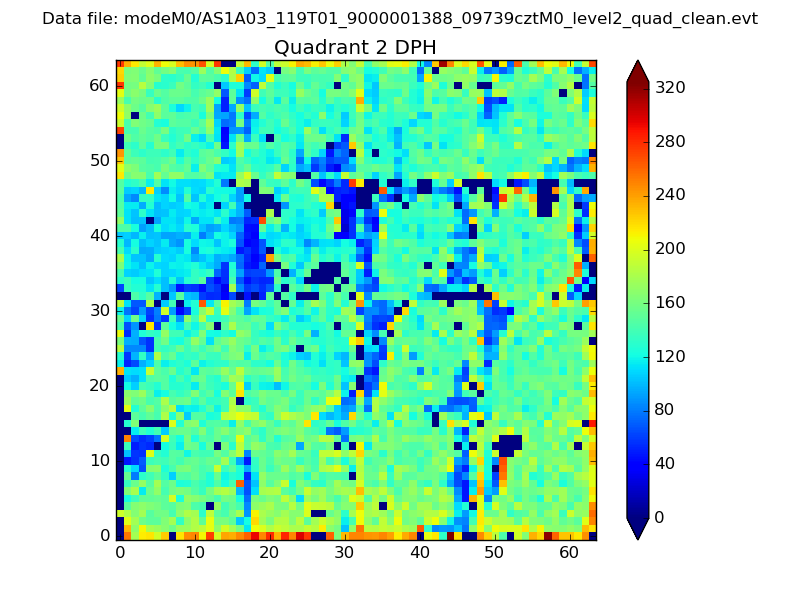 |
Quadrant C |
| Plot type | Count rate plots | Images |
|---|---|---|
| Comparison with Poisson distribution Blue bars denote a histogram of data divided into 1 sec bins. Red curve is a Poisson curve with rate = median count rate of data. |
 |
 |
| Quadrant-wise count rates Data is divided into 100 sec bins |
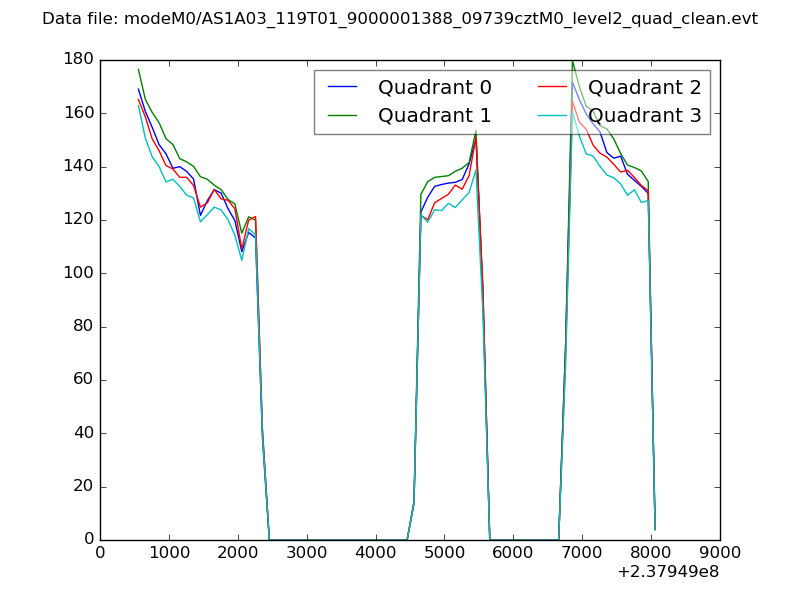 |
|
| Module-wise count rates for Quadrant A Data is divided into 100 sec bins |
 |
 |
| Module-wise count rates for Quadrant B Data is divided into 100 sec bins |
 |
 |
| Module-wise count rates for Quadrant C Data is divided into 100 sec bins |
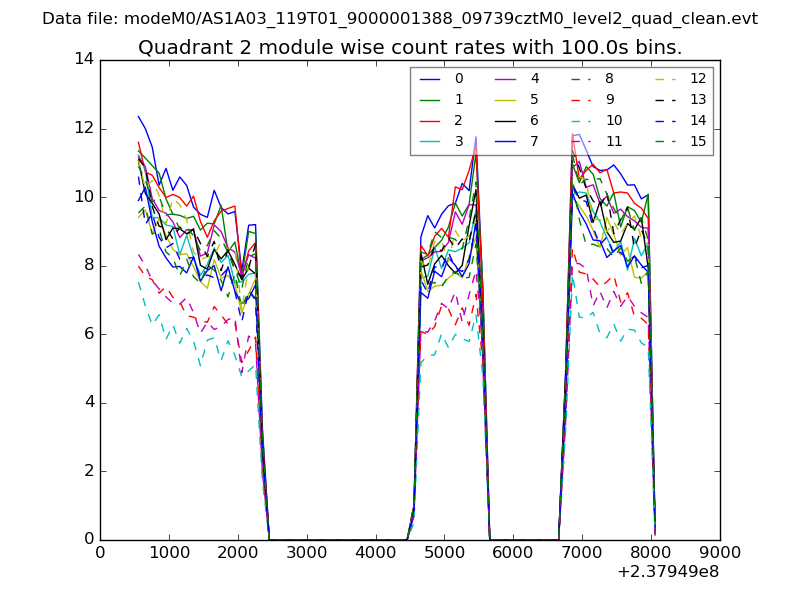 |
 |
| Module-wise count rates for Quadrant D Data is divided into 100 sec bins |
 |
 |
| Parameter | Plot |
|---|---|
| CZT HV Monitor | 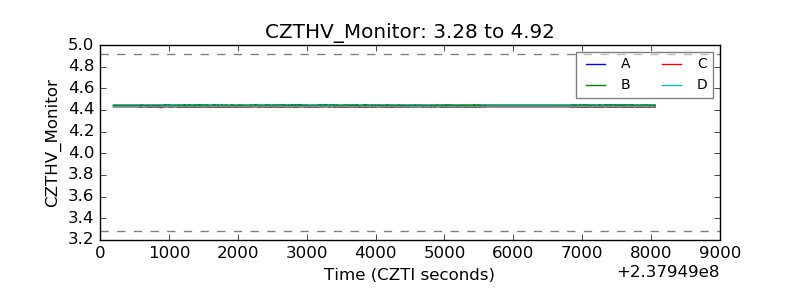 |
| D_VDD | 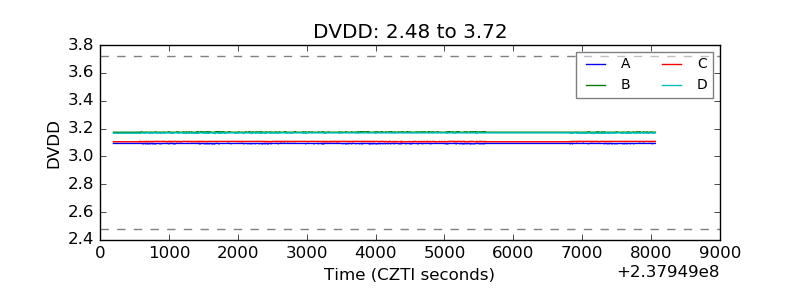 |
| Temperature 1 |  |
| Veto HV Monitor | 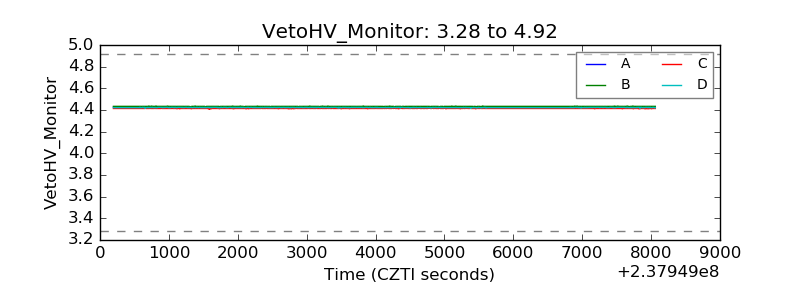 |
| Veto LLD | 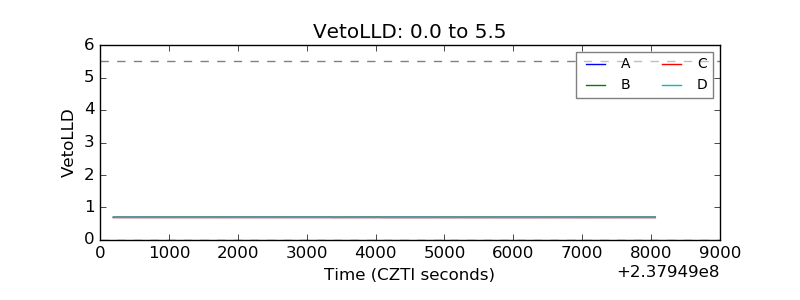 |
| Alpha Counter | 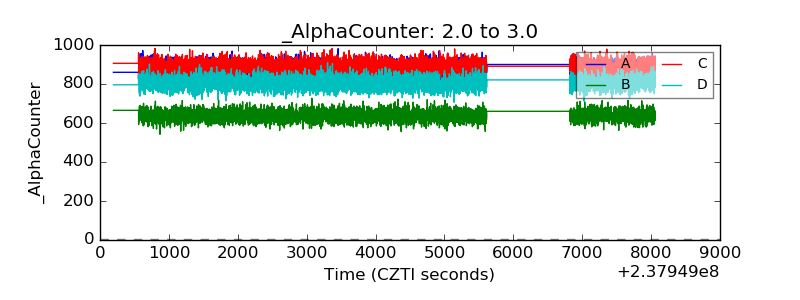 |
| _CPM_Rate | 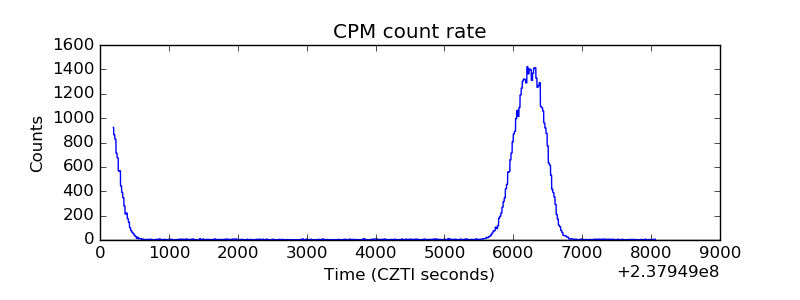 |
| CZT Counter | 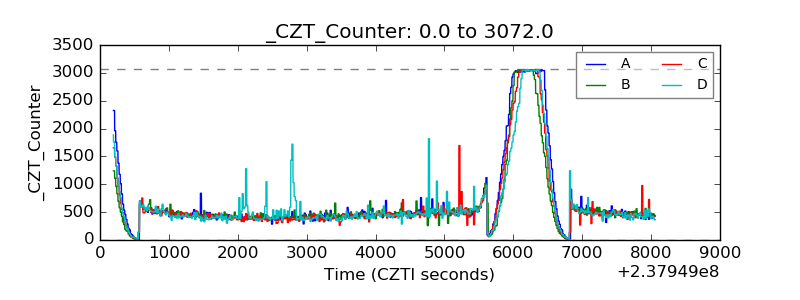 |
| +2.5 Volts monitor |  |
| +5 Volts monitor |  |
| _ROLL_ROT |  |
| _Roll_DEC |  |
| _Roll_RA | 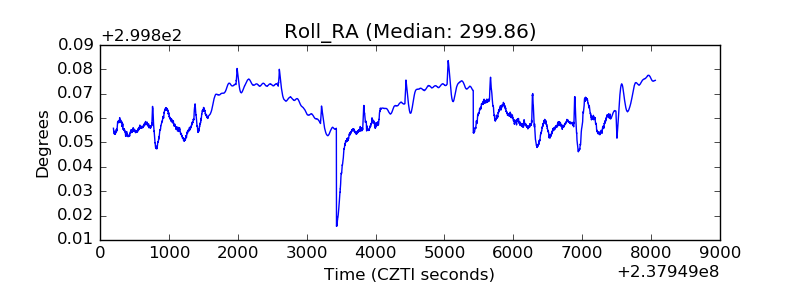 |
| Veto Counter | 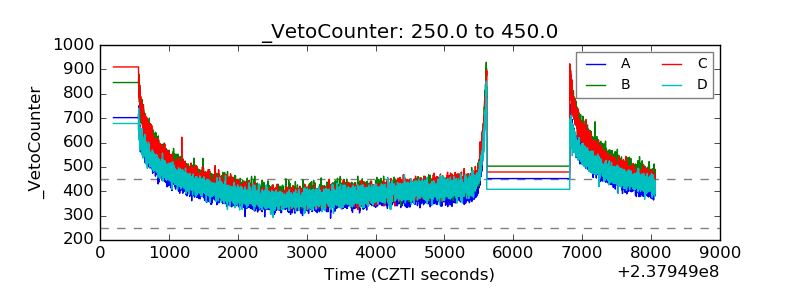 |