| Param | Original file | Final file |
|---|---|---|
| Filename | modeM0/AS1A03_114T01_9000001390cztM0_level2.fits | modeM0/AS1A03_114T01_9000001390cztM0_level2_quad_clean.evt |
| Size (bytes) | 48,052,800 | 38,136,960 |
| Size | 45.8 MB | 36.4 MB |
| Events in quadrant A | 290,264 | 209,469 |
| Events in quadrant B | 284,182 | 213,662 |
| Events in quadrant C | 284,624 | 200,504 |
| Events in quadrant D | 245,202 | 178,939 |
| Mode M0 | |||
|---|---|---|---|
| Quadrant | BADHDUFLAG | Total packets | Discarded packets |
| A | 0 | 10201 | 0 |
| B | 0 | 10258 | 0 |
| C | 0 | 10191 | 0 |
| D | 0 | 10962 | 0 |
| Mode SS | |||
|---|---|---|---|
| Quadrant | BADHDUFLAG | Total packets | Discarded packets |
| A | 0 | 102 | 0 |
| B | 0 | 102 | 0 |
| C | 0 | 102 | 0 |
| D | 0 | 102 | 0 |
| Mode M9 | |||
|---|---|---|---|
| Quadrant | BADHDUFLAG | Total packets | Discarded packets |
| A | 0 | 11 | 0 |
| B | 0 | 11 | 0 |
| C | 0 | 11 | 0 |
| D | 0 | 11 | 0 |
| Quadrant | Total seconds | Saturated seconds | Saturation percentage |
|---|---|---|---|
| A | 5009 | 17 | 0.339389% |
| B | 5009 | 21 | 0.419245% |
| C | 5009 | 15 | 0.299461% |
| D | 5009 | 95 | 1.896586% |
Noise dominated data is calculated using 1-second bins in cleaned event files. If a bin has >2000 counts, and if more than 50% of those come from <1% of pixels, then it is considered to be noise-dominated and hence unusable.
| Quadrant | # 1 sec bins | Bins with >0 counts | Bins with >2000 counts | High rate bins dominated by noise | Noise dominated (total time) | Noise dominated (detector-on time) | Marked lightcurve |
|---|---|---|---|---|---|---|---|
| A | 6104 | 5009 | 0 | 0 | 0.00% | 0.00% |  |
| B | 6104 | 5009 | 0 | 0 | 0.00% | 0.00% |  |
| C | 6104 | 5009 | 0 | 0 | 0.00% | 0.00% |  |
| D | 6104 | 5008 | 0 | 0 | 0.00% | 0.00% |  |
Top three noisy pixels from each quadrant. If the there are fewer than three noisy pixels in the level2.evt file, extra rows are filled as -1
| Pixel properties | Quadrant properties | ||||||
|---|---|---|---|---|---|---|---|
| Quadrant | DetID | PixID | Counts | Sigma | Mean | Median | Sigma |
| A | 0 | 29 | 288 | 10.7 | 75 | 71 | 20.3 |
| A | 14 | 188 | 279 | 10.26 | 75 | 71 | 20.3 |
| A | 7 | 110 | 275 | 10.06 | 75 | 71 | 20.3 |
| B | 2 | 9 | 253 | 10.29 | 74 | 71 | 17.7 |
| B | 5 | 128 | 199 | 7.24 | 74 | 71 | 17.7 |
| B | 14 | 6 | 192 | 6.84 | 74 | 71 | 17.7 |
| C | 12 | 241 | 212 | 6.61 | 75 | 70 | 21.5 |
| C | 1 | 80 | 205 | 6.28 | 75 | 70 | 21.5 |
| C | 2 | 191 | 197 | 5.91 | 75 | 70 | 21.5 |
| D | 3 | 159 | 185 | 6.03 | 69 | 63 | 20.2 |
| D | 3 | 14 | 183 | 5.93 | 69 | 63 | 20.2 |
| D | 1 | 3 | 180 | 5.78 | 69 | 63 | 20.2 |
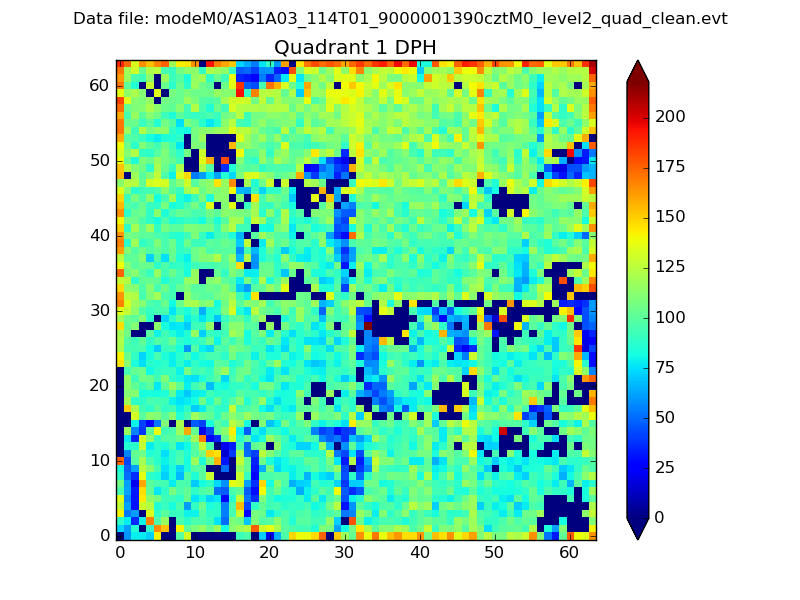
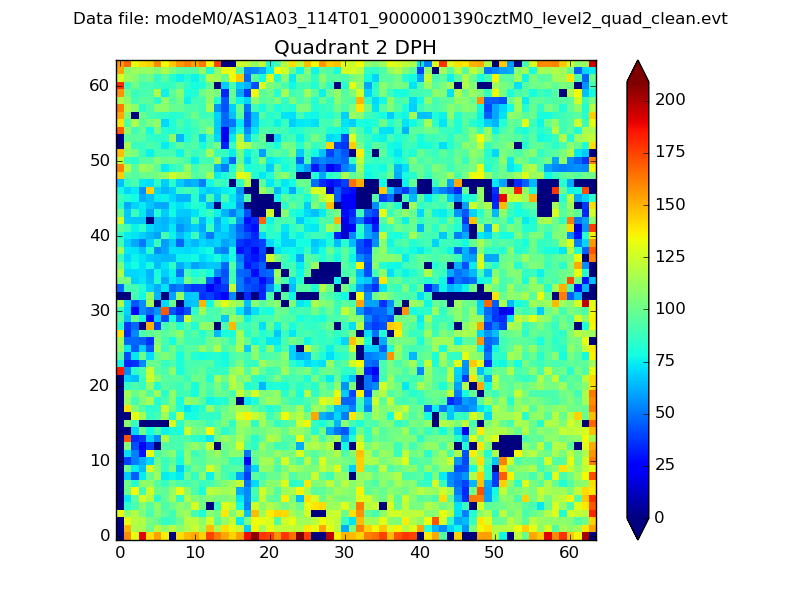
Histogram calculated using DETX and DETY for each event in the final _common_clean file
| Quadrant A |  |
 |
Quadrant B |
|---|---|---|---|
| Quadrant D | 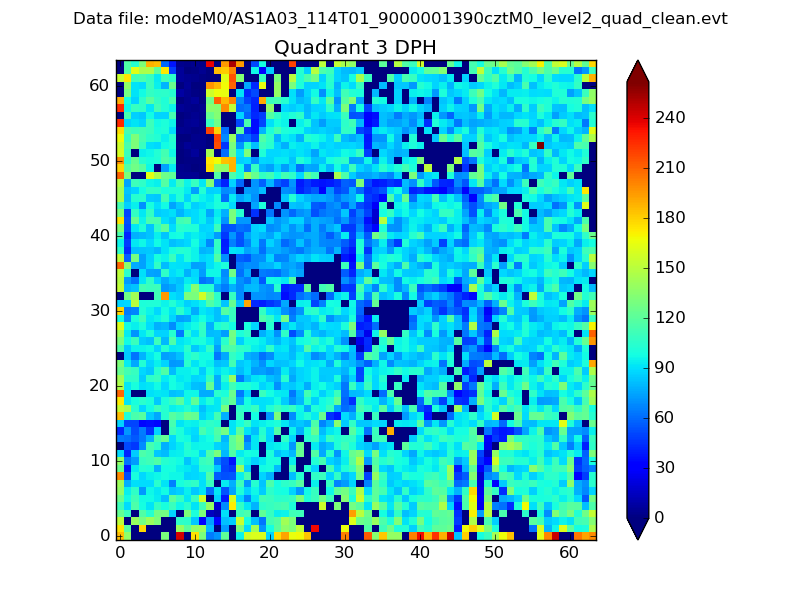 |
 |
Quadrant C |
| Plot type | Count rate plots | Images |
|---|---|---|
| Comparison with Poisson distribution Blue bars denote a histogram of data divided into 1 sec bins. Red curve is a Poisson curve with rate = median count rate of data. |
 |
 |
| Quadrant-wise count rates Data is divided into 100 sec bins |
 |
|
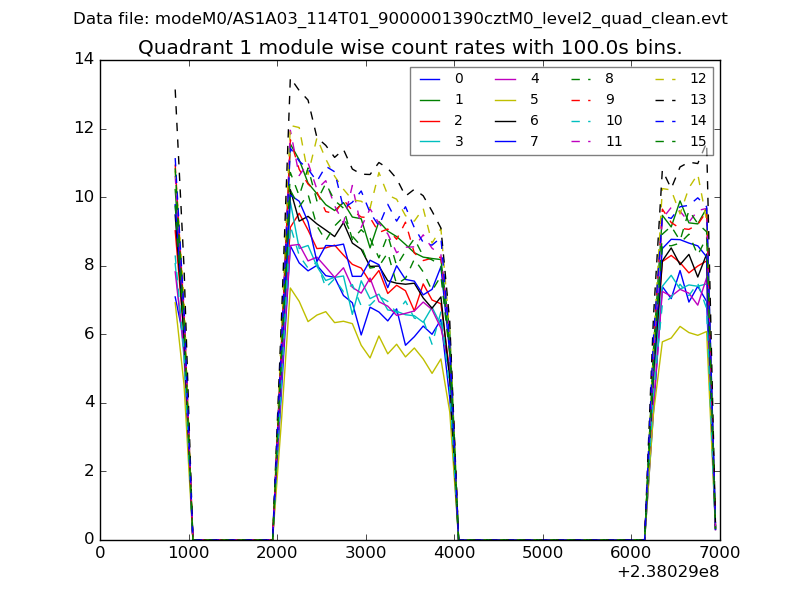
| Module-wise count rates for Quadrant A Data is divided into 100 sec bins |
 |
 |
| Module-wise count rates for Quadrant B Data is divided into 100 sec bins |
 |
 |
| Module-wise count rates for Quadrant C Data is divided into 100 sec bins |
 |
 |
| Module-wise count rates for Quadrant D Data is divided into 100 sec bins |
 |
 |
| Parameter | Plot |
|---|---|
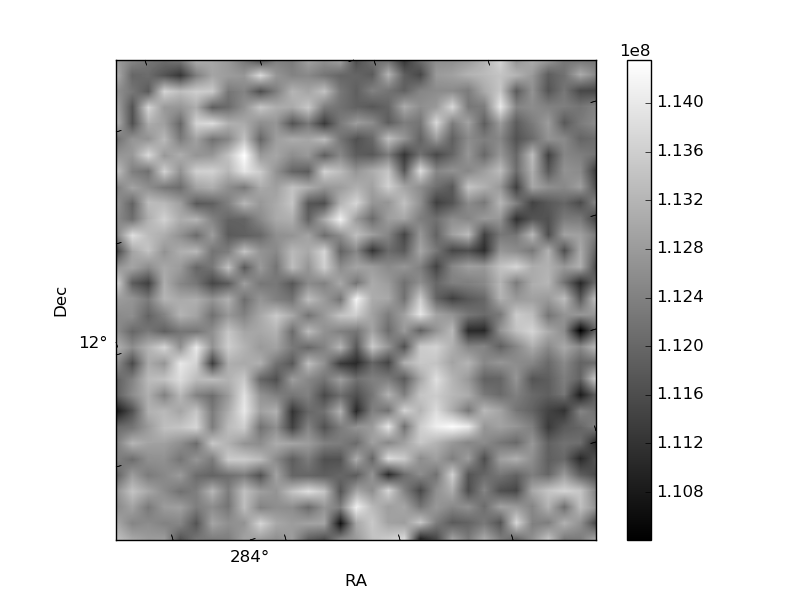
| CZT HV Monitor |  |
| D_VDD | 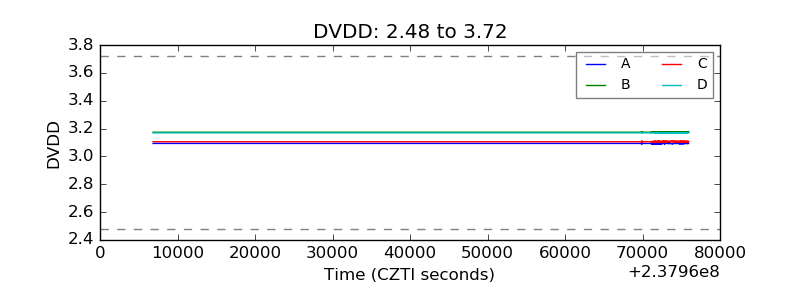 |
| Temperature 1 |  |
| Veto HV Monitor |  |
| Veto LLD |  |
| Alpha Counter | 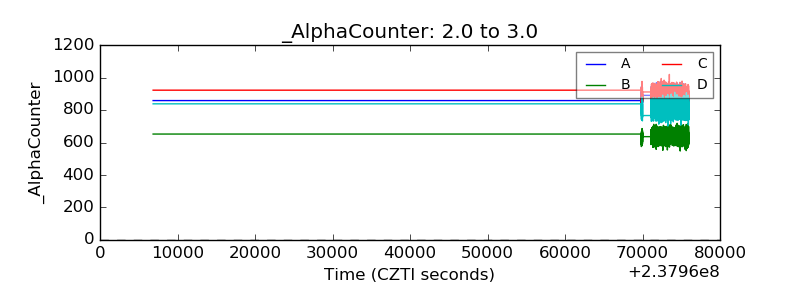 |
| _CPM_Rate | 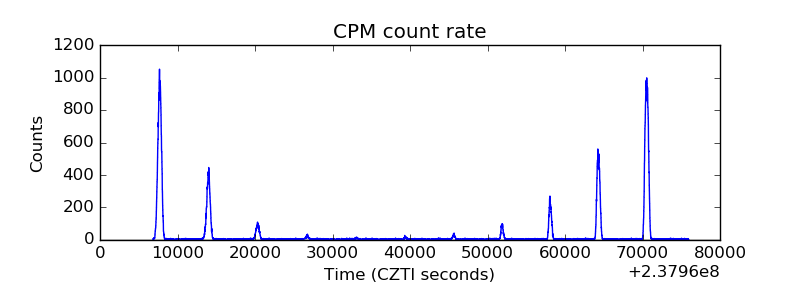 |
| CZT Counter |  |
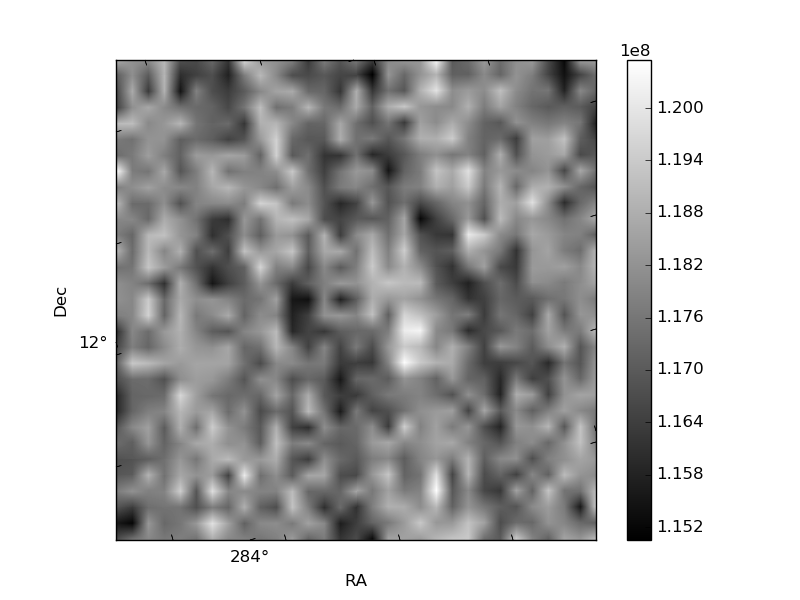
| +2.5 Volts monitor | 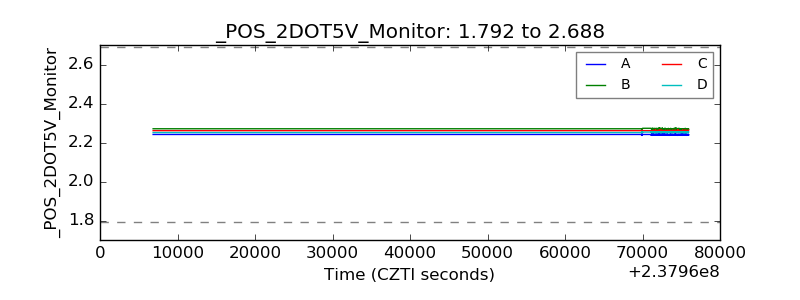 |
| +5 Volts monitor | 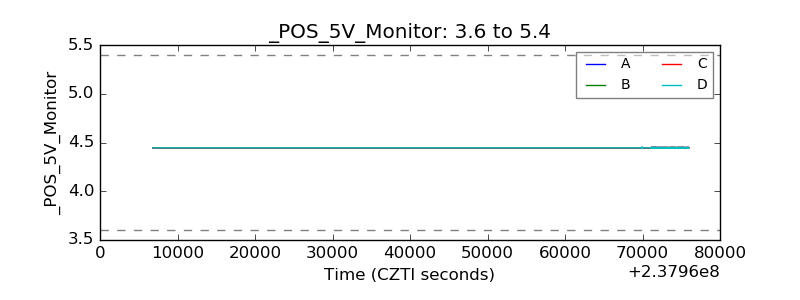 |
| _ROLL_ROT |  |
| _Roll_DEC | 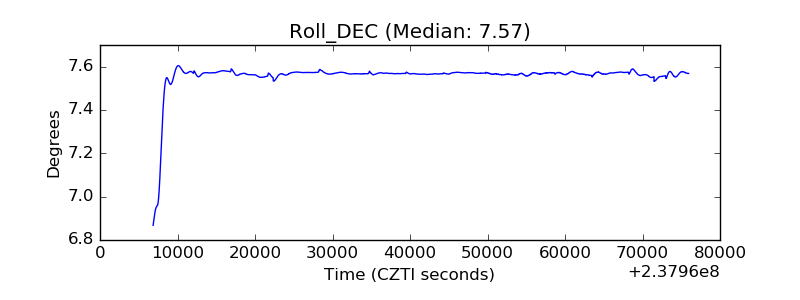 |
| _Roll_RA |  |
| Veto Counter | 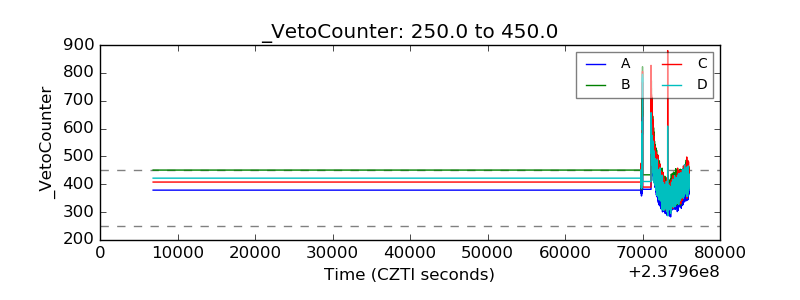 |