| Param | Original file | Final file |
|---|---|---|
| Filename | modeM0/AS1A03_114T01_9000001390_09741cztM0_level2.evt | modeM0/AS1A03_114T01_9000001390_09741cztM0_level2_quad_clean.evt |
| Size (bytes) | 100,733,760 | 14,400,000 |
| Size | 96.1 MB | 13.7 MB |
| Events in quadrant A | 722,009 | 82,813 |
| Events in quadrant B | 724,464 | 86,022 |
| Events in quadrant C | 689,828 | 83,782 |
| Events in quadrant D | 816,762 | 78,954 |
| Mode M0 | |||
|---|---|---|---|
| Quadrant | BADHDUFLAG | Total packets | Discarded packets |
| A | 0 | 3018 | 6 |
| B | 0 | 3003 | 4 |
| C | 0 | 2957 | 1 |
| D | 0 | 3350 | 1 |
| Mode SS | |||
|---|---|---|---|
| Quadrant | BADHDUFLAG | Total packets | Discarded packets |
| A | 0 | 28 | 0 |
| B | 0 | 28 | 0 |
| C | 0 | 28 | 0 |
| D | 0 | 28 | 0 |
| Mode M9 | |||
|---|---|---|---|
| Quadrant | BADHDUFLAG | Total packets | Discarded packets |
| A | 0 | 14 | 0 |
| B | 0 | 14 | 0 |
| C | 0 | 14 | 0 |
| D | 0 | 14 | 0 |
| Quadrant | Total seconds | Saturated seconds | Saturation percentage |
|---|---|---|---|
| A | 1397 | 4 | 0.286328% |
| B | 1398 | 12 | 0.858369% |
| C | 1399 | 2 | 0.142959% |
| D | 1399 | 21 | 1.501072% |
Noise dominated data is calculated using 1-second bins in cleaned event files. If a bin has >2000 counts, and if more than 50% of those come from <1% of pixels, then it is considered to be noise-dominated and hence unusable.
| Quadrant | # 1 sec bins | Bins with >0 counts | Bins with >2000 counts | High rate bins dominated by noise | Noise dominated (total time) | Noise dominated (detector-on time) | Marked lightcurve |
|---|---|---|---|---|---|---|---|
| A | 2724 | 1400 | 0 | 0 | 0.00% | 0.00% | 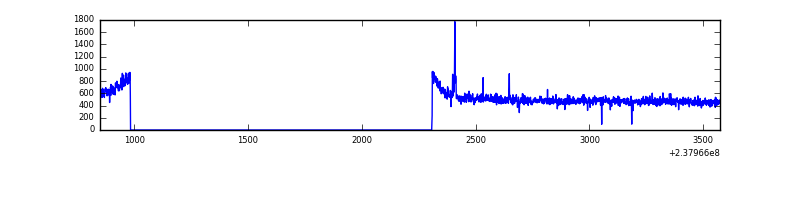 |
| B | 2724 | 1400 | 0 | 0 | 0.00% | 0.00% | 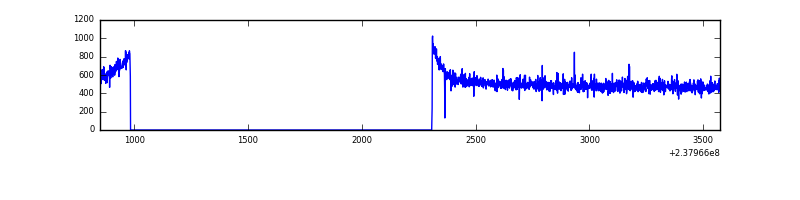 |
| C | 2724 | 1400 | 0 | 0 | 0.00% | 0.00% | 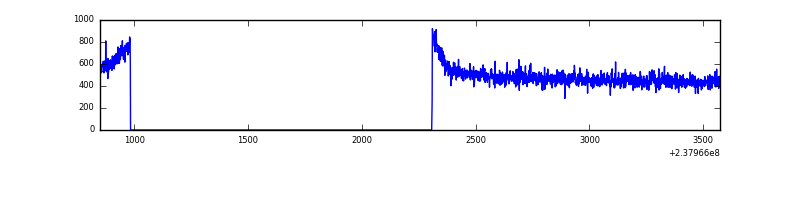 |
| D | 2724 | 1400 | 15 | 15 | 0.55% | 1.07% | 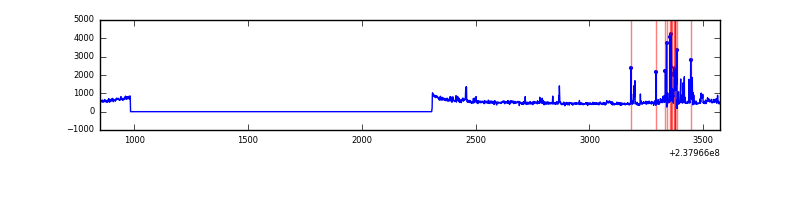 |
Top three noisy pixels from each quadrant. If the there are fewer than three noisy pixels in the level2.evt file, extra rows are filled as -1
| Pixel properties | Quadrant properties | ||||||
|---|---|---|---|---|---|---|---|
| Quadrant | DetID | PixID | Counts | Sigma | Mean | Median | Sigma |
| A | 15 | 239 | 6631 | 165.6 | 183 | 179 | 39.0 |
| A | 1 | 162 | 3125 | 75.61 | 183 | 179 | 39.0 |
| A | 0 | 226 | 1667 | 38.19 | 183 | 179 | 39.0 |
| B | 12 | 111 | 4039 | 102.2 | 186 | 182 | 37.7 |
| B | 11 | 111 | 3386 | 84.9 | 186 | 182 | 37.7 |
| B | 14 | 111 | 2888 | 71.7 | 186 | 182 | 37.7 |
| C | 13 | 61 | 1395 | 28.35 | 176 | 178 | 42.9 |
| C | 8 | 222 | 733 | 12.93 | 176 | 178 | 42.9 |
| C | -1 | -1 | -1 | -1.0 | 176 | 178 | 42.9 |
| D | 1 | 52 | 132114 | 2864.67 | 171 | 167 | 46.1 |
| D | 13 | 104 | 11181 | 239.12 | 171 | 167 | 46.1 |
| D | 8 | 195 | 5183 | 108.9 | 171 | 167 | 46.1 |
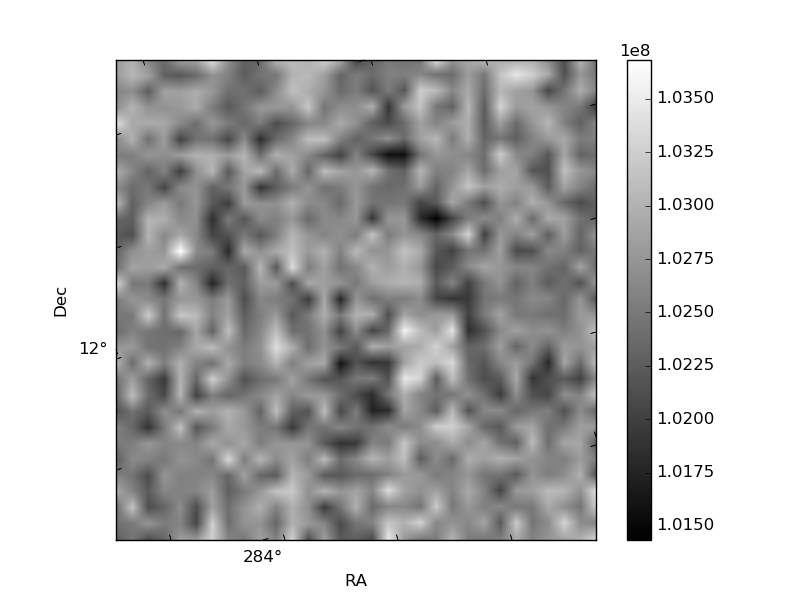
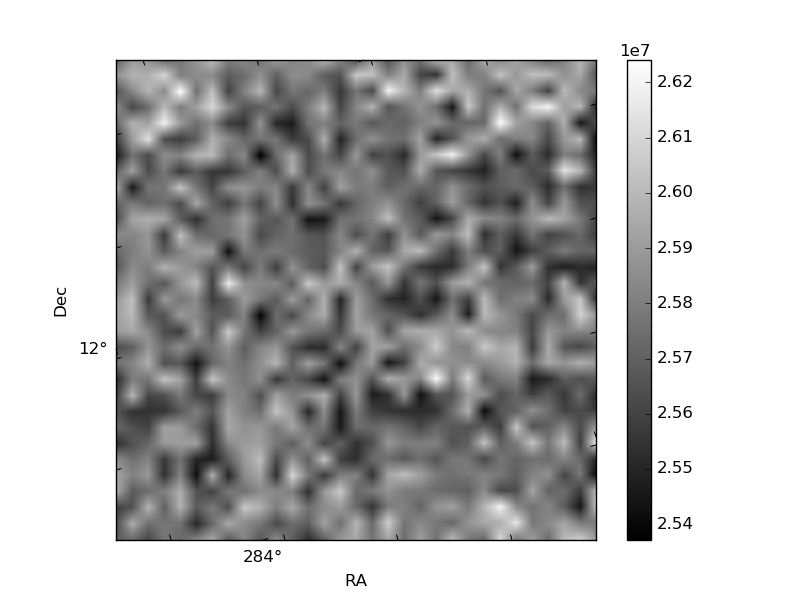
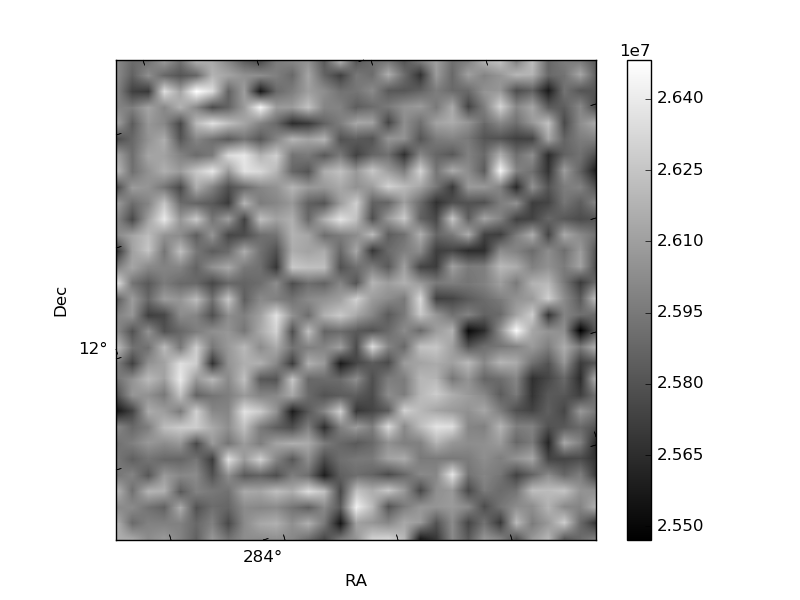
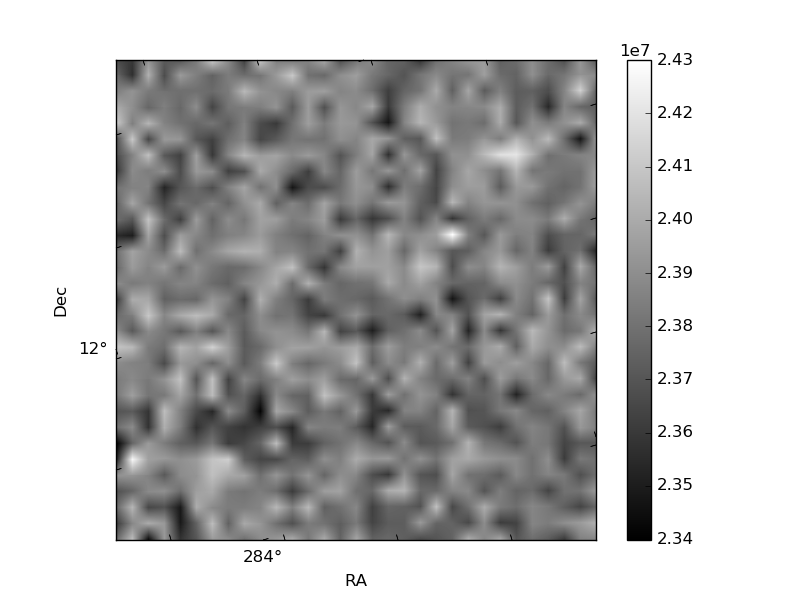
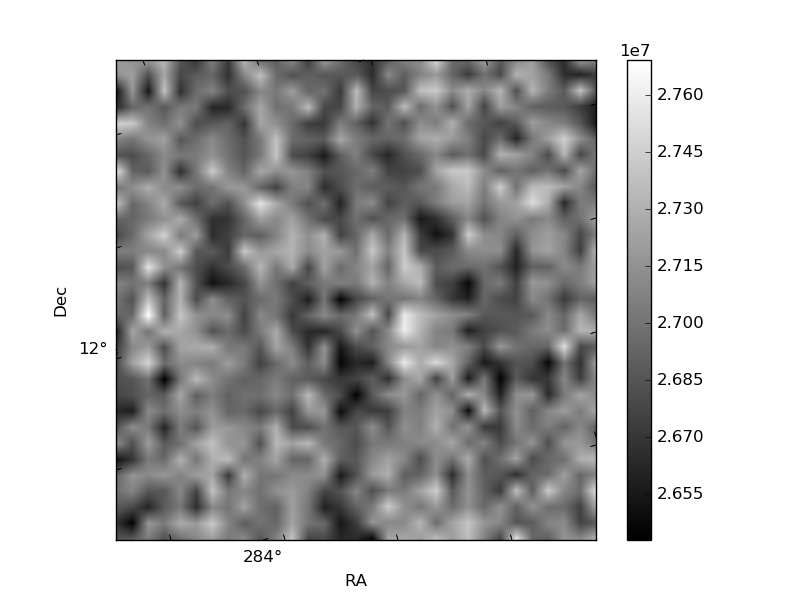
Histogram calculated using DETX and DETY for each event in the final _common_clean file
| Quadrant A | 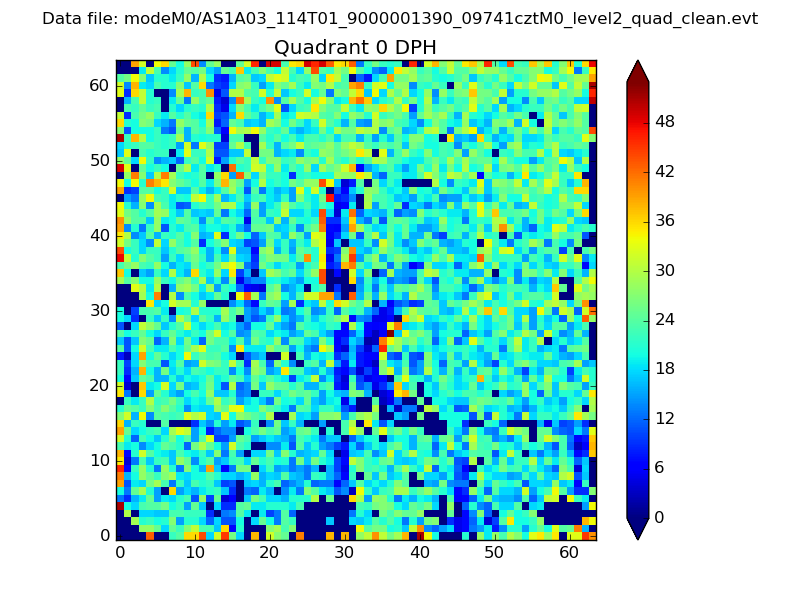 |
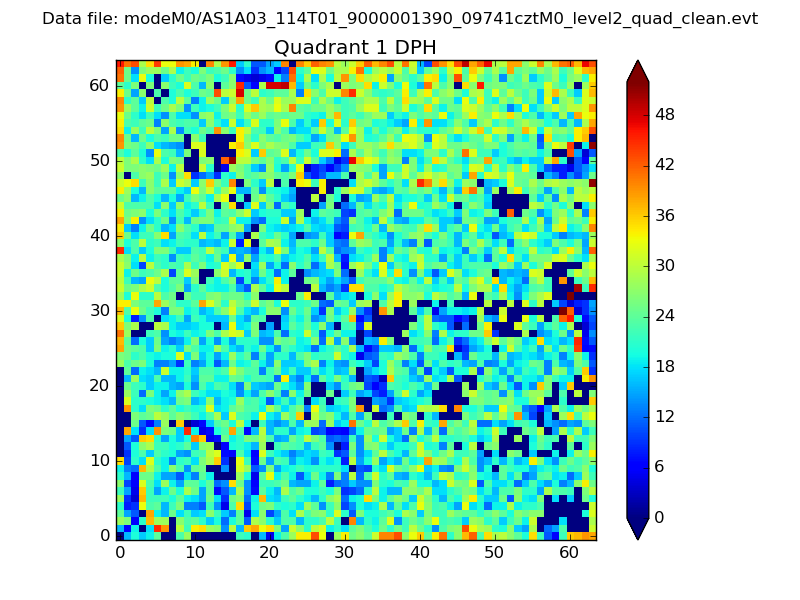 |
Quadrant B |
|---|---|---|---|
| Quadrant D | 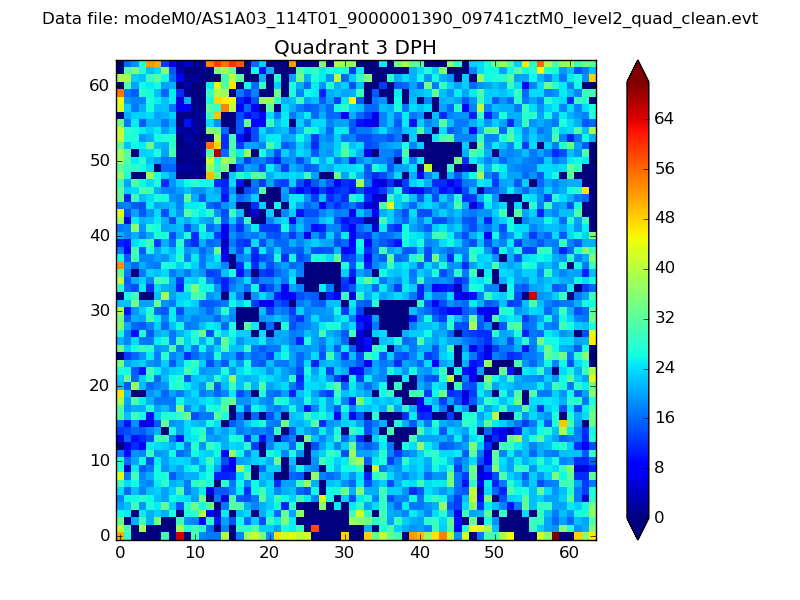 |
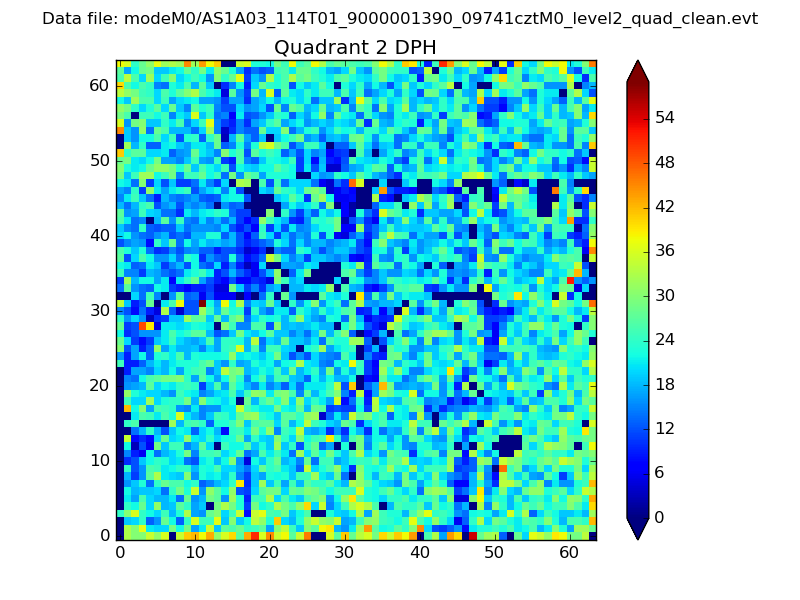 |
Quadrant C |
| Plot type | Count rate plots | Images |
|---|---|---|
| Comparison with Poisson distribution Blue bars denote a histogram of data divided into 1 sec bins. Red curve is a Poisson curve with rate = median count rate of data. |
 |
 |
| Quadrant-wise count rates Data is divided into 100 sec bins |
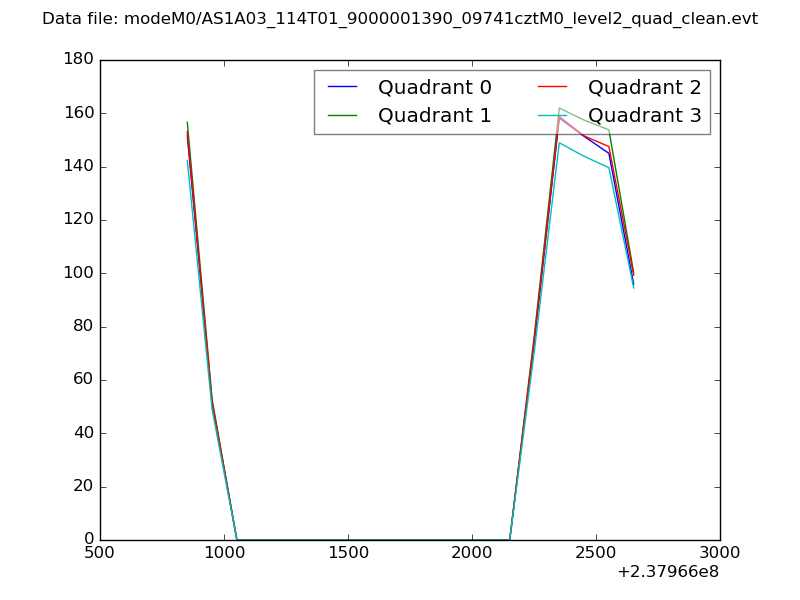 |
|
| Module-wise count rates for Quadrant A Data is divided into 100 sec bins |
 |
 |
| Module-wise count rates for Quadrant B Data is divided into 100 sec bins |
 |
 |
| Module-wise count rates for Quadrant C Data is divided into 100 sec bins |
 |
 |
| Module-wise count rates for Quadrant D Data is divided into 100 sec bins |
 |
 |
| Parameter | Plot |
|---|---|
| CZT HV Monitor |  |
| D_VDD |  |
| Temperature 1 | 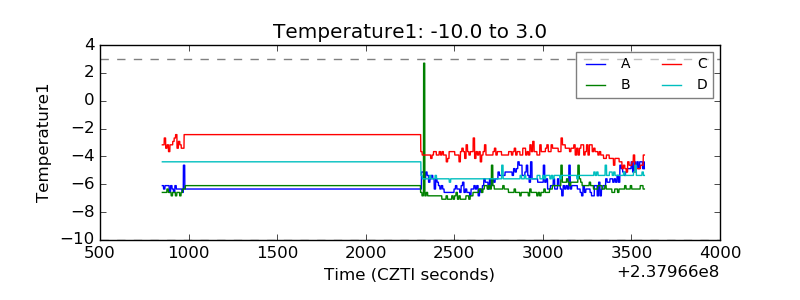 |
| Veto HV Monitor | 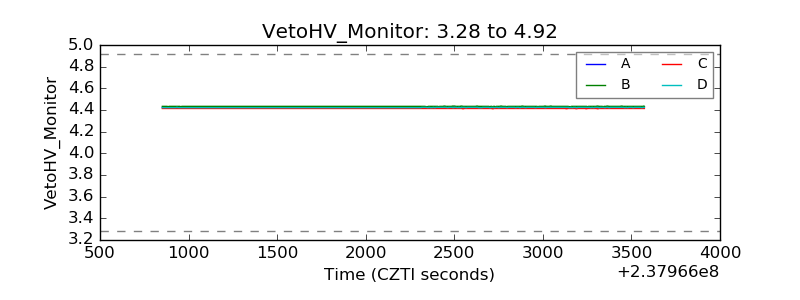 |
| Veto LLD |  |
| Alpha Counter | 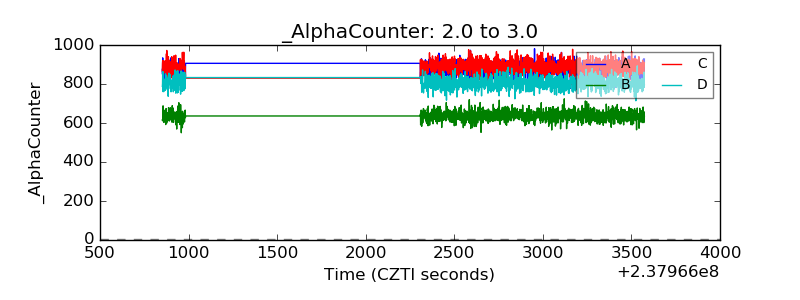 |
| _CPM_Rate | 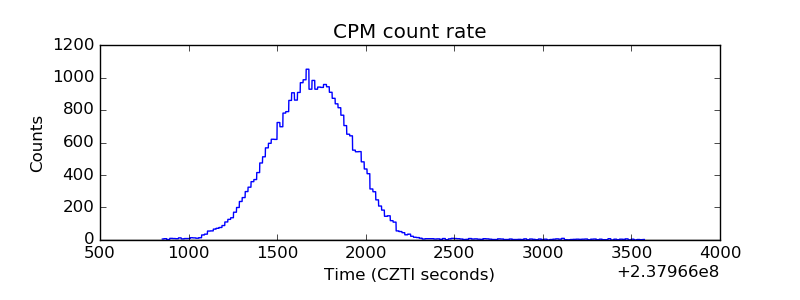 |
| CZT Counter | 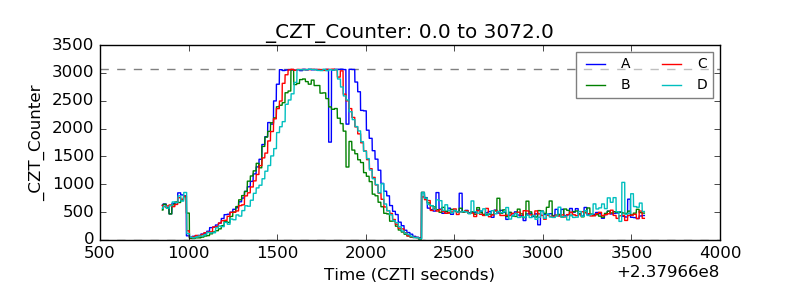 |
| +2.5 Volts monitor |  |
| +5 Volts monitor | 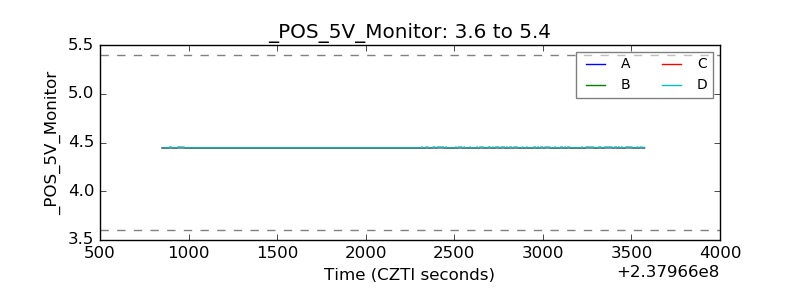 |
| _ROLL_ROT |  |
| _Roll_DEC | 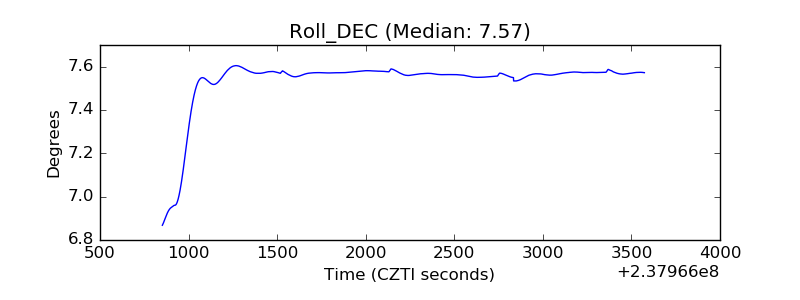 |
| _Roll_RA | 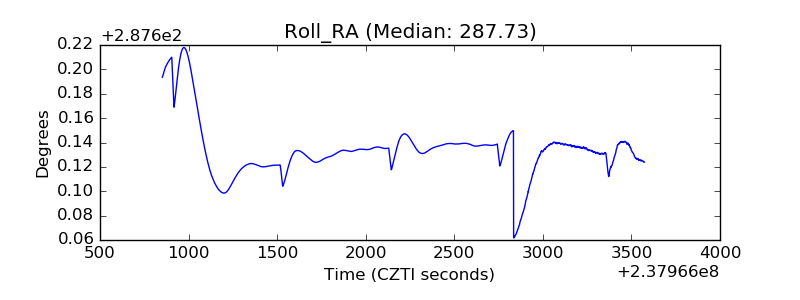 |
| Veto Counter |  |