| Param | Original file | Final file |
|---|---|---|
| Filename | modeM0/AS1A03_114T01_9000001390_09743cztM0_level2.evt | modeM0/AS1A03_114T01_9000001390_09743cztM0_level2_quad_clean.evt |
| Size (bytes) | 727,885,440 | 119,148,480 |
| Size | 694.2 MB | 113.6 MB |
| Events in quadrant A | 5,240,392 | 718,196 |
| Events in quadrant B | 5,279,551 | 736,152 |
| Events in quadrant C | 5,131,281 | 713,130 |
| Events in quadrant D | 5,646,545 | 678,644 |
| Mode M0 | |||
|---|---|---|---|
| Quadrant | BADHDUFLAG | Total packets | Discarded packets |
| A | 0 | 22795 | 41 |
| B | 0 | 22766 | 64 |
| C | 0 | 22770 | 44 |
| D | 0 | 24472 | 63 |
| Mode SS | |||
|---|---|---|---|
| Quadrant | BADHDUFLAG | Total packets | Discarded packets |
| A | 0 | 226 | 2 |
| B | 0 | 226 | 0 |
| C | 0 | 226 | 0 |
| D | 0 | 226 | 0 |
| Mode M9 | |||
|---|---|---|---|
| Quadrant | BADHDUFLAG | Total packets | Discarded packets |
| A | 0 | 20 | 0 |
| B | 0 | 20 | 0 |
| C | 0 | 20 | 0 |
| D | 0 | 20 | 0 |
| Quadrant | Total seconds | Saturated seconds | Saturation percentage |
|---|---|---|---|
| A | 11005 | 189 | 1.717401% |
| B | 10994 | 229 | 2.082954% |
| C | 11003 | 133 | 1.208761% |
| D | 11000 | 287 | 2.609091% |
Noise dominated data is calculated using 1-second bins in cleaned event files. If a bin has >2000 counts, and if more than 50% of those come from <1% of pixels, then it is considered to be noise-dominated and hence unusable.
| Quadrant | # 1 sec bins | Bins with >0 counts | Bins with >2000 counts | High rate bins dominated by noise | Noise dominated (total time) | Noise dominated (detector-on time) | Marked lightcurve |
|---|---|---|---|---|---|---|---|
| A | 13064 | 11022 | 0 | 0 | 0.00% | 0.00% | 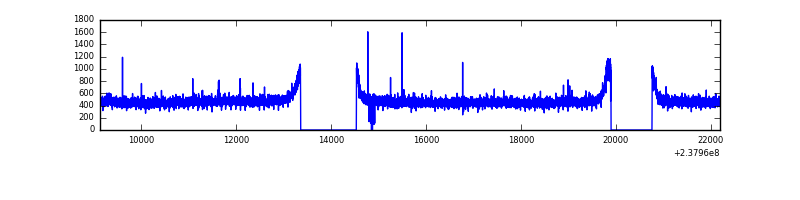 |
| B | 13064 | 11022 | 0 | 0 | 0.00% | 0.00% | 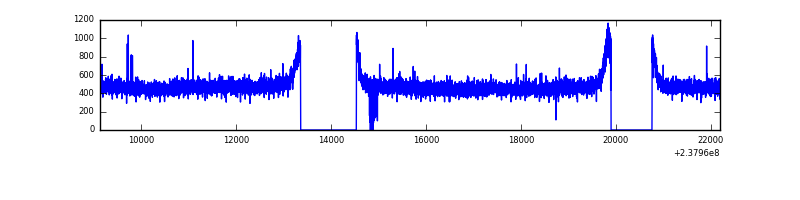 |
| C | 13064 | 11022 | 0 | 0 | 0.00% | 0.00% | 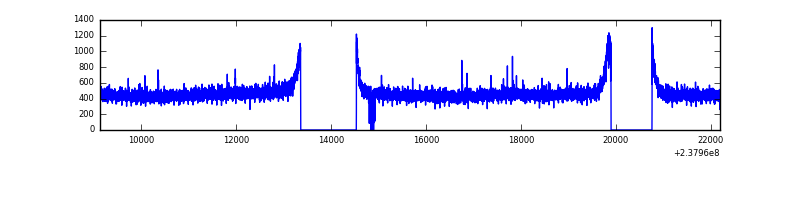 |
| D | 13064 | 11021 | 121 | 121 | 0.93% | 1.10% | 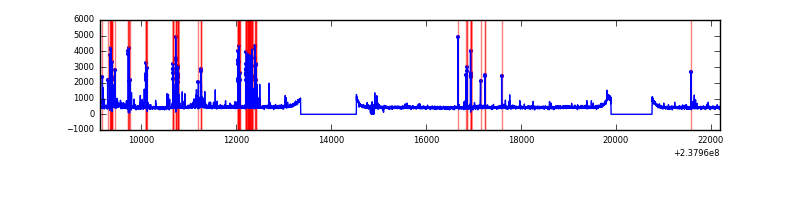 |
Top three noisy pixels from each quadrant. If the there are fewer than three noisy pixels in the level2.evt file, extra rows are filled as -1
| Pixel properties | Quadrant properties | ||||||
|---|---|---|---|---|---|---|---|
| Quadrant | DetID | PixID | Counts | Sigma | Mean | Median | Sigma |
| A | 0 | 226 | 12439 | 40.43 | 1357 | 1330 | 274.7 |
| A | 14 | 111 | 10988 | 35.15 | 1357 | 1330 | 274.7 |
| A | 12 | 194 | 10672 | 34.0 | 1357 | 1330 | 274.7 |
| B | 12 | 111 | 31262 | 115.35 | 1354 | 1323 | 259.5 |
| B | 11 | 111 | 25731 | 94.04 | 1354 | 1323 | 259.5 |
| B | 14 | 111 | 21243 | 76.75 | 1354 | 1323 | 259.5 |
| C | 13 | 61 | 9749 | 27.71 | 1312 | 1323 | 304.1 |
| C | 14 | 234 | 6296 | 16.35 | 1312 | 1323 | 304.1 |
| C | 8 | 222 | 6112 | 15.75 | 1312 | 1323 | 304.1 |
| D | 1 | 52 | 534818 | 1596.01 | 1288 | 1263 | 334.3 |
| D | 13 | 104 | 74451 | 218.93 | 1288 | 1263 | 334.3 |
| D | 13 | 137 | 56861 | 166.31 | 1288 | 1263 | 334.3 |
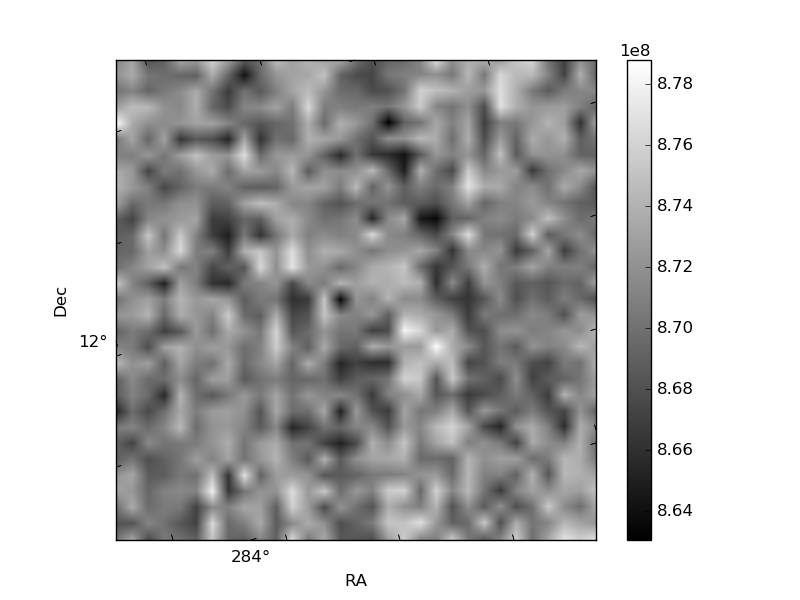
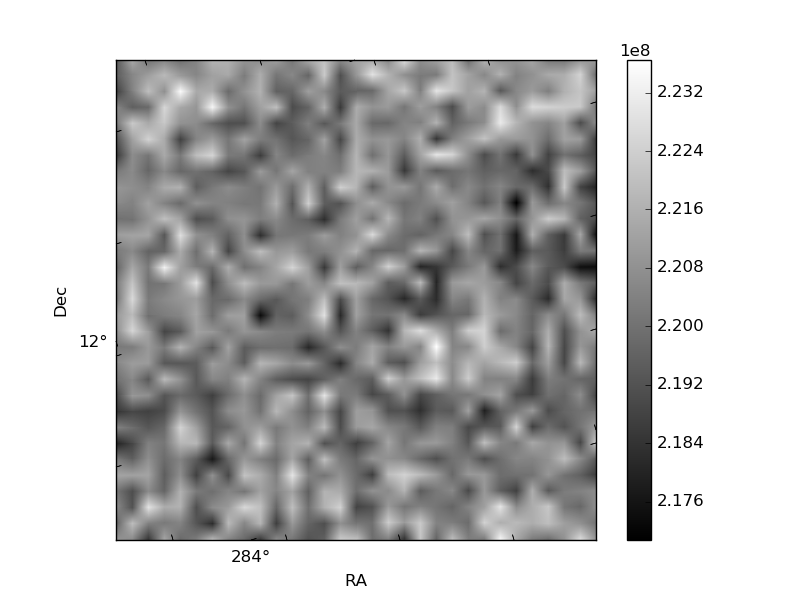
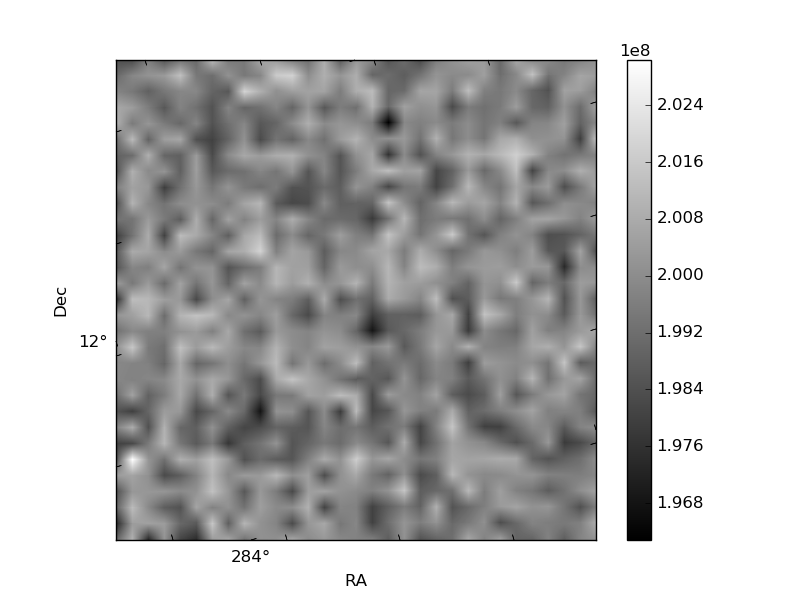
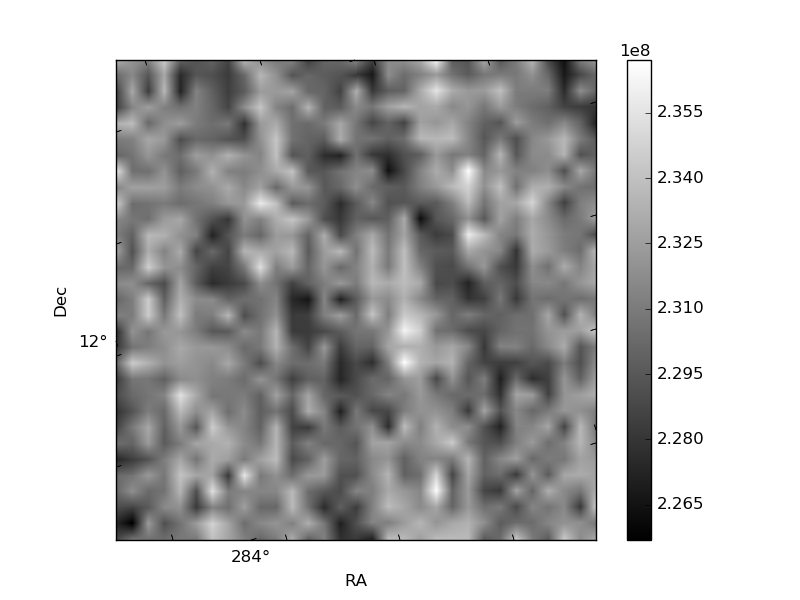
Histogram calculated using DETX and DETY for each event in the final _common_clean file
| Quadrant A | 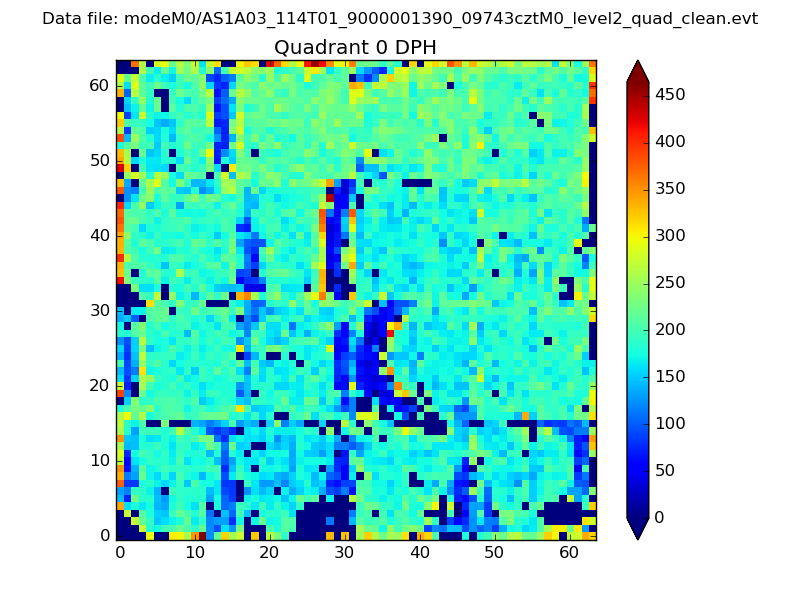 |
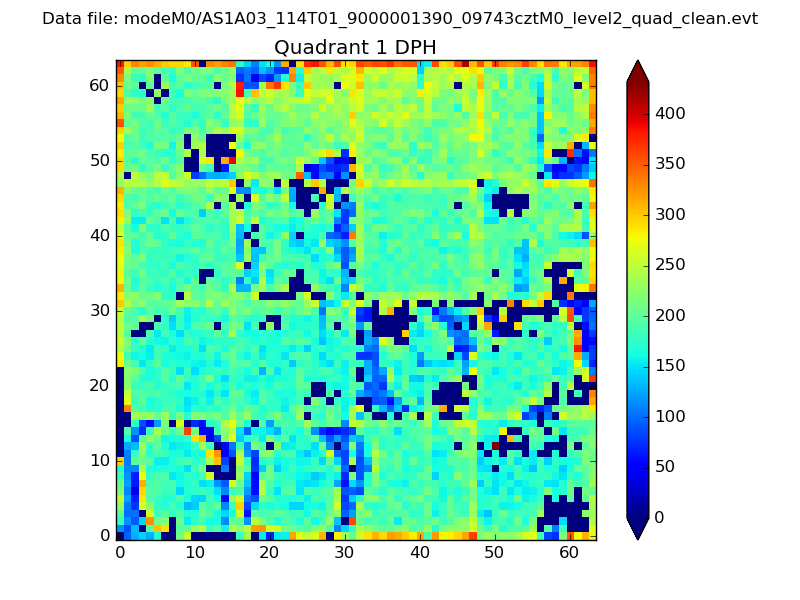 |
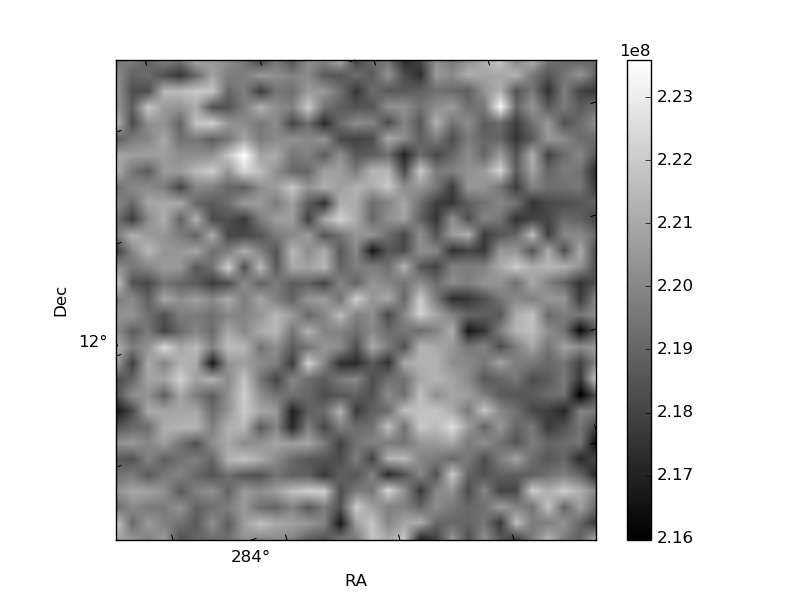
Quadrant B |
|---|---|---|---|
| Quadrant D | 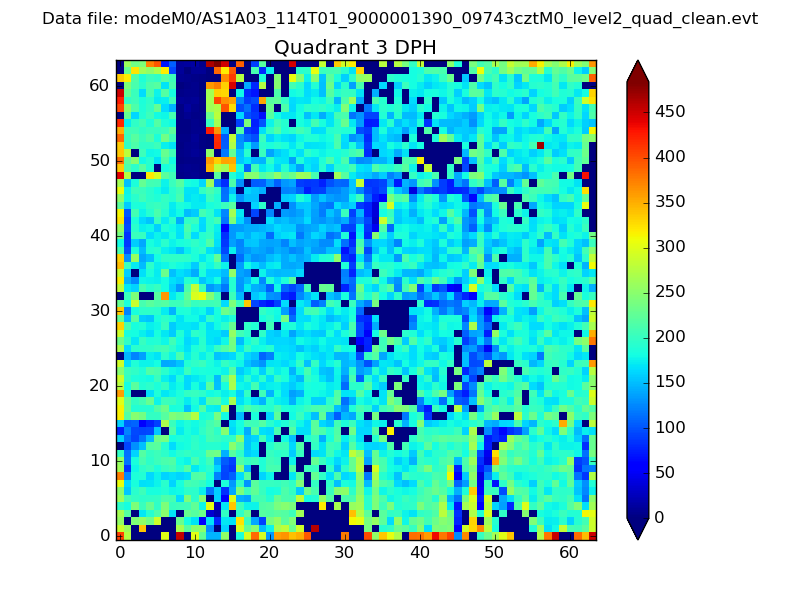 |
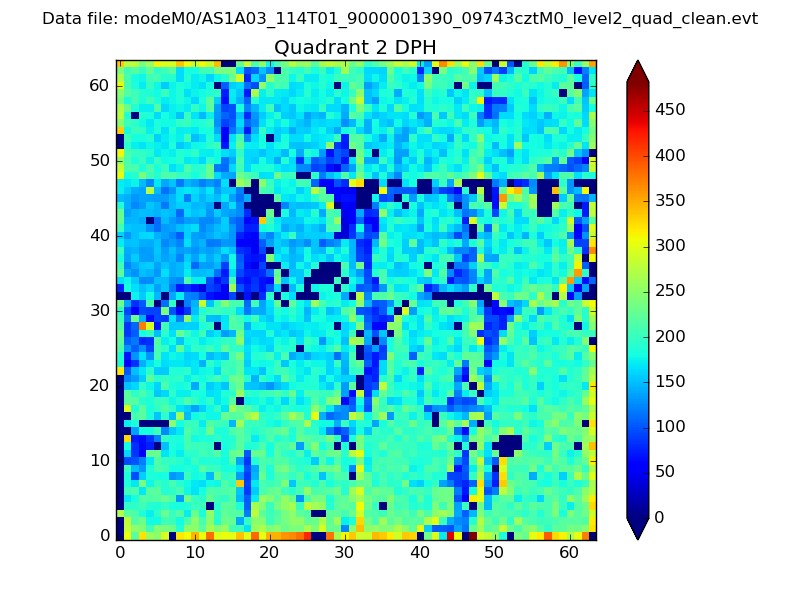 |
Quadrant C |
| Plot type | Count rate plots | Images |
|---|---|---|
| Comparison with Poisson distribution Blue bars denote a histogram of data divided into 1 sec bins. Red curve is a Poisson curve with rate = median count rate of data. |
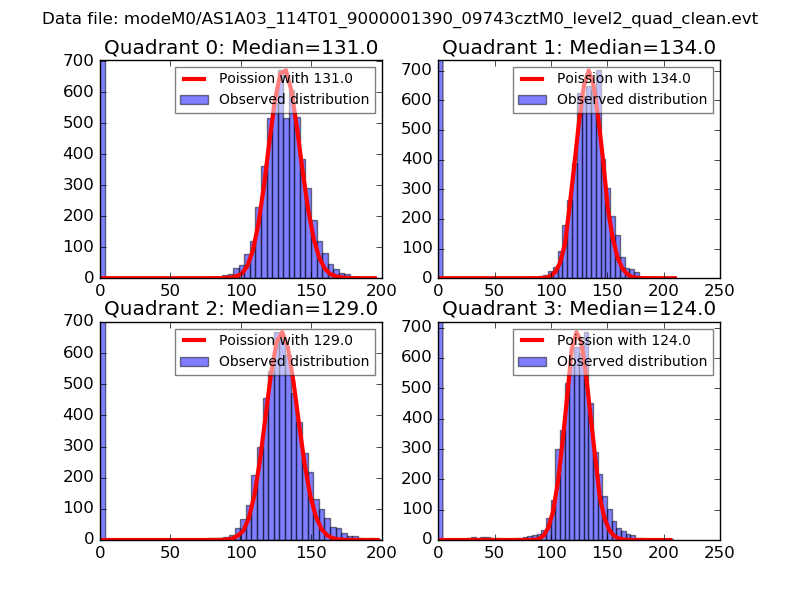 |
 |
| Quadrant-wise count rates Data is divided into 100 sec bins |
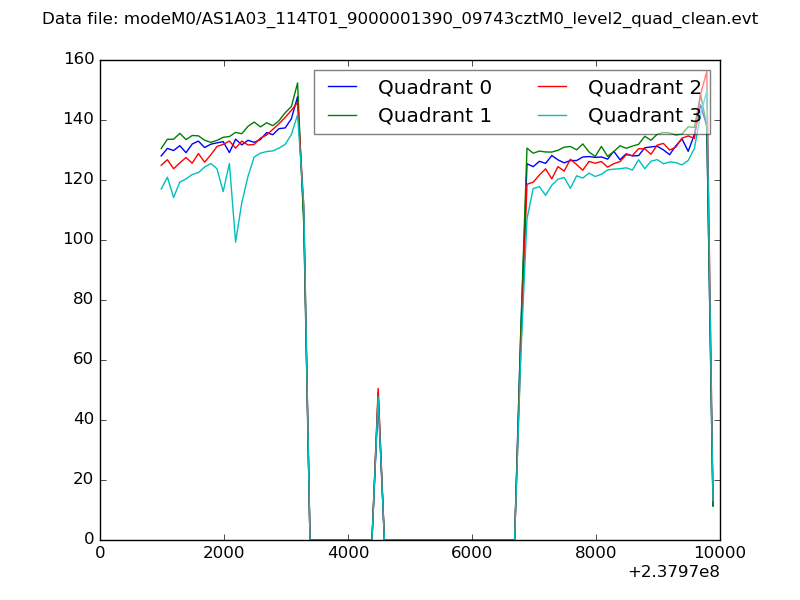 |
|
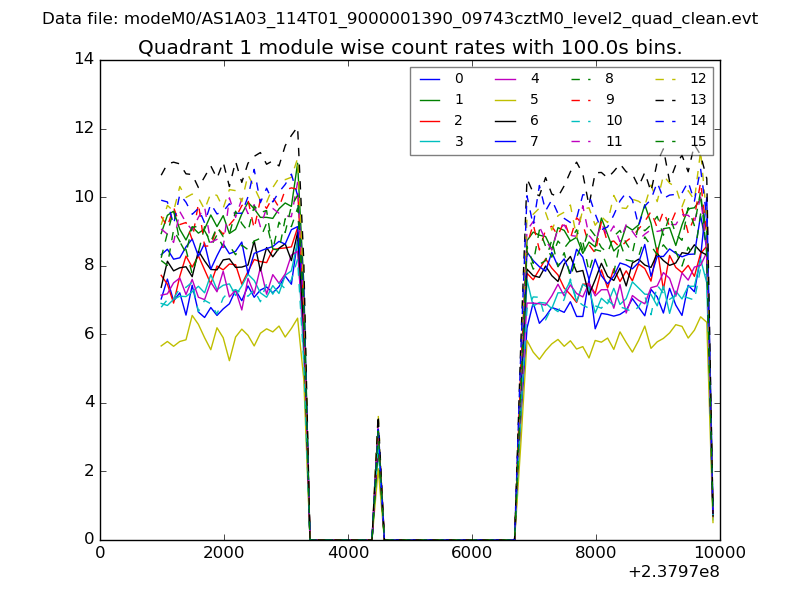
| Module-wise count rates for Quadrant A Data is divided into 100 sec bins |
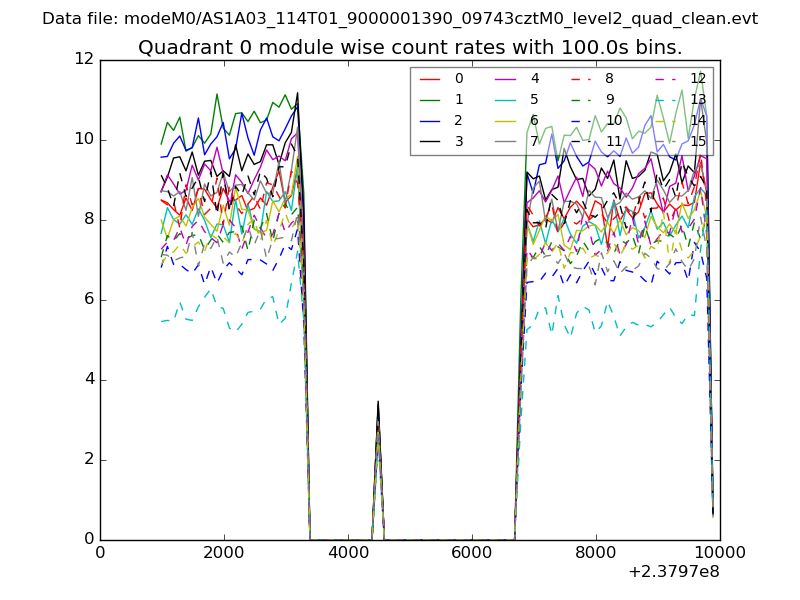 |
 |
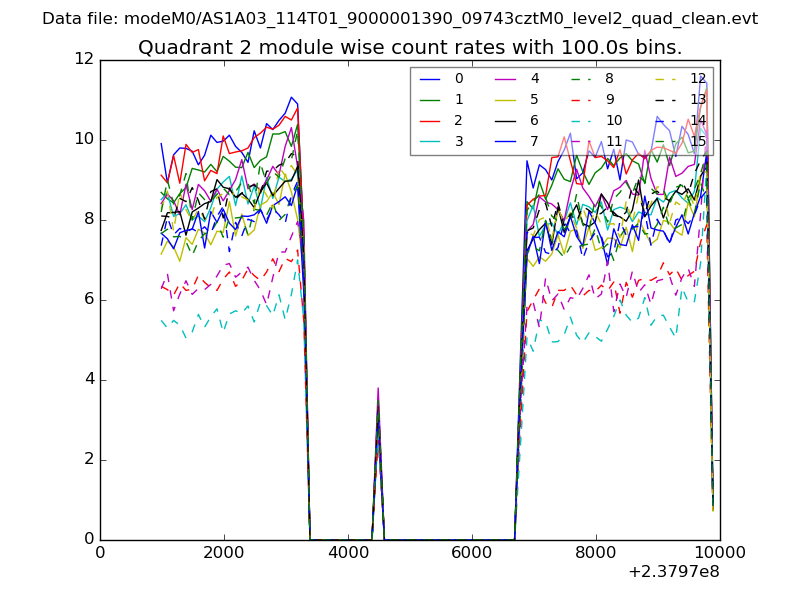
| Module-wise count rates for Quadrant B Data is divided into 100 sec bins |
 |
 |
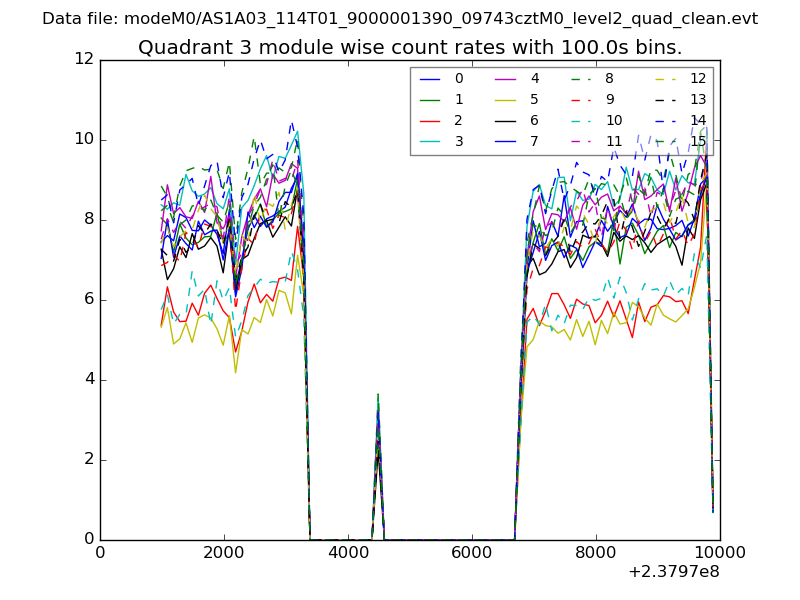
| Module-wise count rates for Quadrant C Data is divided into 100 sec bins |
 |
 |
| Module-wise count rates for Quadrant D Data is divided into 100 sec bins |
 |
 |
| Parameter | Plot |
|---|---|
| CZT HV Monitor | 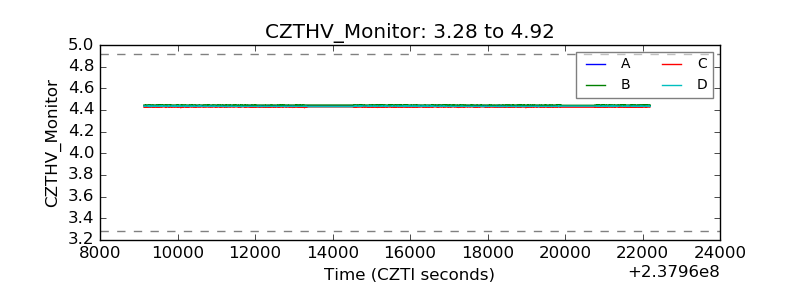 |
| D_VDD | 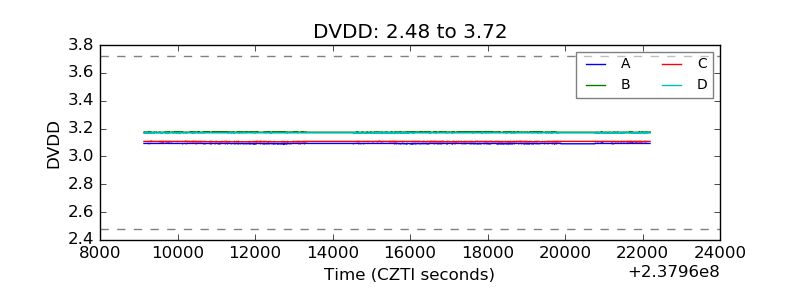 |
| Temperature 1 | 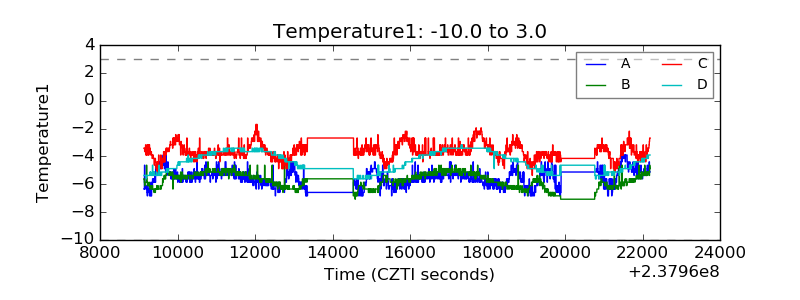 |
| Veto HV Monitor | 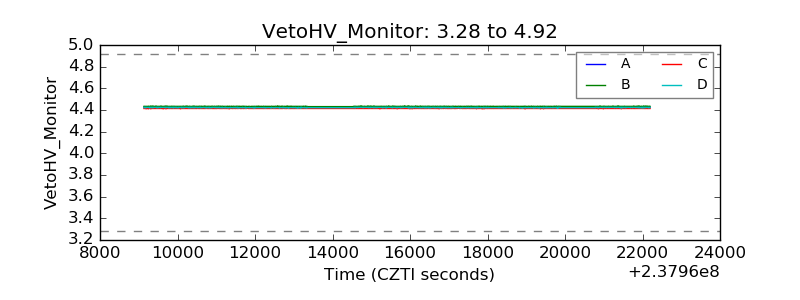 |
| Veto LLD | 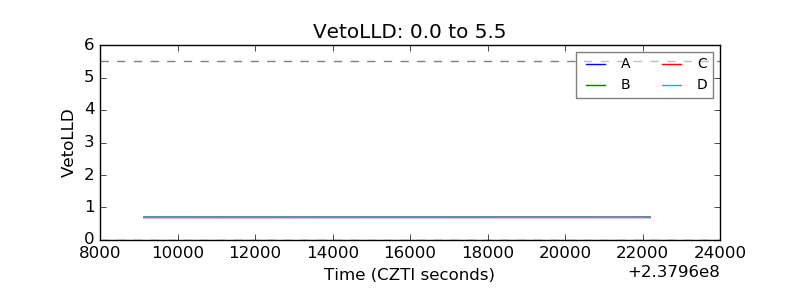 |
| Alpha Counter | 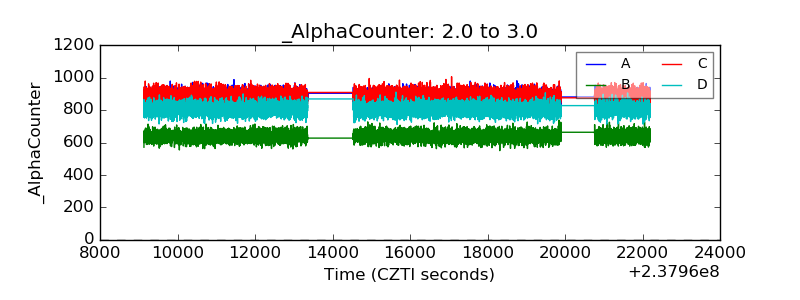 |
| _CPM_Rate | 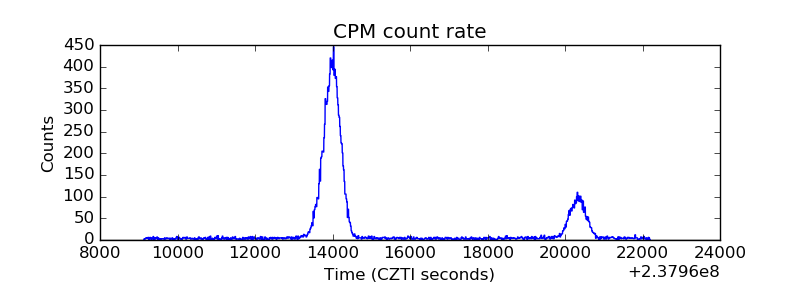 |
| CZT Counter | 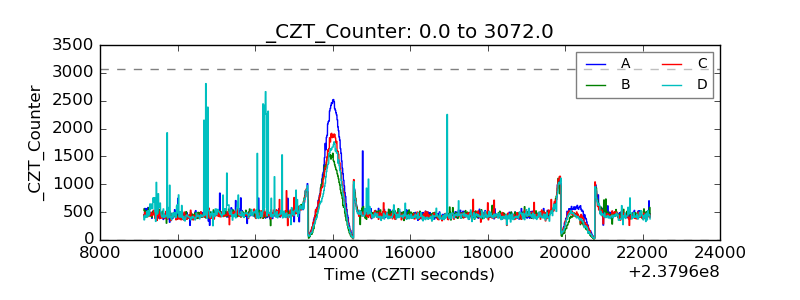 |
| +2.5 Volts monitor | 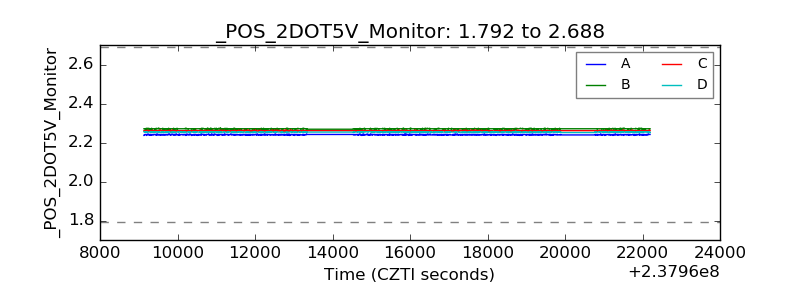 |
| +5 Volts monitor | 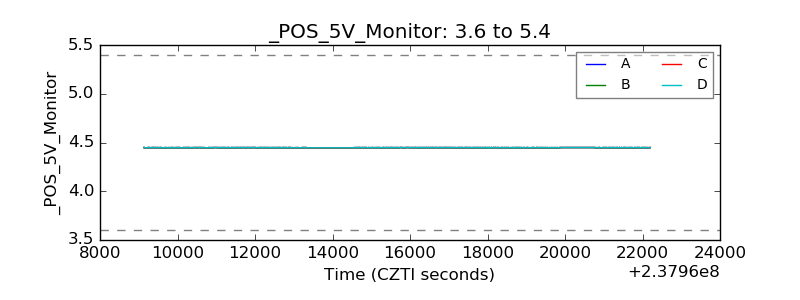 |
| _ROLL_ROT | 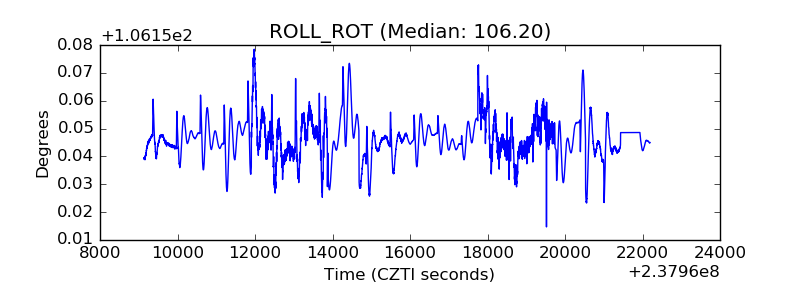 |
| _Roll_DEC | 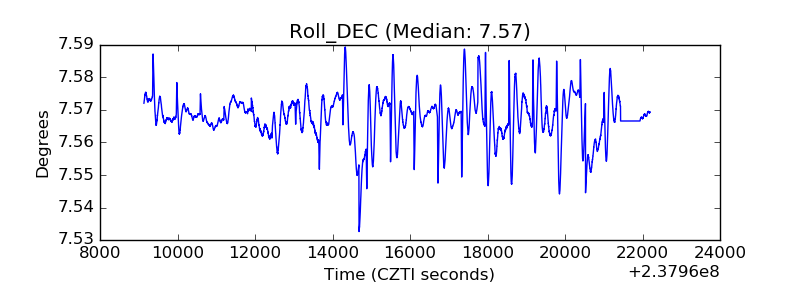 |
| _Roll_RA | 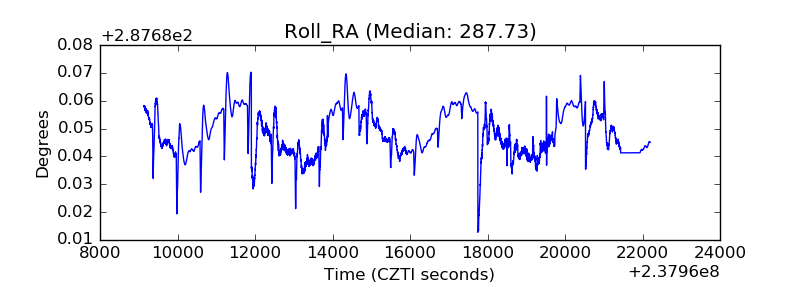 |
| Veto Counter | 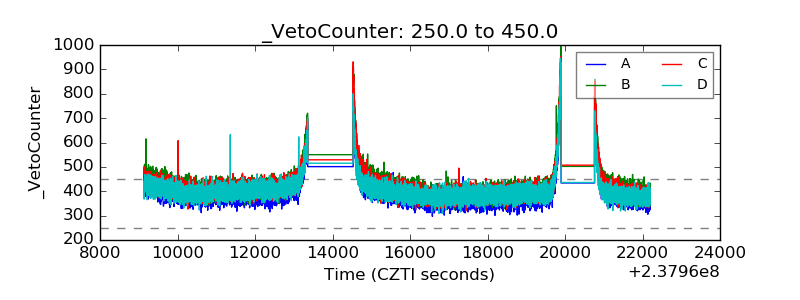 |