| Param | Original file | Final file |
|---|---|---|
| Filename | modeM0/AS1A03_114T01_9000001390_09745cztM0_level2.evt | modeM0/AS1A03_114T01_9000001390_09745cztM0_level2_quad_clean.evt |
| Size (bytes) | 540,910,080 | 84,147,840 |
| Size | 515.9 MB | 80.2 MB |
| Events in quadrant A | 3,927,541 | 498,538 |
| Events in quadrant B | 3,978,750 | 509,482 |
| Events in quadrant C | 3,903,239 | 493,185 |
| Events in quadrant D | 4,015,872 | 478,672 |
| Mode M0 | |||
|---|---|---|---|
| Quadrant | BADHDUFLAG | Total packets | Discarded packets |
| A | 0 | 17254 | 7 |
| B | 0 | 17288 | 4 |
| C | 0 | 17280 | 4 |
| D | 0 | 17776 | 9 |
| Mode SS | |||
|---|---|---|---|
| Quadrant | BADHDUFLAG | Total packets | Discarded packets |
| A | 0 | 166 | 0 |
| B | 0 | 166 | 0 |
| C | 0 | 166 | 0 |
| D | 0 | 166 | 0 |
| Mode M9 | |||
|---|---|---|---|
| Quadrant | BADHDUFLAG | Total packets | Discarded packets |
| A | 0 | 6 | 0 |
| B | 0 | 6 | 0 |
| C | 0 | 6 | 0 |
| D | 0 | 6 | 0 |
| Quadrant | Total seconds | Saturated seconds | Saturation percentage |
|---|---|---|---|
| A | 8181 | 462 | 5.647231% |
| B | 8182 | 474 | 5.793205% |
| C | 8182 | 415 | 5.072110% |
| D | 8179 | 431 | 5.269593% |
Noise dominated data is calculated using 1-second bins in cleaned event files. If a bin has >2000 counts, and if more than 50% of those come from <1% of pixels, then it is considered to be noise-dominated and hence unusable.
| Quadrant | # 1 sec bins | Bins with >0 counts | Bins with >2000 counts | High rate bins dominated by noise | Noise dominated (total time) | Noise dominated (detector-on time) | Marked lightcurve |
|---|---|---|---|---|---|---|---|
| A | 8674 | 8186 | 0 | 0 | 0.00% | 0.00% | 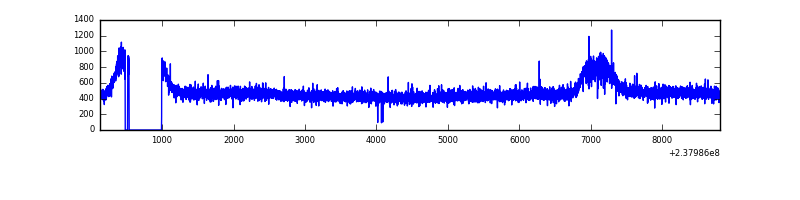 |
| B | 8674 | 8186 | 0 | 0 | 0.00% | 0.00% | 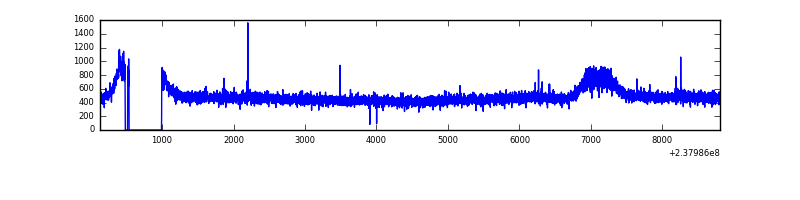 |
| C | 8674 | 8186 | 1 | 1 | 0.01% | 0.01% | 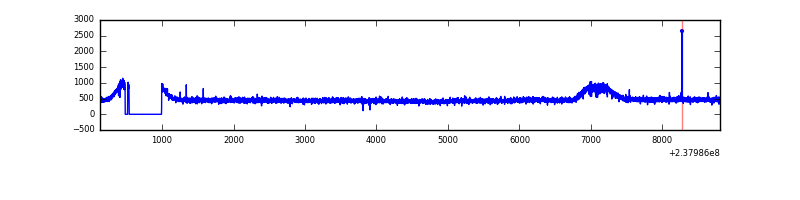 |
| D | 8674 | 8186 | 30 | 30 | 0.35% | 0.37% | 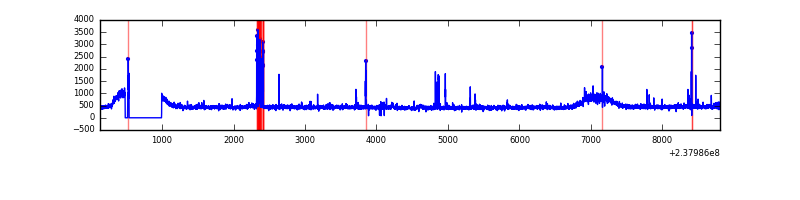 |
Top three noisy pixels from each quadrant. If the there are fewer than three noisy pixels in the level2.evt file, extra rows are filled as -1
| Pixel properties | Quadrant properties | ||||||
|---|---|---|---|---|---|---|---|
| Quadrant | DetID | PixID | Counts | Sigma | Mean | Median | Sigma |
| A | 0 | 226 | 9387 | 39.86 | 1020 | 996 | 210.5 |
| A | 12 | 194 | 8211 | 34.27 | 1020 | 996 | 210.5 |
| A | 3 | 137 | 5216 | 20.04 | 1020 | 996 | 210.5 |
| B | 12 | 111 | 24528 | 119.09 | 1017 | 989 | 197.6 |
| B | 11 | 111 | 20017 | 96.27 | 1017 | 989 | 197.6 |
| B | 14 | 111 | 16083 | 76.37 | 1017 | 989 | 197.6 |
| C | 8 | 128 | 7560 | 28.13 | 995 | 996 | 233.3 |
| C | 13 | 61 | 7477 | 27.78 | 995 | 996 | 233.3 |
| C | 14 | 234 | 6271 | 22.61 | 995 | 996 | 233.3 |
| D | 1 | 52 | 192520 | 748.41 | 983 | 956 | 256.0 |
| D | 13 | 137 | 39753 | 151.57 | 983 | 956 | 256.0 |
| D | 2 | 234 | 27004 | 101.77 | 983 | 956 | 256.0 |
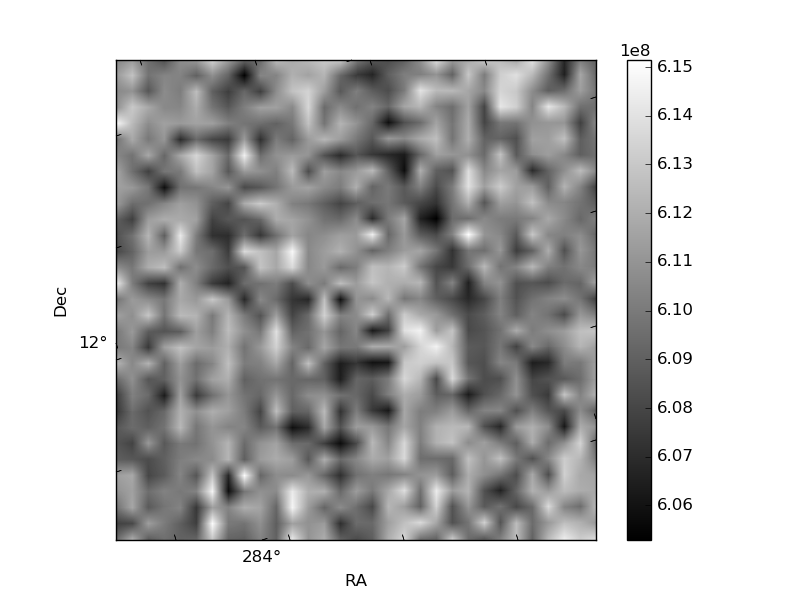
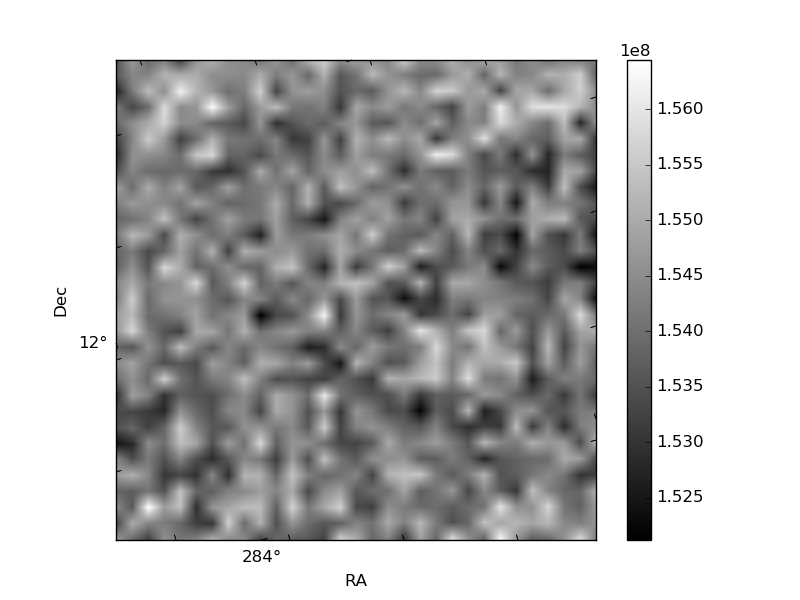
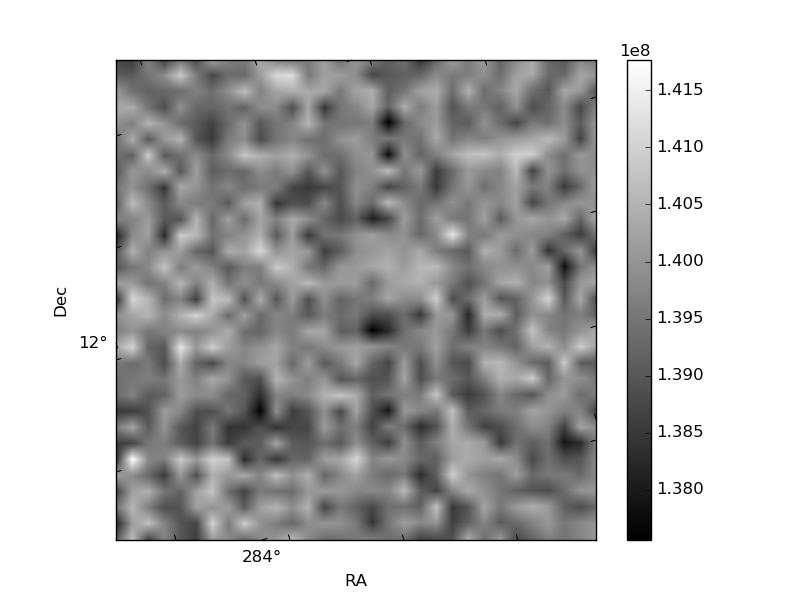
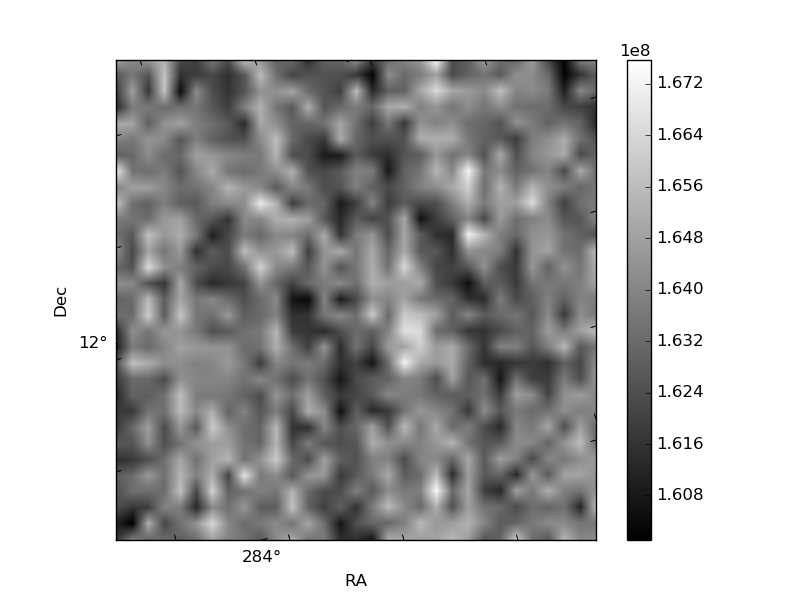
Histogram calculated using DETX and DETY for each event in the final _common_clean file
| Quadrant A | 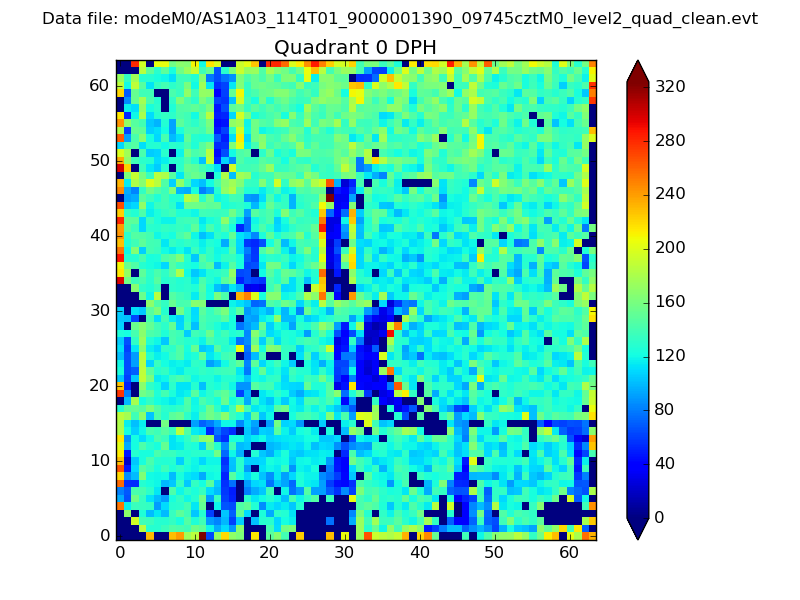 |
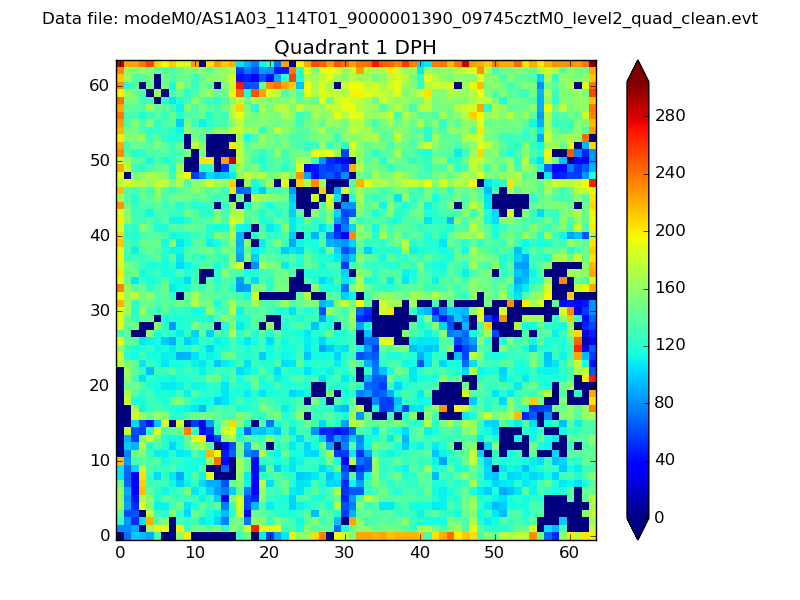 |
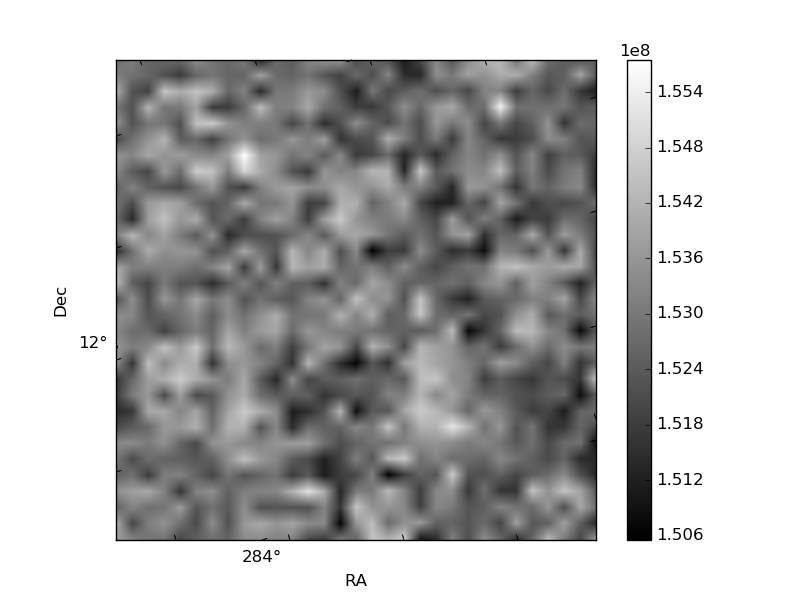
Quadrant B |
|---|---|---|---|
| Quadrant D | 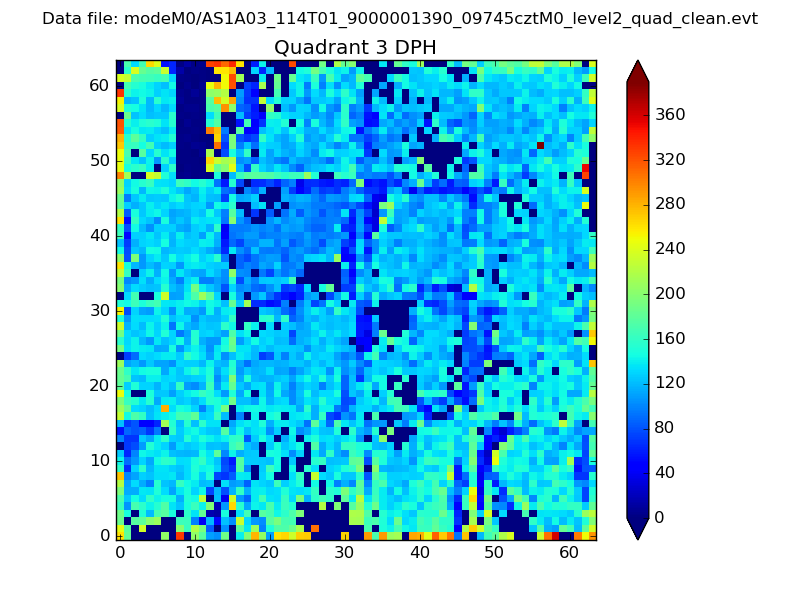 |
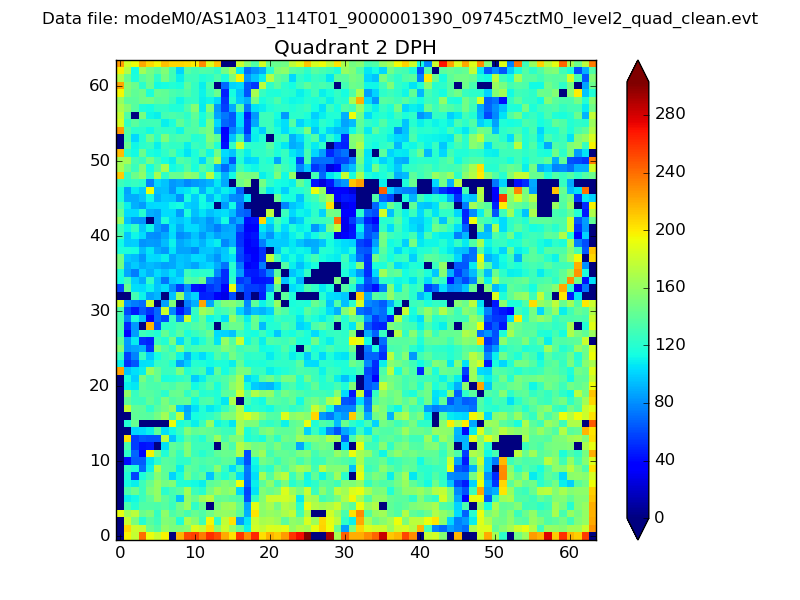 |
Quadrant C |
| Plot type | Count rate plots | Images |
|---|---|---|
| Comparison with Poisson distribution Blue bars denote a histogram of data divided into 1 sec bins. Red curve is a Poisson curve with rate = median count rate of data. |
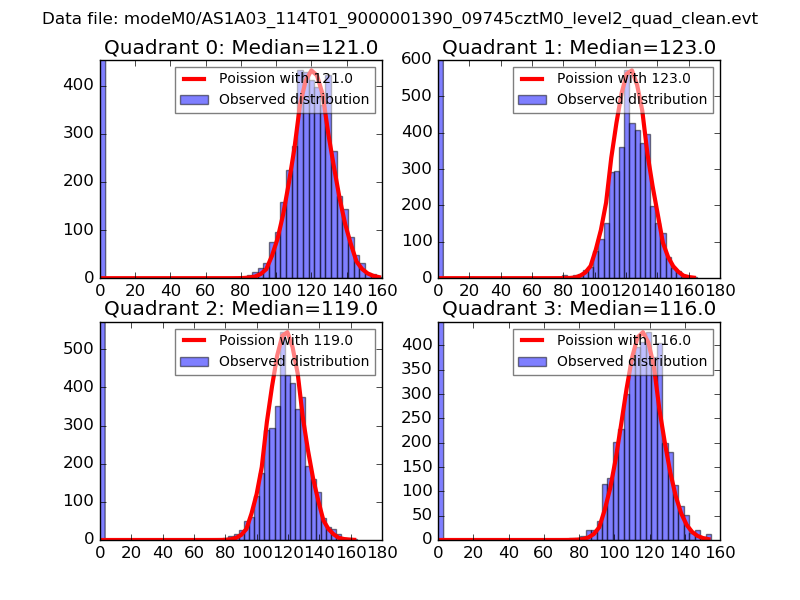 |
 |
| Quadrant-wise count rates Data is divided into 100 sec bins |
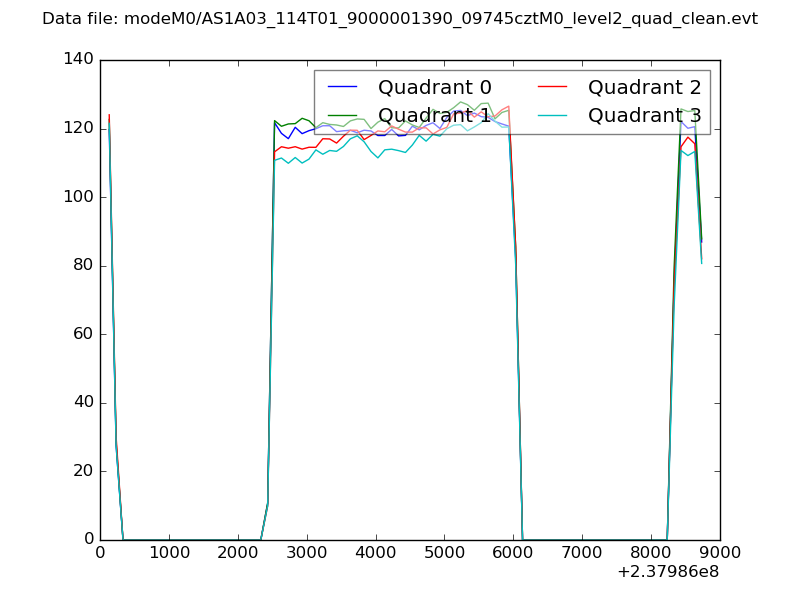 |
|
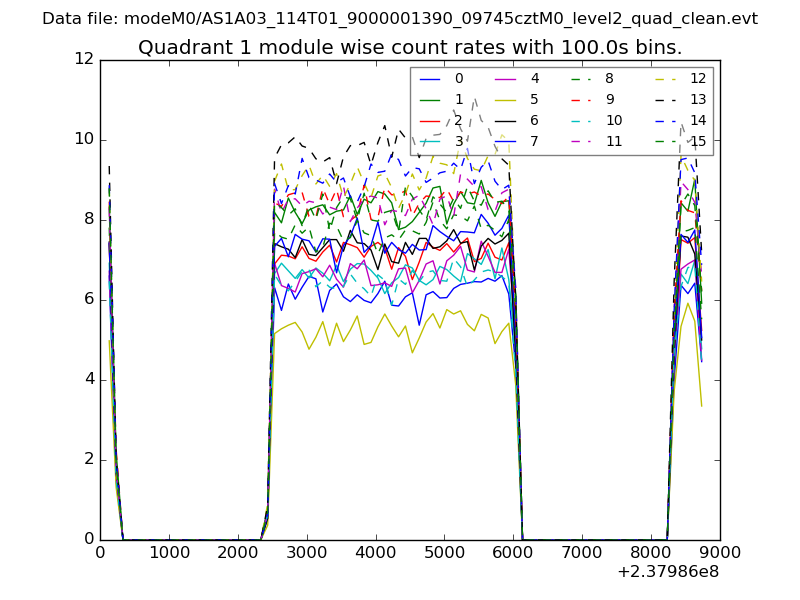
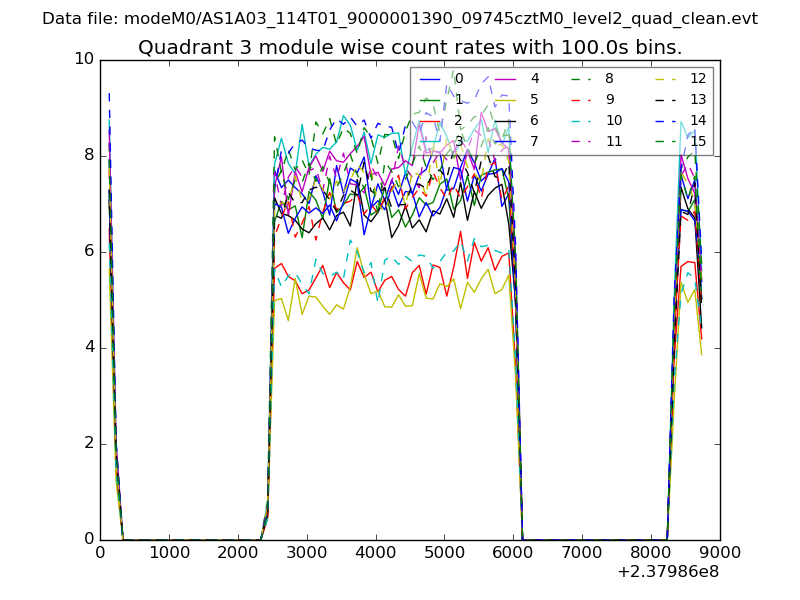
| Module-wise count rates for Quadrant A Data is divided into 100 sec bins |
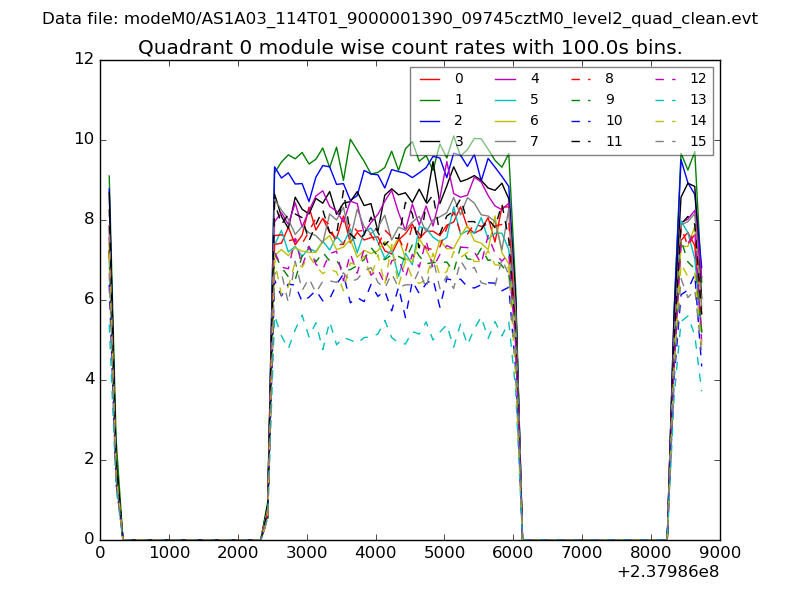 |
 |
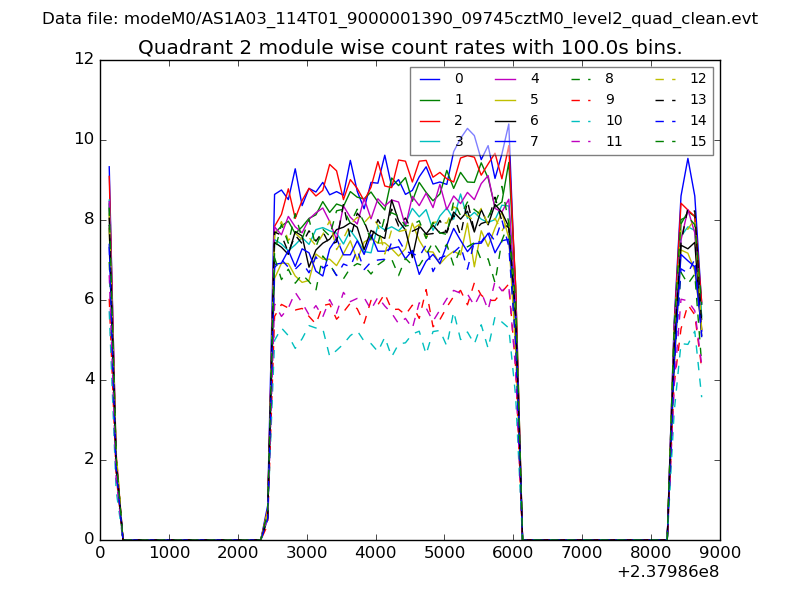
| Module-wise count rates for Quadrant B Data is divided into 100 sec bins |
 |
 |
| Module-wise count rates for Quadrant C Data is divided into 100 sec bins |
 |
 |
| Module-wise count rates for Quadrant D Data is divided into 100 sec bins |
 |
 |
| Parameter | Plot |
|---|---|
| CZT HV Monitor | 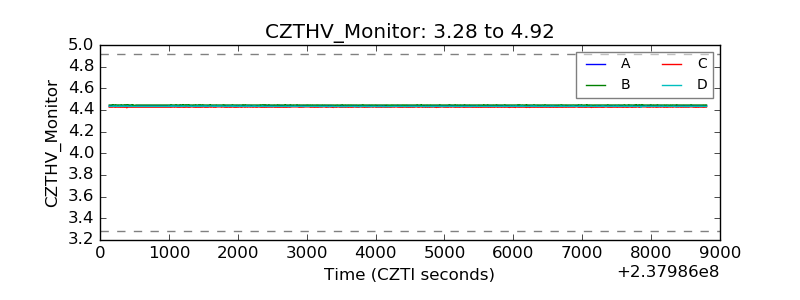 |
| D_VDD | 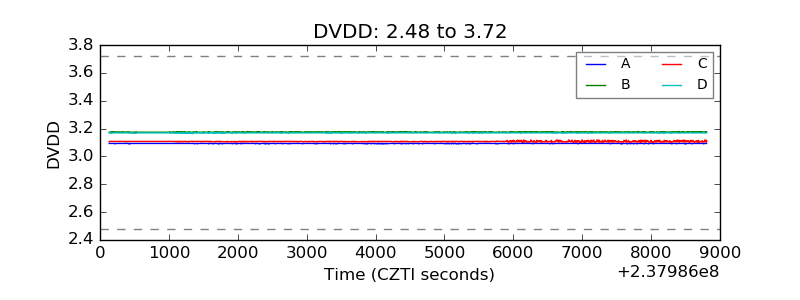 |
| Temperature 1 | 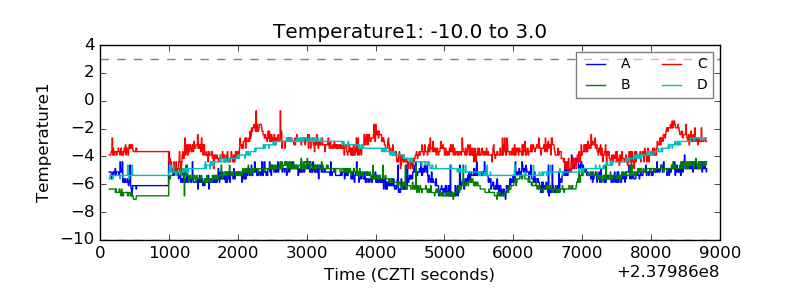 |
| Veto HV Monitor | 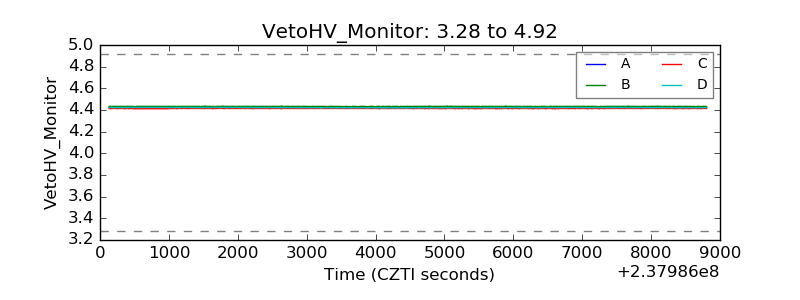 |
| Veto LLD | 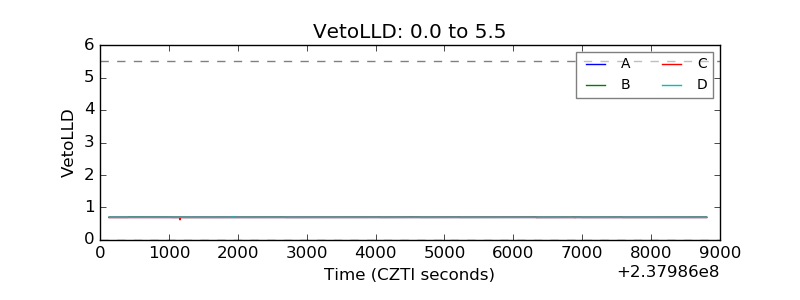 |
| Alpha Counter | 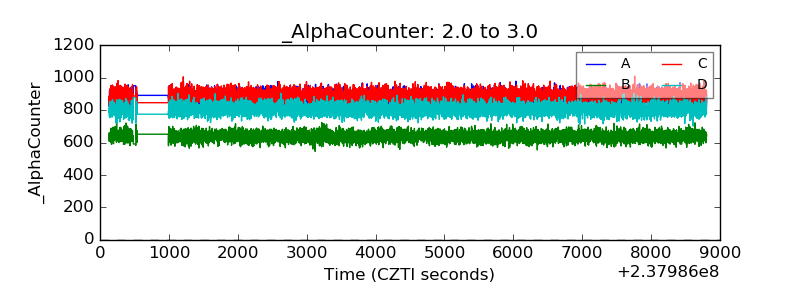 |
| _CPM_Rate | 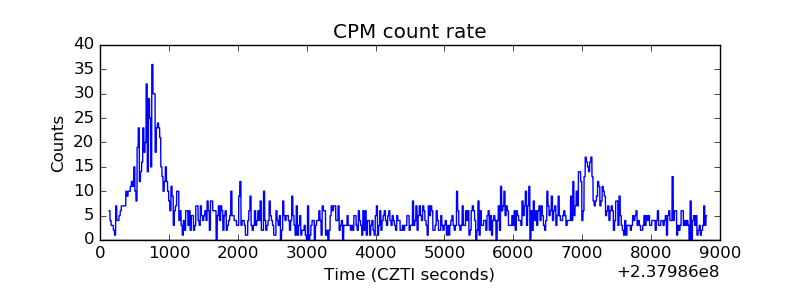 |
| CZT Counter | 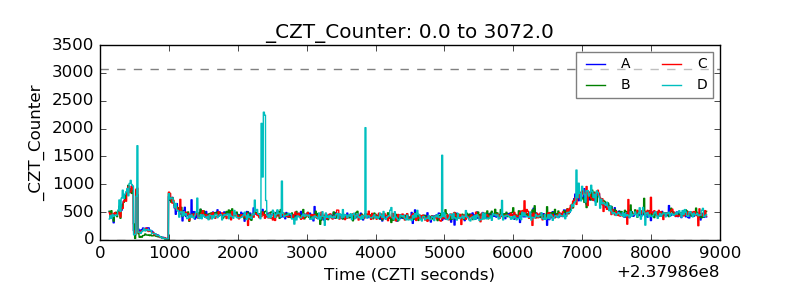 |
| +2.5 Volts monitor |  |
| +5 Volts monitor |  |
| _ROLL_ROT | 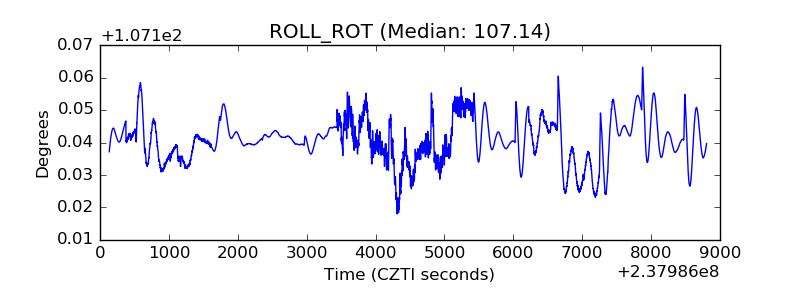 |
| _Roll_DEC | 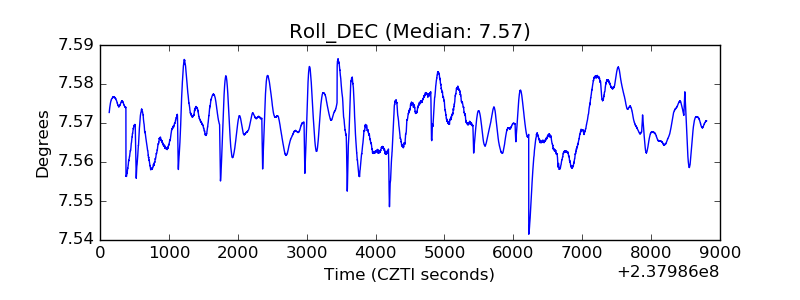 |
| _Roll_RA | 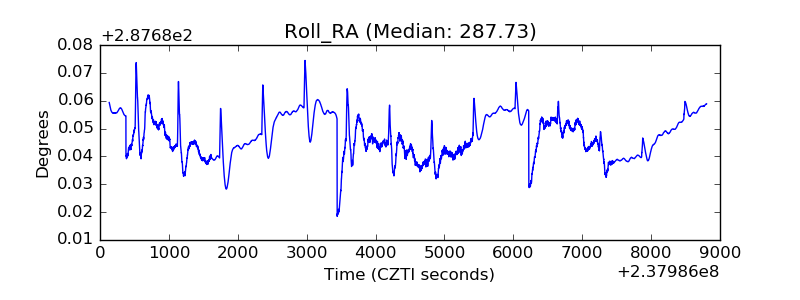 |
| Veto Counter | 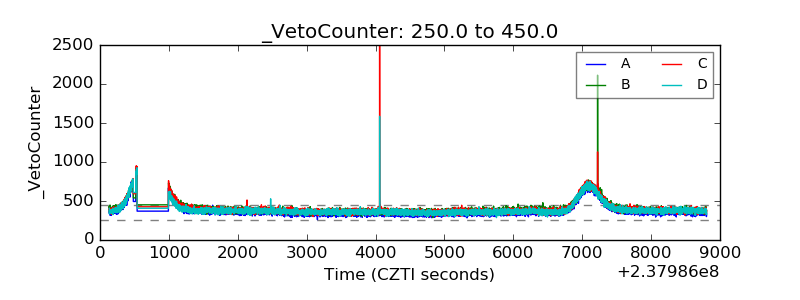 |