| Param | Original file | Final file |
|---|---|---|
| Filename | modeM0/AS1A03_114T01_9000001390_09746cztM0_level2.evt | modeM0/AS1A03_114T01_9000001390_09746cztM0_level2_quad_clean.evt |
| Size (bytes) | 604,327,680 | 88,496,640 |
| Size | 576.3 MB | 84.4 MB |
| Events in quadrant A | 4,186,821 | 527,487 |
| Events in quadrant B | 4,258,631 | 537,099 |
| Events in quadrant C | 4,174,630 | 517,718 |
| Events in quadrant D | 5,089,623 | 492,088 |
| Mode M0 | |||
|---|---|---|---|
| Quadrant | BADHDUFLAG | Total packets | Discarded packets |
| A | 0 | 18347 | 2 |
| B | 0 | 18414 | 1 |
| C | 0 | 18348 | 1 |
| D | 0 | 20820 | 1 |
| Mode SS | |||
|---|---|---|---|
| Quadrant | BADHDUFLAG | Total packets | Discarded packets |
| A | 0 | 176 | 0 |
| B | 0 | 176 | 0 |
| C | 0 | 176 | 0 |
| D | 0 | 176 | 0 |
| Mode M9 | |||
|---|---|---|---|
| Quadrant | BADHDUFLAG | Total packets | Discarded packets |
| A | 0 | 2 | 0 |
| B | 0 | 2 | 0 |
| C | 0 | 2 | 0 |
| D | 0 | 2 | 0 |
| Quadrant | Total seconds | Saturated seconds | Saturation percentage |
|---|---|---|---|
| A | 8718 | 500 | 5.735260% |
| B | 8718 | 519 | 5.953200% |
| C | 8718 | 466 | 5.345263% |
| D | 8718 | 642 | 7.364074% |
Noise dominated data is calculated using 1-second bins in cleaned event files. If a bin has >2000 counts, and if more than 50% of those come from <1% of pixels, then it is considered to be noise-dominated and hence unusable.
| Quadrant | # 1 sec bins | Bins with >0 counts | Bins with >2000 counts | High rate bins dominated by noise | Noise dominated (total time) | Noise dominated (detector-on time) | Marked lightcurve |
|---|---|---|---|---|---|---|---|
| A | 8908 | 8719 | 0 | 0 | 0.00% | 0.00% | 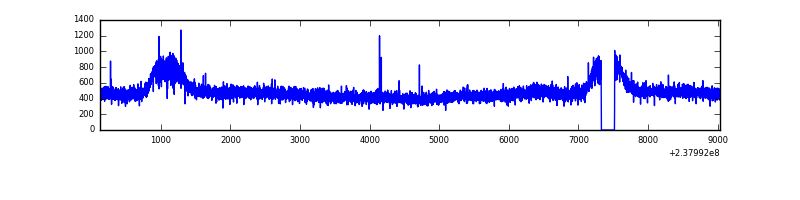 |
| B | 8908 | 8719 | 0 | 0 | 0.00% | 0.00% | 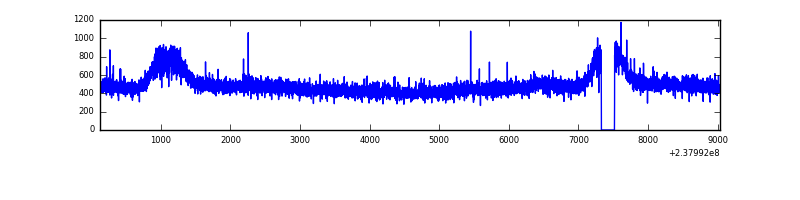 |
| C | 8908 | 8719 | 1 | 1 | 0.01% | 0.01% | 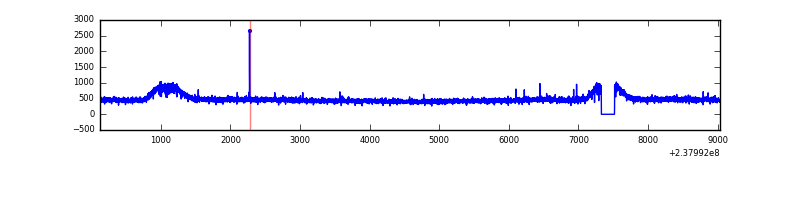 |
| D | 8908 | 8719 | 150 | 150 | 1.68% | 1.72% | 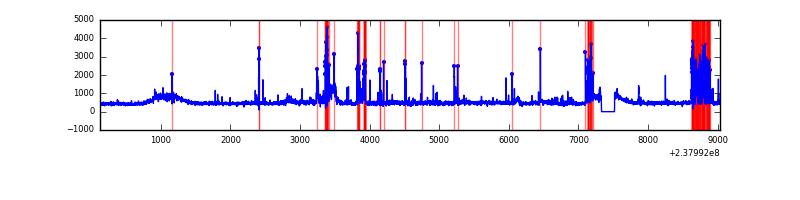 |
Top three noisy pixels from each quadrant. If the there are fewer than three noisy pixels in the level2.evt file, extra rows are filled as -1
| Pixel properties | Quadrant properties | ||||||
|---|---|---|---|---|---|---|---|
| Quadrant | DetID | PixID | Counts | Sigma | Mean | Median | Sigma |
| A | 13 | 251 | 12980 | 53.68 | 1085 | 1059 | 222.1 |
| A | 0 | 226 | 10117 | 40.79 | 1085 | 1059 | 222.1 |
| A | 12 | 194 | 8649 | 34.18 | 1085 | 1059 | 222.1 |
| B | 12 | 111 | 25915 | 117.76 | 1085 | 1054 | 211.1 |
| B | 0 | 85 | 22690 | 102.48 | 1085 | 1054 | 211.1 |
| B | 11 | 111 | 21397 | 96.36 | 1085 | 1054 | 211.1 |
| C | 8 | 128 | 16859 | 64.05 | 1060 | 1061 | 246.6 |
| C | 8 | 112 | 8214 | 29.0 | 1060 | 1061 | 246.6 |
| C | 13 | 61 | 8035 | 28.28 | 1060 | 1061 | 246.6 |
| D | 1 | 52 | 977655 | 3610.42 | 1040 | 1011 | 270.5 |
| D | 13 | 137 | 119555 | 438.23 | 1040 | 1011 | 270.5 |
| D | 2 | 234 | 29555 | 105.52 | 1040 | 1011 | 270.5 |
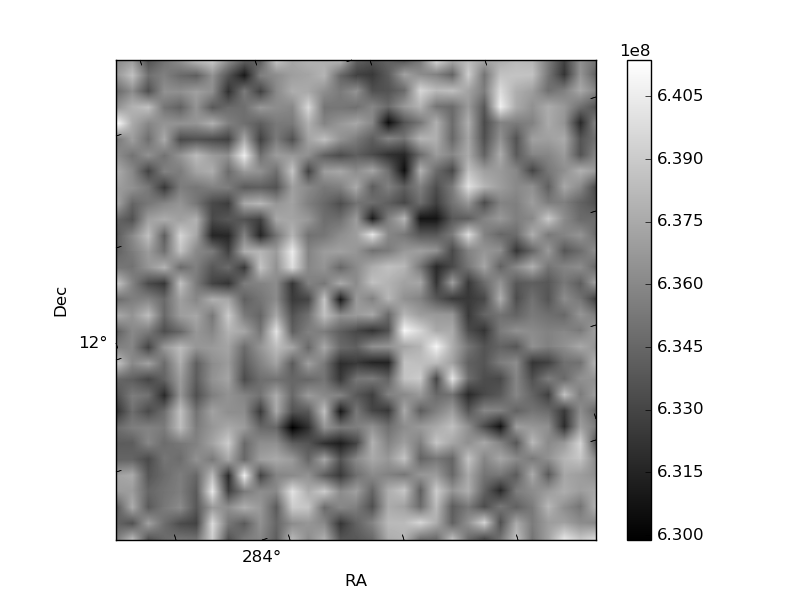
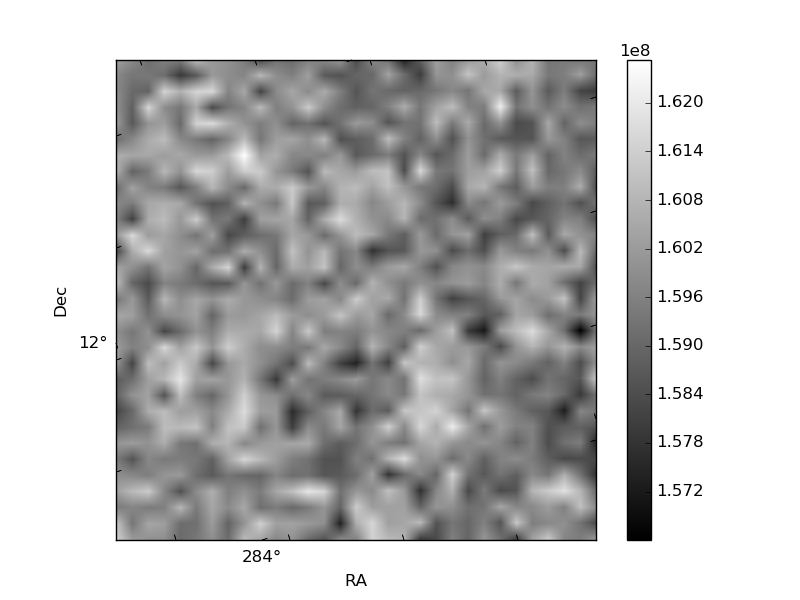
Histogram calculated using DETX and DETY for each event in the final _common_clean file
| Quadrant A | 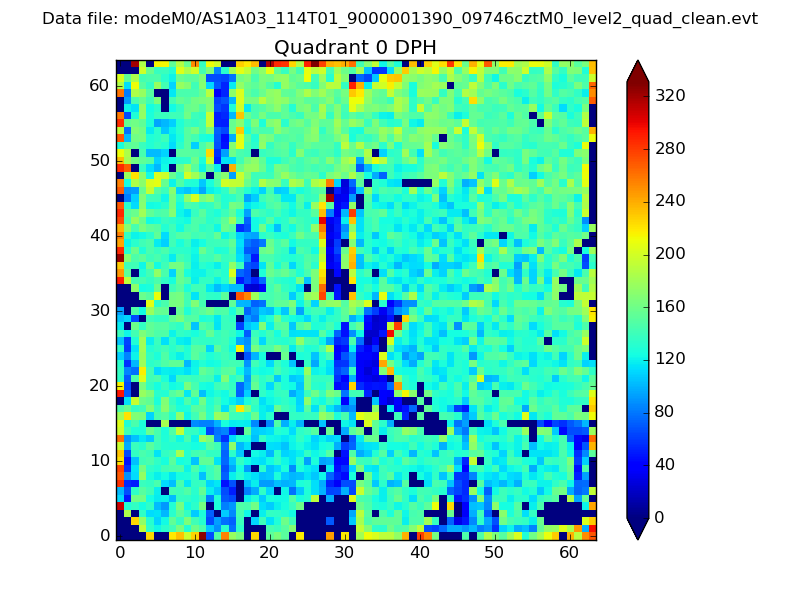 |
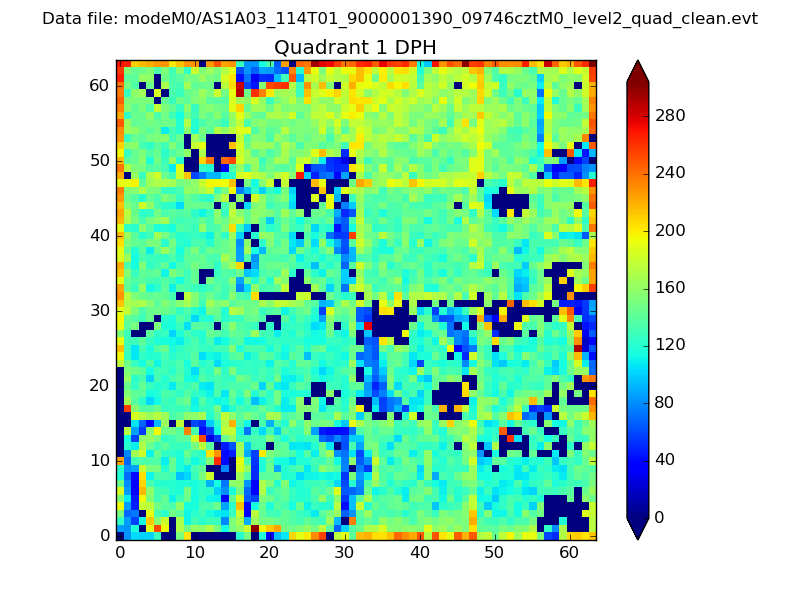 |
Quadrant B |
|---|---|---|---|
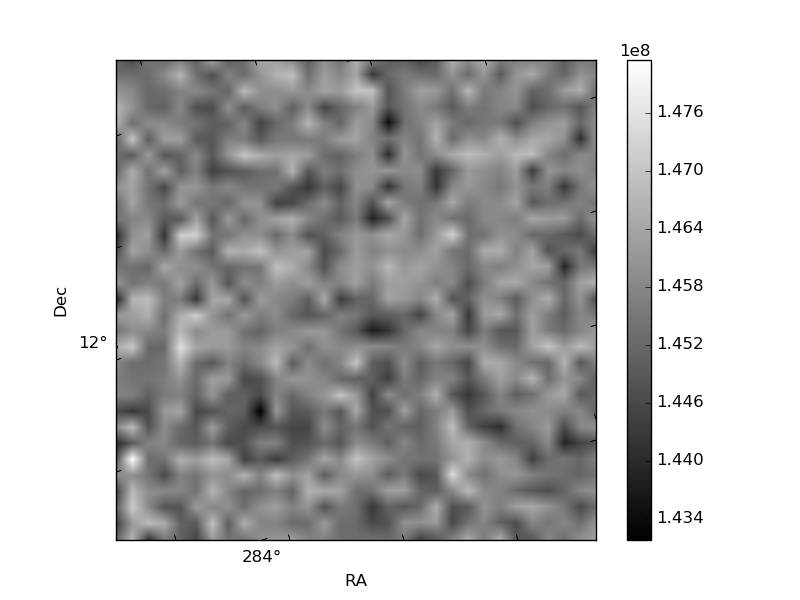
| Quadrant D | 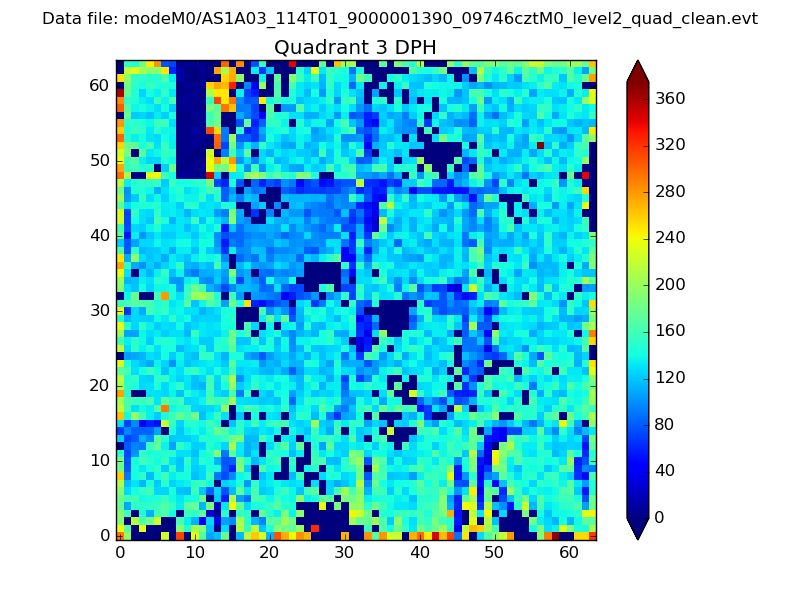 |
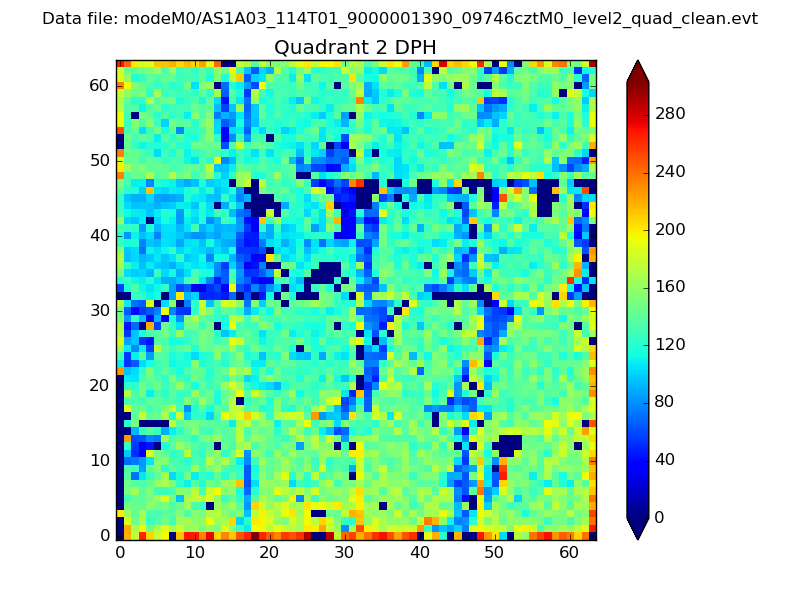 |
Quadrant C |
| Plot type | Count rate plots | Images |
|---|---|---|
| Comparison with Poisson distribution Blue bars denote a histogram of data divided into 1 sec bins. Red curve is a Poisson curve with rate = median count rate of data. |
 |
 |
| Quadrant-wise count rates Data is divided into 100 sec bins |
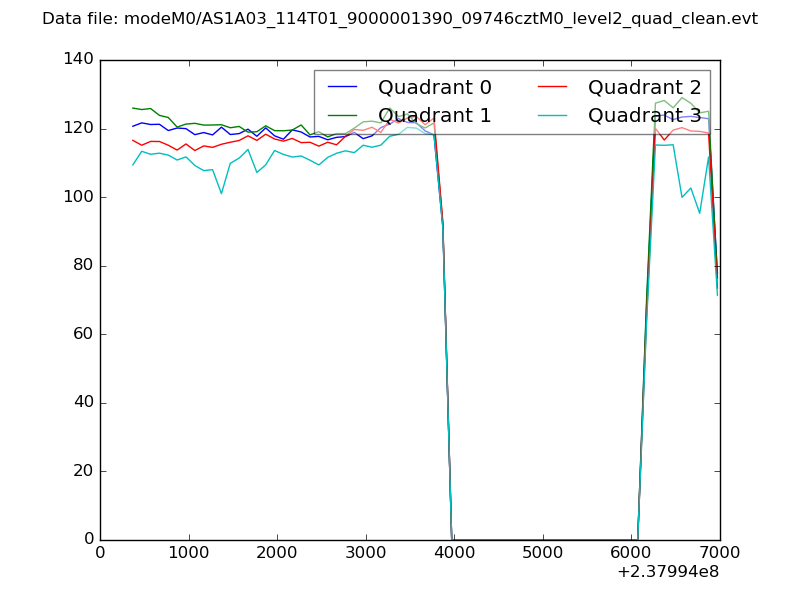 |
|
| Module-wise count rates for Quadrant A Data is divided into 100 sec bins |
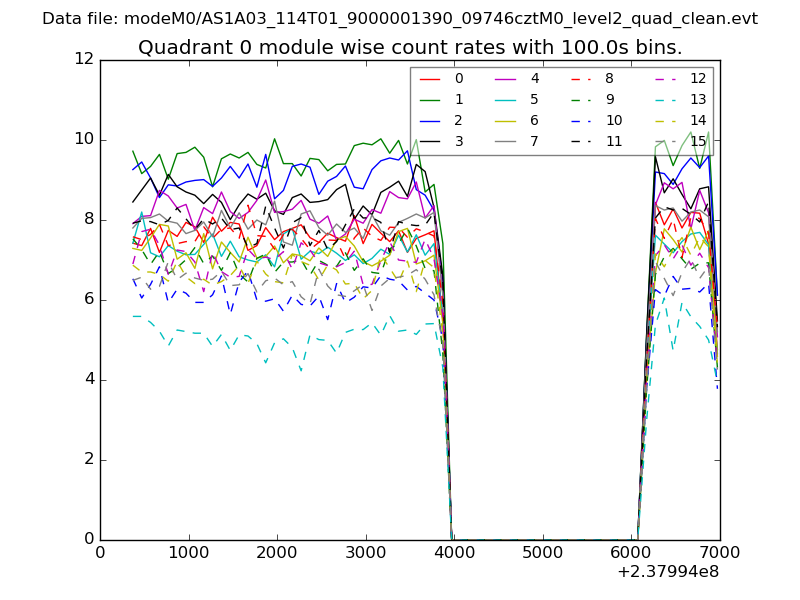 |
 |
| Module-wise count rates for Quadrant B Data is divided into 100 sec bins |
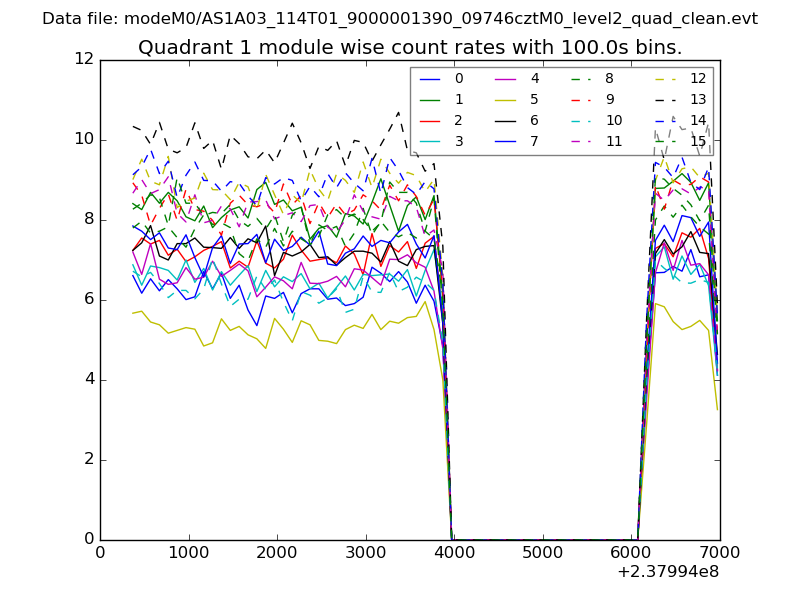 |
 |
| Module-wise count rates for Quadrant C Data is divided into 100 sec bins |
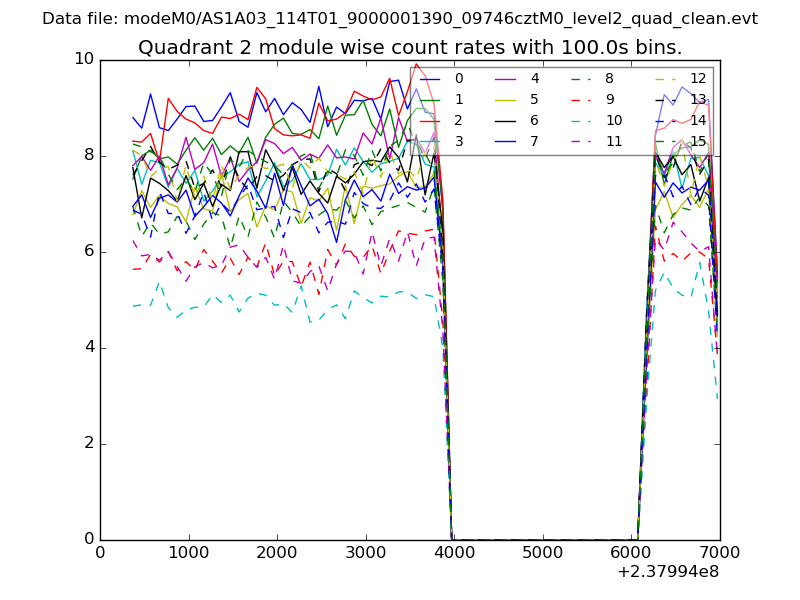 |
 |
| Module-wise count rates for Quadrant D Data is divided into 100 sec bins |
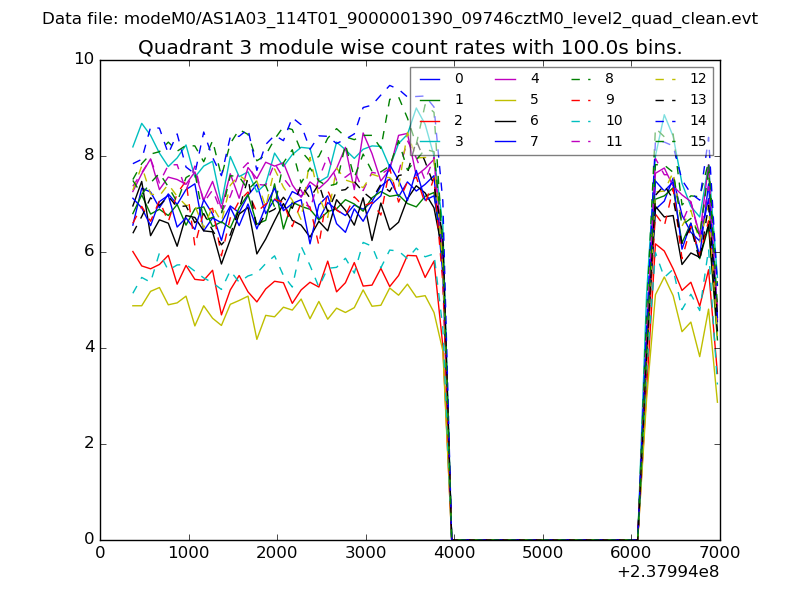 |
 |
| Parameter | Plot |
|---|---|
| CZT HV Monitor | 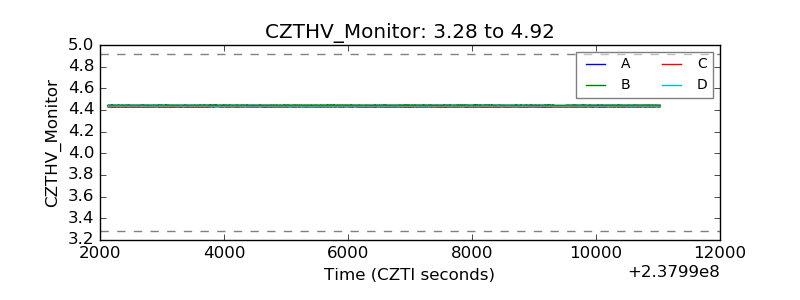 |
| D_VDD | 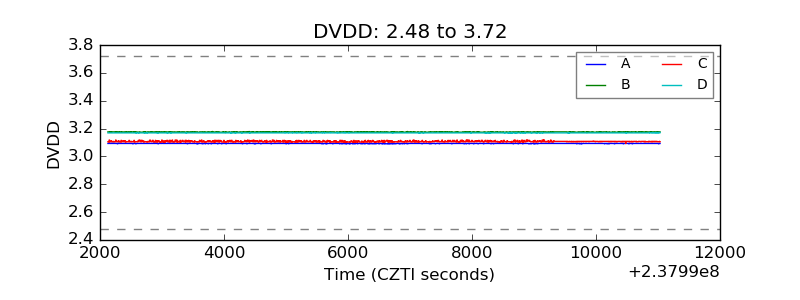 |
| Temperature 1 | 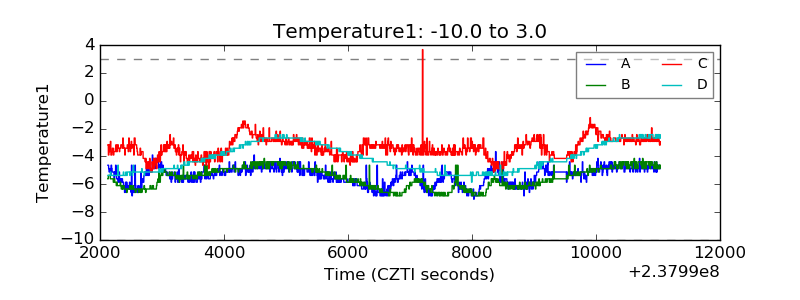 |
| Veto HV Monitor | 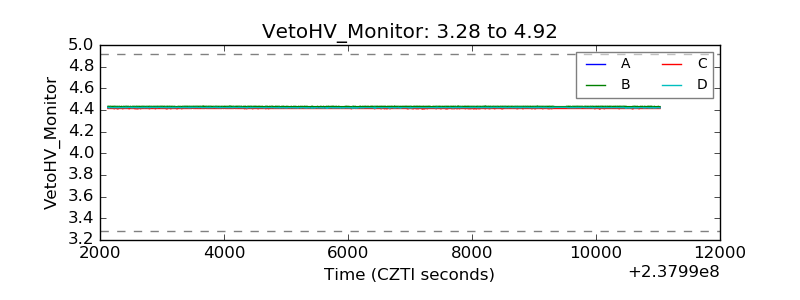 |
| Veto LLD | 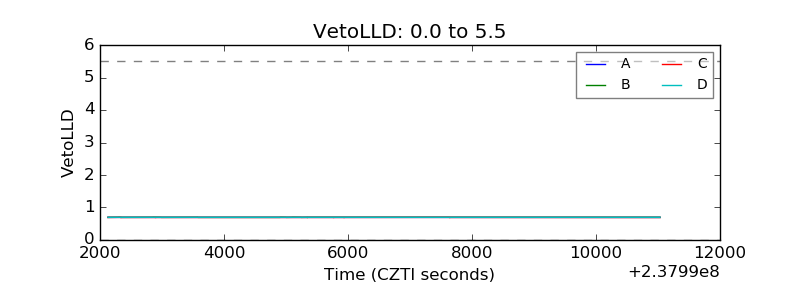 |
| Alpha Counter | 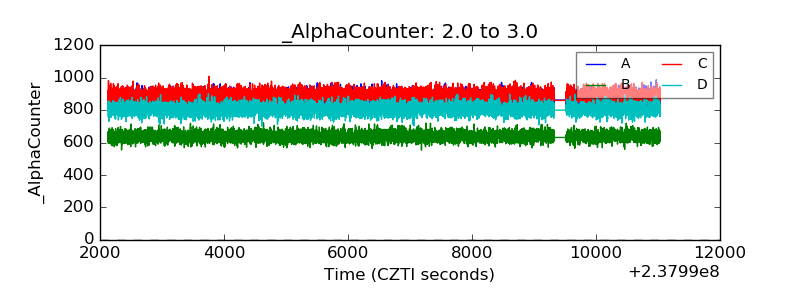 |
| _CPM_Rate | 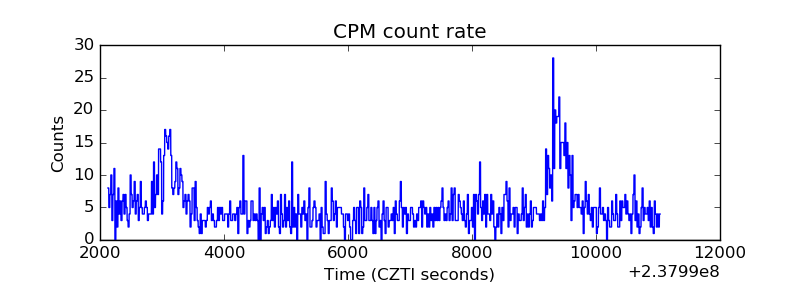 |
| CZT Counter | 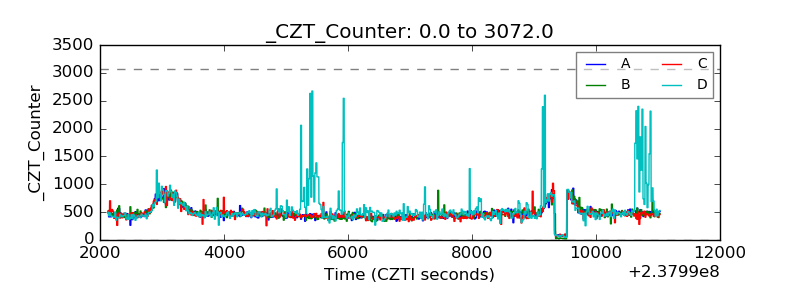 |
| +2.5 Volts monitor |  |
| +5 Volts monitor | 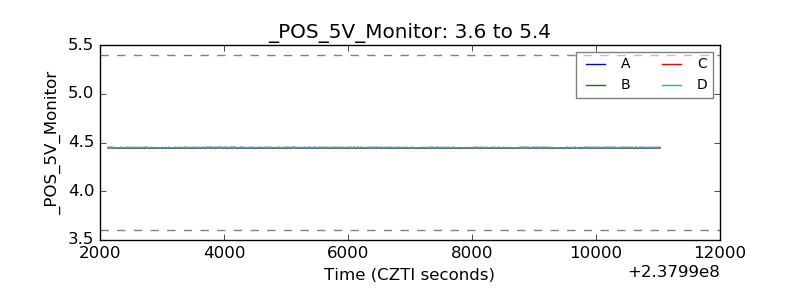 |
| _ROLL_ROT |  |
| _Roll_DEC | 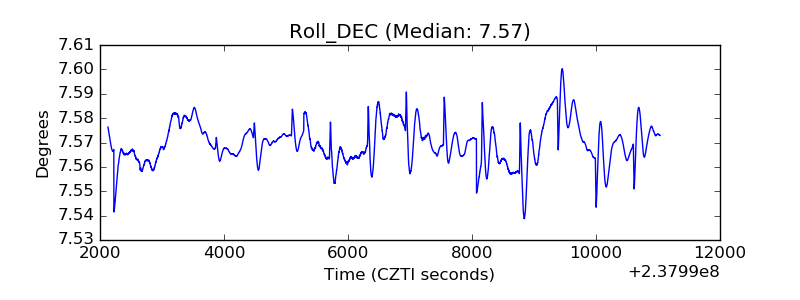 |
| _Roll_RA | 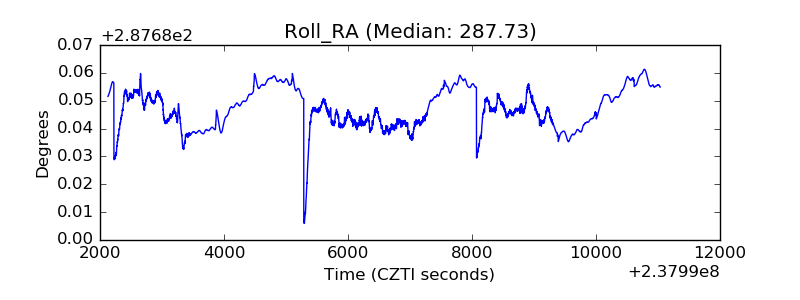 |
| Veto Counter | 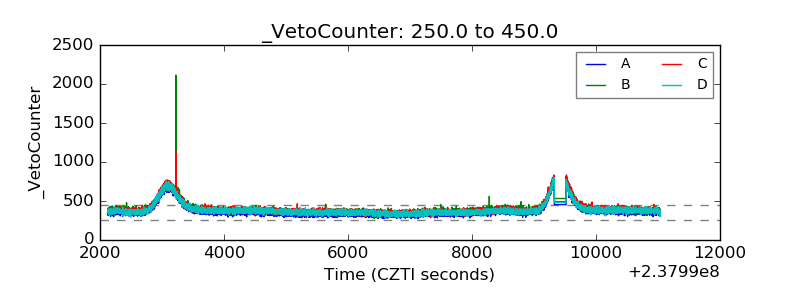 |