| Param | Original file | Final file |
|---|---|---|
| Filename | modeM0/AS1A03_114T01_9000001390_09752cztM0_level2.evt | modeM0/AS1A03_114T01_9000001390_09752cztM0_level2_quad_clean.evt |
| Size (bytes) | 417,519,360 | 88,511,040 |
| Size | 398.2 MB | 84.4 MB |
| Events in quadrant A | 2,995,302 | 559,668 |
| Events in quadrant B | 3,031,585 | 574,503 |
| Events in quadrant C | 2,952,697 | 558,968 |
| Events in quadrant D | 3,220,133 | 531,374 |
| Mode M0 | |||
|---|---|---|---|
| Quadrant | BADHDUFLAG | Total packets | Discarded packets |
| A | 0 | 13436 | 34 |
| B | 0 | 13445 | 29 |
| C | 0 | 13379 | 30 |
| D | 0 | 14422 | 41 |
| Mode SS | |||
|---|---|---|---|
| Quadrant | BADHDUFLAG | Total packets | Discarded packets |
| A | 0 | 132 | 0 |
| B | 0 | 132 | 0 |
| C | 0 | 132 | 0 |
| D | 0 | 132 | 0 |
| Mode M9 | |||
|---|---|---|---|
| Quadrant | BADHDUFLAG | Total packets | Discarded packets |
| A | 0 | 18 | 1 |
| B | 0 | 18 | 0 |
| C | 0 | 18 | 0 |
| D | 0 | 19 | 0 |
| Quadrant | Total seconds | Saturated seconds | Saturation percentage |
|---|---|---|---|
| A | 6540 | 20 | 0.305810% |
| B | 6542 | 25 | 0.382146% |
| C | 6541 | 19 | 0.290475% |
| D | 6540 | 101 | 1.544343% |
Noise dominated data is calculated using 1-second bins in cleaned event files. If a bin has >2000 counts, and if more than 50% of those come from <1% of pixels, then it is considered to be noise-dominated and hence unusable.
| Quadrant | # 1 sec bins | Bins with >0 counts | Bins with >2000 counts | High rate bins dominated by noise | Noise dominated (total time) | Noise dominated (detector-on time) | Marked lightcurve |
|---|---|---|---|---|---|---|---|
| A | 7650 | 6555 | 0 | 0 | 0.00% | 0.00% | 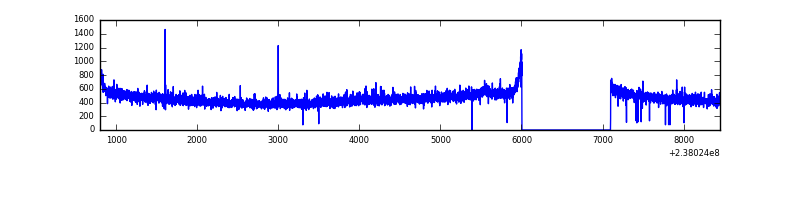 |
| B | 7650 | 6555 | 0 | 0 | 0.00% | 0.00% | 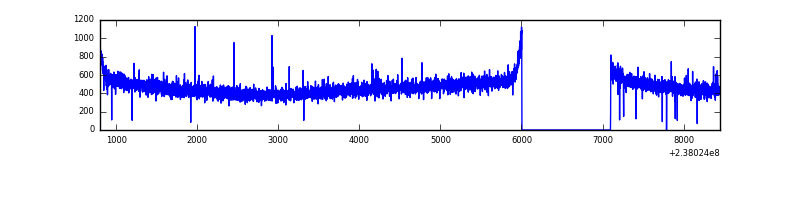 |
| C | 7650 | 6556 | 0 | 0 | 0.00% | 0.00% |  |
| D | 7650 | 6556 | 85 | 85 | 1.11% | 1.30% | 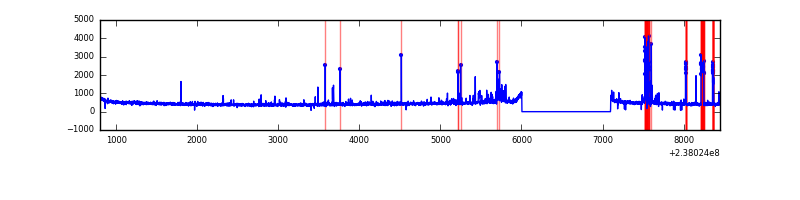 |
Top three noisy pixels from each quadrant. If the there are fewer than three noisy pixels in the level2.evt file, extra rows are filled as -1
| Pixel properties | Quadrant properties | ||||||
|---|---|---|---|---|---|---|---|
| Quadrant | DetID | PixID | Counts | Sigma | Mean | Median | Sigma |
| A | 15 | 239 | 14568 | 87.91 | 772 | 756 | 157.1 |
| A | 13 | 251 | 8449 | 48.97 | 772 | 756 | 157.1 |
| A | 0 | 226 | 6934 | 39.32 | 772 | 756 | 157.1 |
| B | 12 | 111 | 17569 | 113.93 | 776 | 758 | 147.6 |
| B | 11 | 111 | 14333 | 92.0 | 776 | 758 | 147.6 |
| B | 14 | 111 | 11834 | 75.06 | 776 | 758 | 147.6 |
| C | 13 | 61 | 5565 | 27.33 | 755 | 760 | 175.8 |
| C | 9 | 237 | 3875 | 17.72 | 755 | 760 | 175.8 |
| C | 8 | 222 | 3044 | 12.99 | 755 | 760 | 175.8 |
| D | 1 | 52 | 235459 | 1214.27 | 739 | 722 | 193.3 |
| D | 13 | 137 | 130709 | 672.41 | 739 | 722 | 193.3 |
| D | 2 | 234 | 19457 | 96.91 | 739 | 722 | 193.3 |
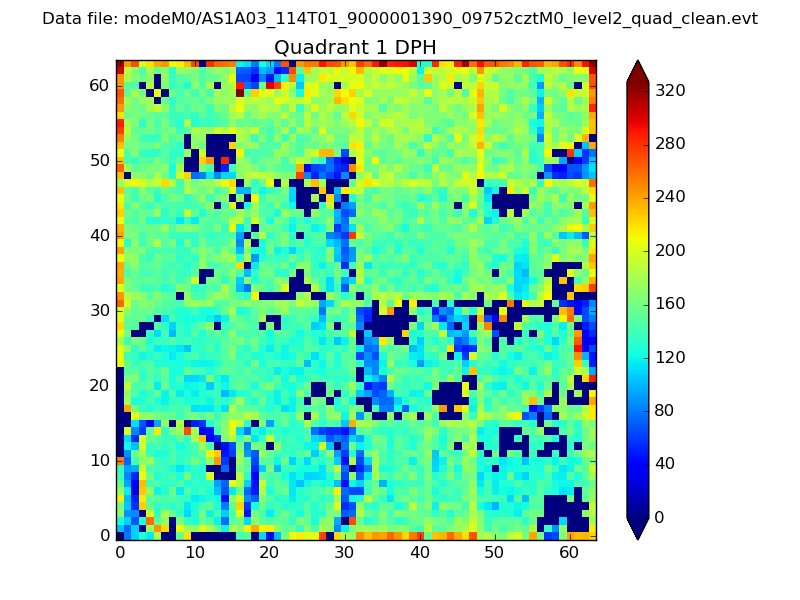
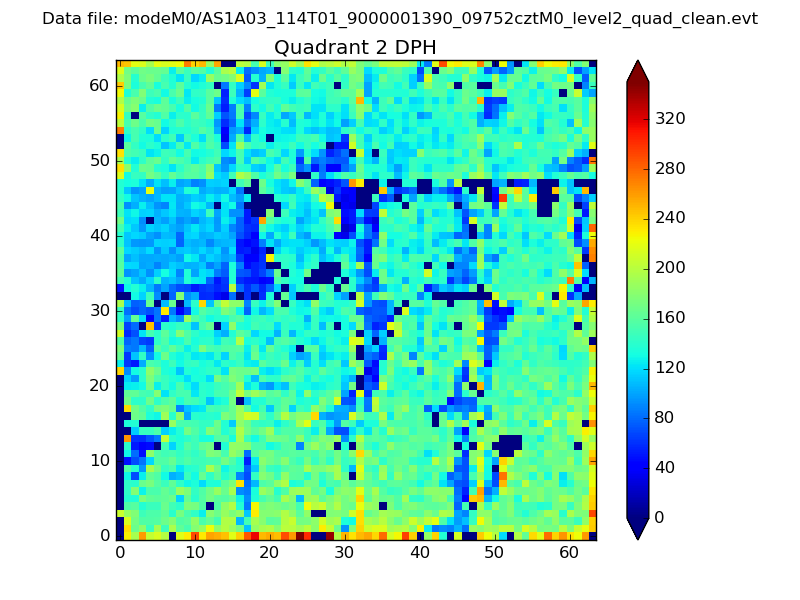
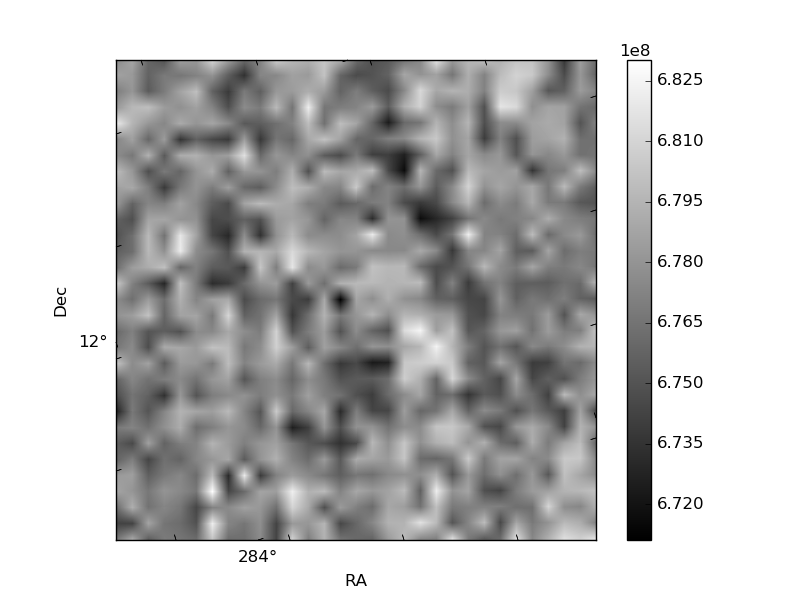
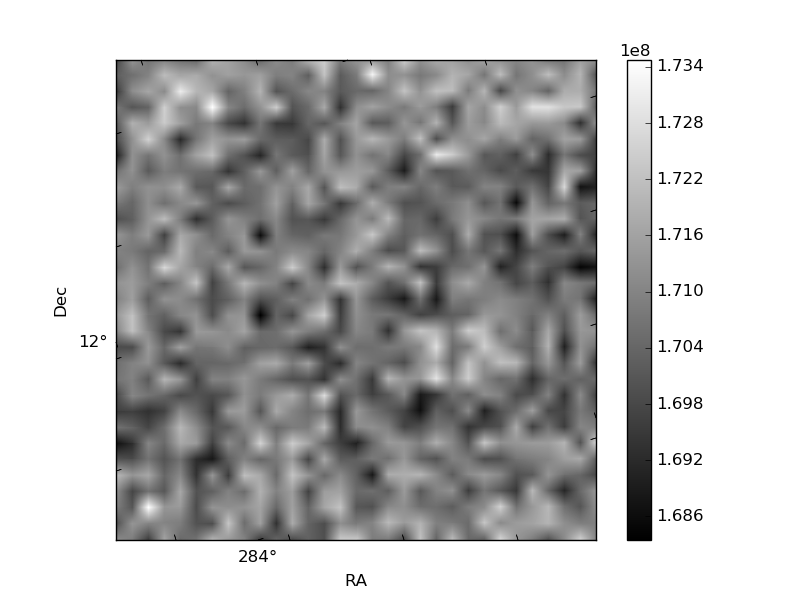
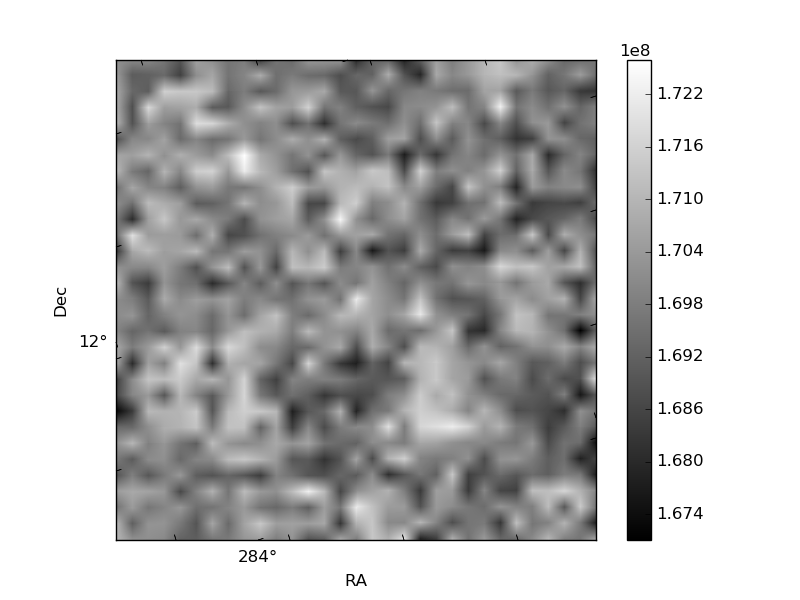
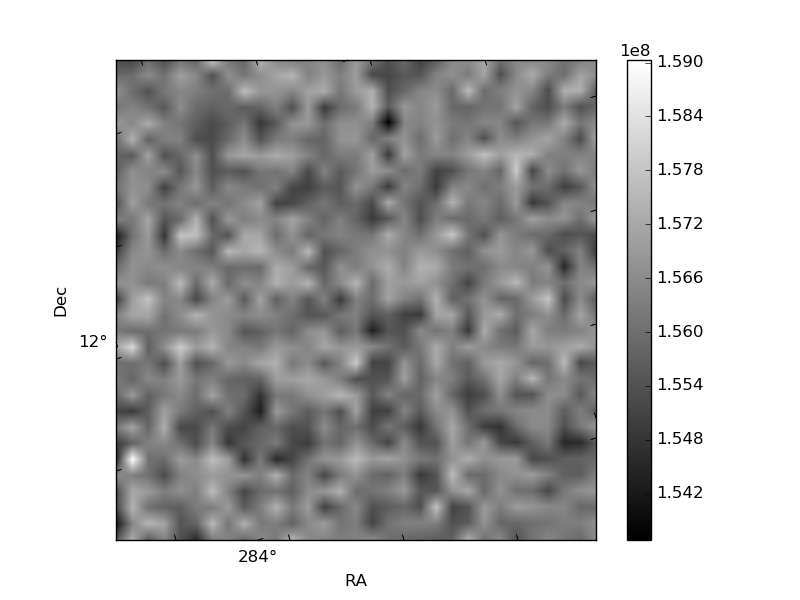
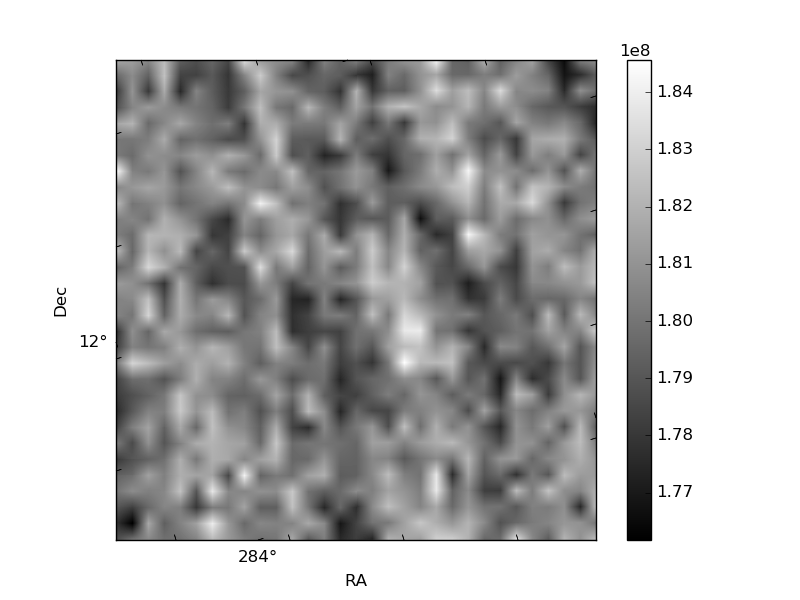
Histogram calculated using DETX and DETY for each event in the final _common_clean file
| Quadrant A | 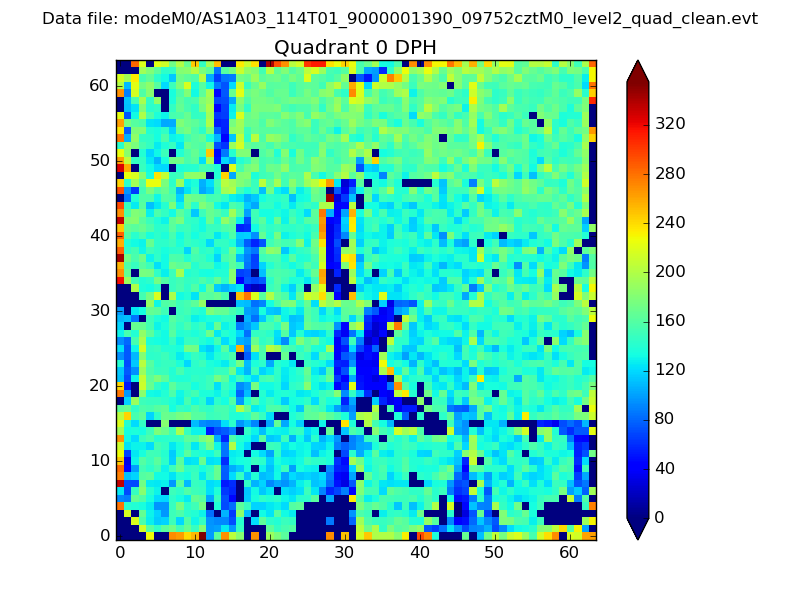 |
 |
Quadrant B |
|---|---|---|---|
| Quadrant D | 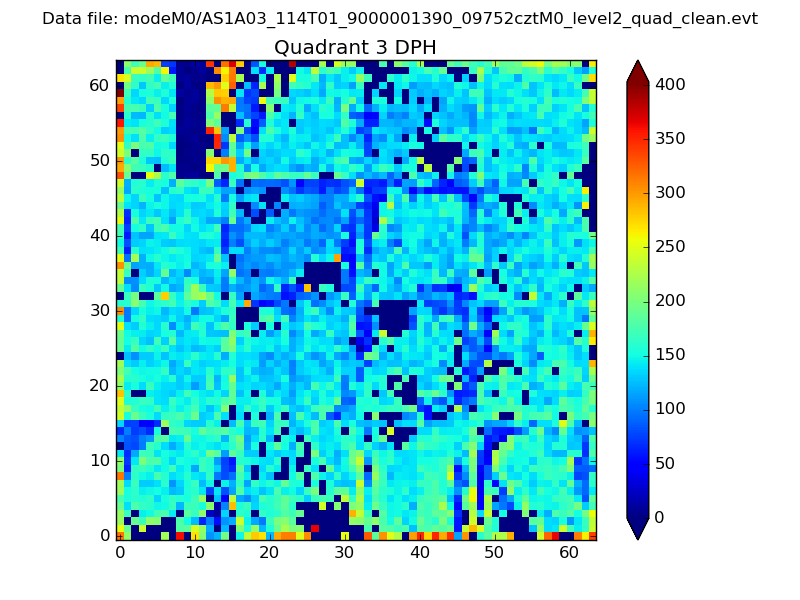 |
 |
Quadrant C |
| Plot type | Count rate plots | Images |
|---|---|---|
| Comparison with Poisson distribution Blue bars denote a histogram of data divided into 1 sec bins. Red curve is a Poisson curve with rate = median count rate of data. |
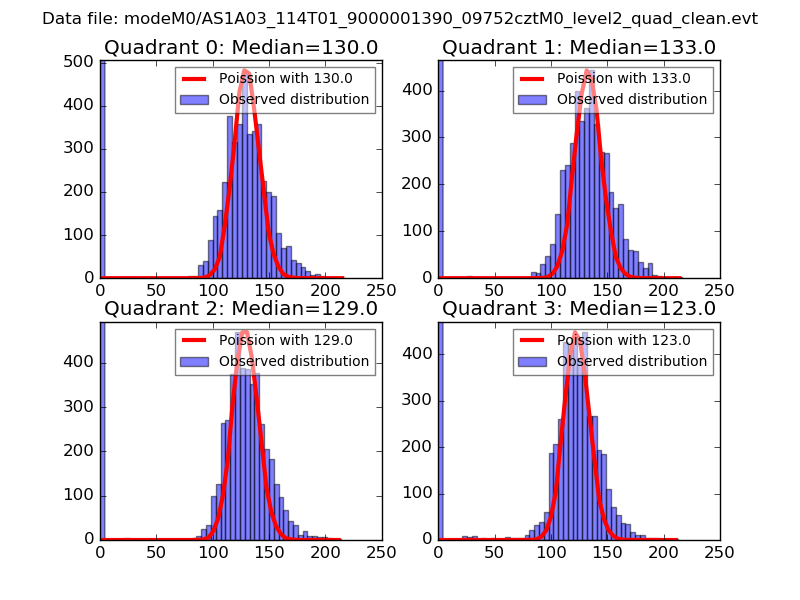 |
 |
| Quadrant-wise count rates Data is divided into 100 sec bins |
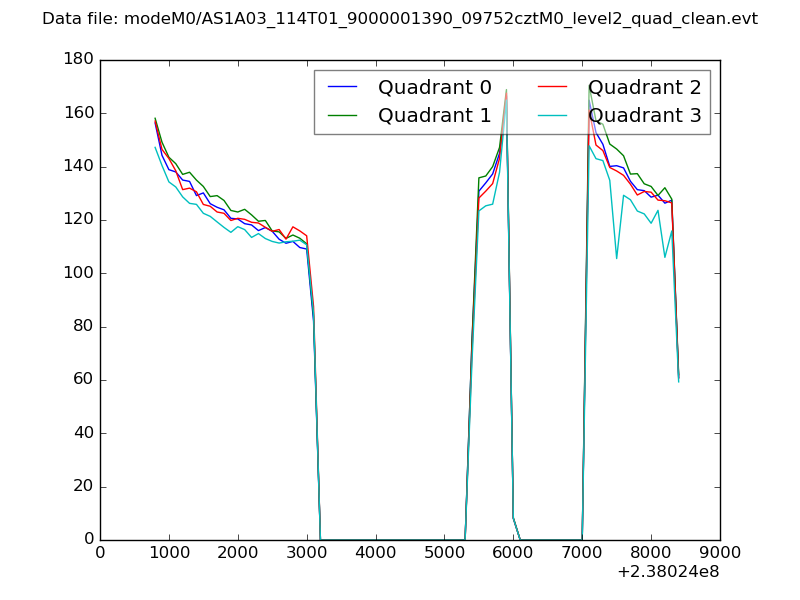 |
|
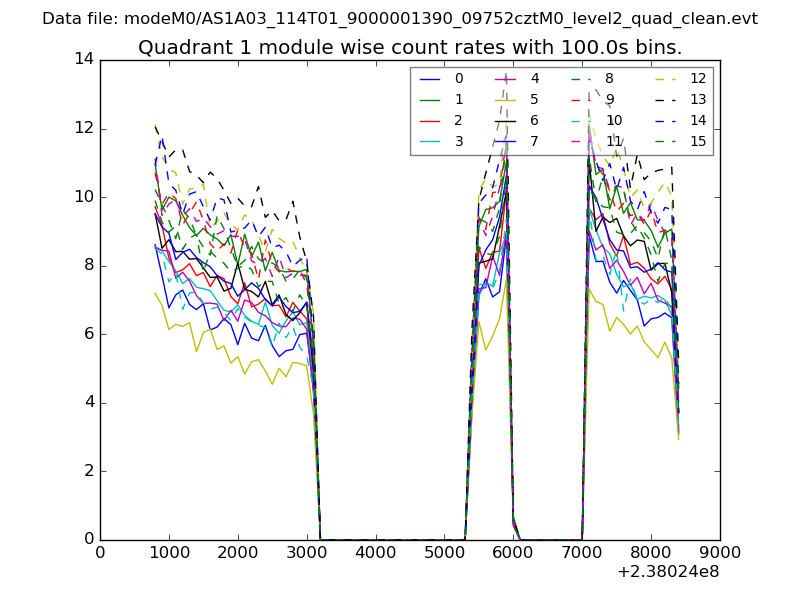
| Module-wise count rates for Quadrant A Data is divided into 100 sec bins |
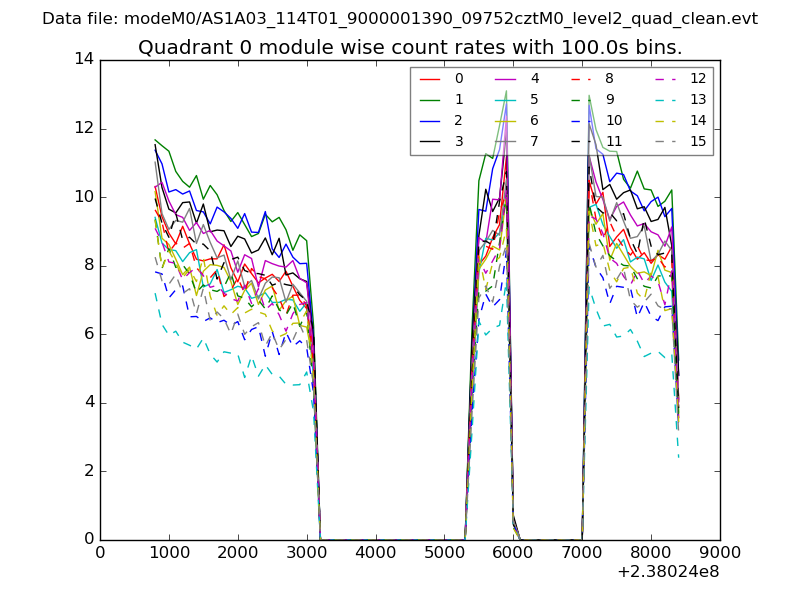 |
 |
| Module-wise count rates for Quadrant B Data is divided into 100 sec bins |
 |
 |
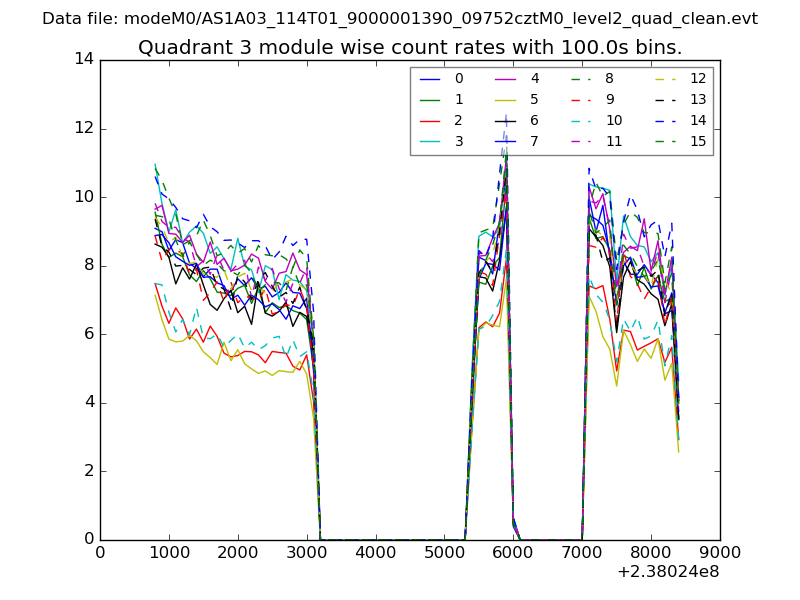
| Module-wise count rates for Quadrant C Data is divided into 100 sec bins |
 |
 |
| Module-wise count rates for Quadrant D Data is divided into 100 sec bins |
 |
 |
| Parameter | Plot |
|---|---|
| CZT HV Monitor | 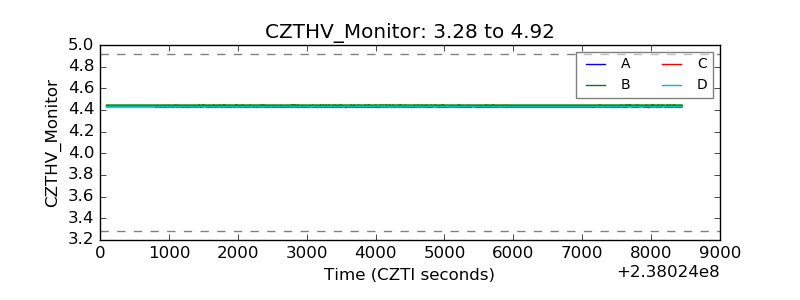 |
| D_VDD | 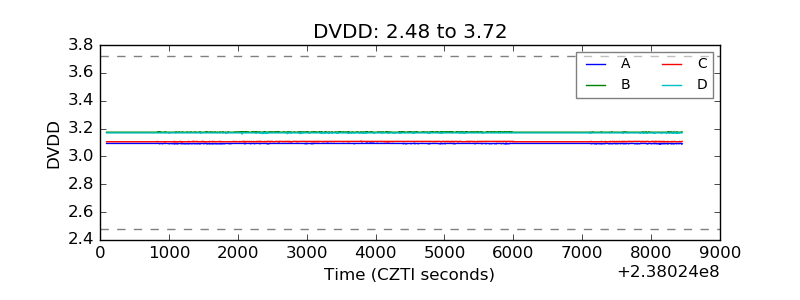 |
| Temperature 1 | 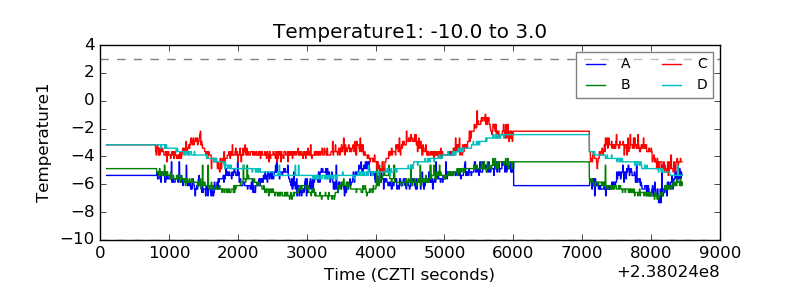 |
| Veto HV Monitor | 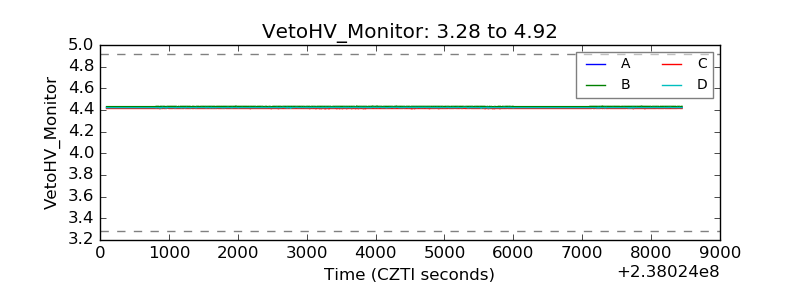 |
| Veto LLD | 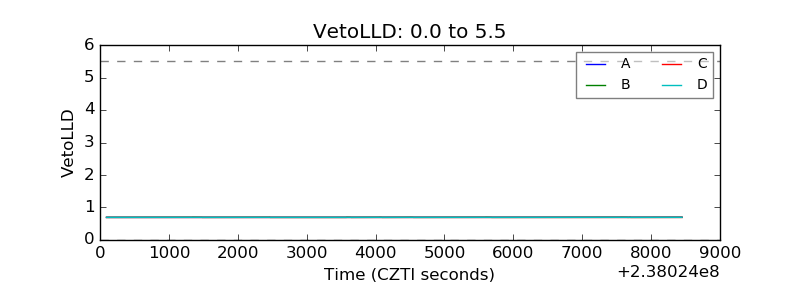 |
| Alpha Counter | 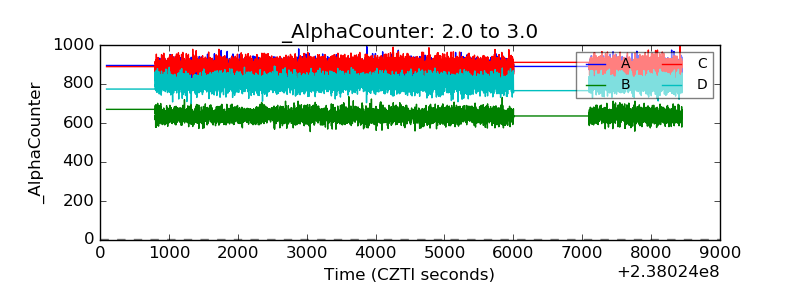 |
| _CPM_Rate | 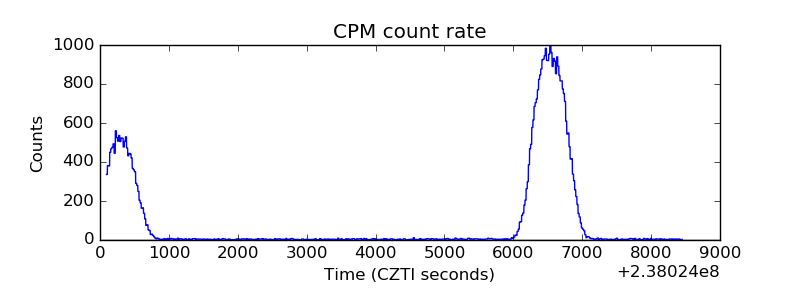 |
| CZT Counter | 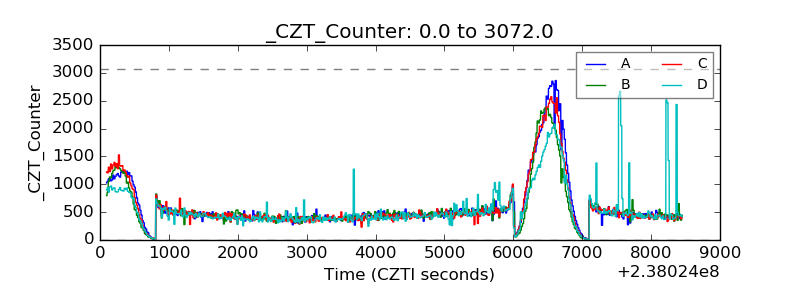 |
| +2.5 Volts monitor |  |
| +5 Volts monitor |  |
| _ROLL_ROT | 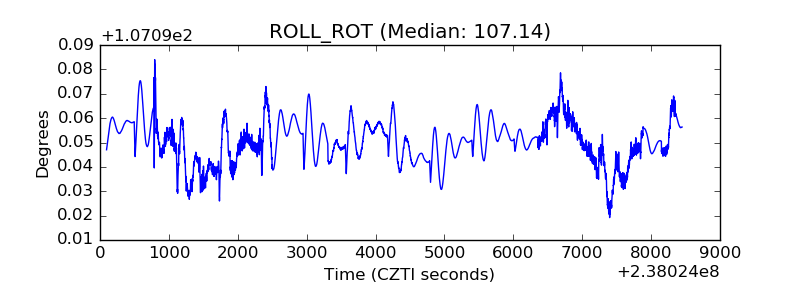 |
| _Roll_DEC | 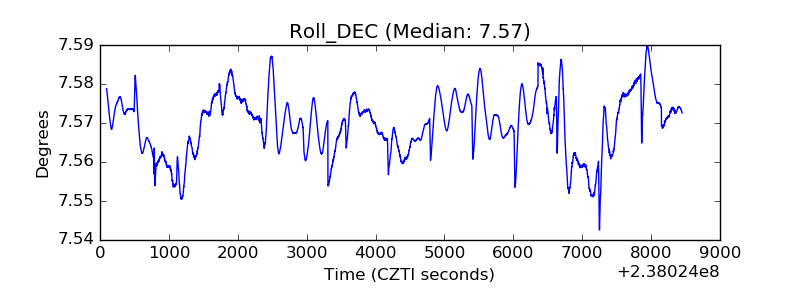 |
| _Roll_RA | 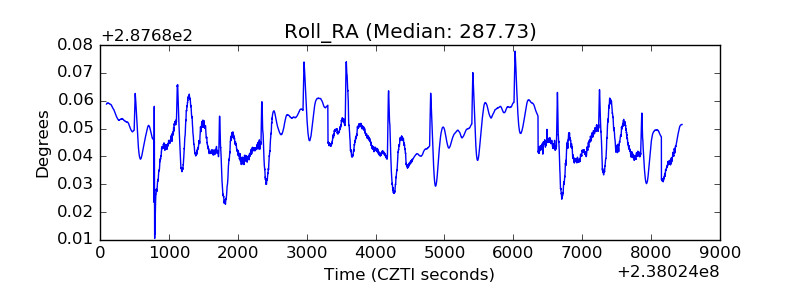 |
| Veto Counter | 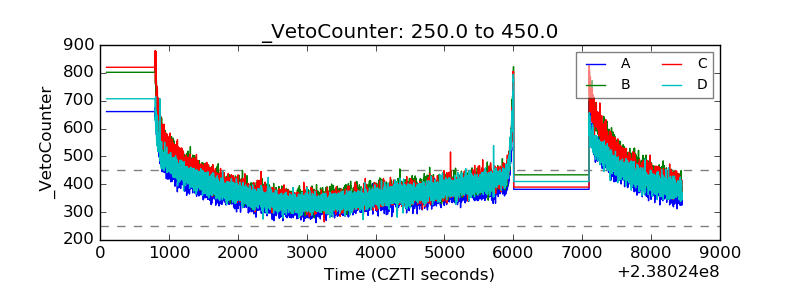 |