| Param | Original file | Final file |
|---|---|---|
| Filename | modeM0/AS1A03_080T01_9000001392cztM0_level2.fits | modeM0/AS1A03_080T01_9000001392cztM0_level2_quad_clean.evt |
| Size (bytes) | 114,788,160 | 82,632,960 |
| Size | 109.5 MB | 78.8 MB |
| Events in quadrant A | 699,974 | 441,624 |
| Events in quadrant B | 684,522 | 449,887 |
| Events in quadrant C | 710,010 | 439,853 |
| Events in quadrant D | 610,238 | 398,249 |
| Mode M0 | |||
|---|---|---|---|
| Quadrant | BADHDUFLAG | Total packets | Discarded packets |
| A | 0 | 22846 | 0 |
| B | 0 | 23687 | 0 |
| C | 0 | 23181 | 0 |
| D | 0 | 26670 | 0 |
| Mode M9 | |||
|---|---|---|---|
| Quadrant | BADHDUFLAG | Total packets | Discarded packets |
| A | 0 | 34 | 0 |
| B | 0 | 34 | 0 |
| C | 0 | 34 | 0 |
| D | 0 | 35 | 0 |
| Mode SS | |||
|---|---|---|---|
| Quadrant | BADHDUFLAG | Total packets | Discarded packets |
| A | 0 | 228 | 0 |
| B | 0 | 228 | 0 |
| C | 0 | 228 | 0 |
| D | 0 | 228 | 0 |
| Quadrant | Total seconds | Saturated seconds | Saturation percentage |
|---|---|---|---|
| A | 11150 | 93 | 0.834081% |
| B | 11150 | 162 | 1.452915% |
| C | 11150 | 109 | 0.977578% |
| D | 11150 | 200 | 1.793722% |
Noise dominated data is calculated using 1-second bins in cleaned event files. If a bin has >2000 counts, and if more than 50% of those come from <1% of pixels, then it is considered to be noise-dominated and hence unusable.
| Quadrant | # 1 sec bins | Bins with >0 counts | Bins with >2000 counts | High rate bins dominated by noise | Noise dominated (total time) | Noise dominated (detector-on time) | Marked lightcurve |
|---|---|---|---|---|---|---|---|
| A | 13769 | 11149 | 0 | 0 | 0.00% | 0.00% | 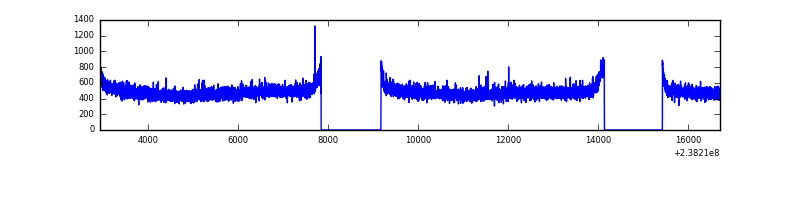 |
| B | 13769 | 11149 | 0 | 0 | 0.00% | 0.00% |  |
| C | 13769 | 11148 | 0 | 0 | 0.00% | 0.00% | 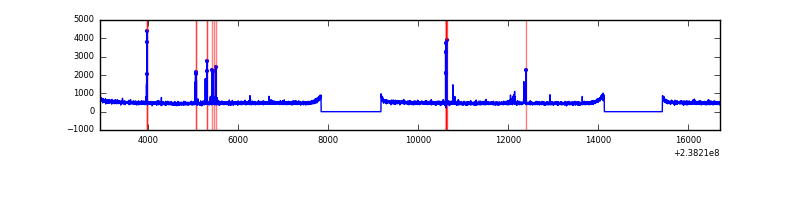 |
| D | 13769 | 11149 | 0 | 0 | 0.00% | 0.00% | 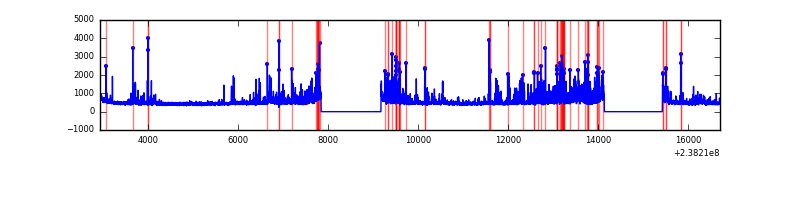 |
Top three noisy pixels from each quadrant. If the there are fewer than three noisy pixels in the level2.evt file, extra rows are filled as -1
| Pixel properties | Quadrant properties | ||||||
|---|---|---|---|---|---|---|---|
| Quadrant | DetID | PixID | Counts | Sigma | Mean | Median | Sigma |
| A | 0 | 29 | 716 | 11.56 | 182 | 172 | 47.1 |
| A | 0 | 30 | 576 | 8.58 | 182 | 172 | 47.1 |
| A | 7 | 110 | 563 | 8.31 | 182 | 172 | 47.1 |
| B | 2 | 9 | 611 | 11.83 | 180 | 173 | 37.0 |
| B | 3 | 17 | 488 | 8.5 | 180 | 173 | 37.0 |
| B | 2 | 8 | 443 | 7.28 | 180 | 173 | 37.0 |
| C | 1 | 81 | 503 | 6.66 | 187 | 176 | 49.1 |
| C | 1 | 80 | 503 | 6.66 | 187 | 176 | 49.1 |
| C | 2 | 191 | 492 | 6.44 | 187 | 176 | 49.1 |
| D | 3 | 14 | 463 | 6.42 | 173 | 158 | 47.5 |
| D | 6 | 231 | 453 | 6.21 | 173 | 158 | 47.5 |
| D | 10 | 189 | 446 | 6.06 | 173 | 158 | 47.5 |
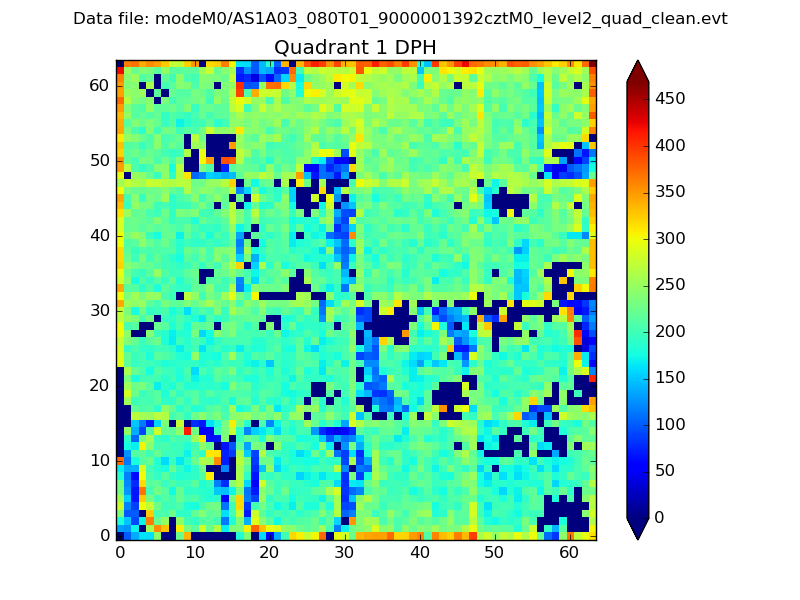
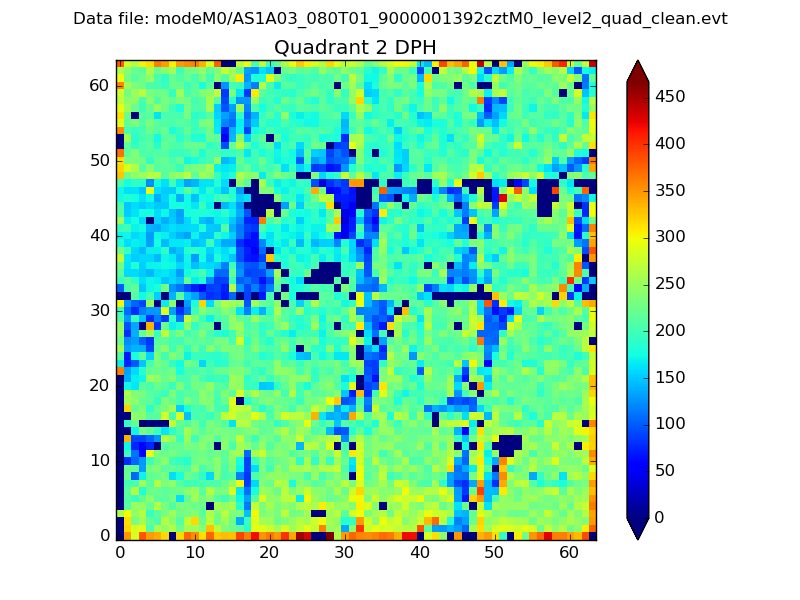
Histogram calculated using DETX and DETY for each event in the final _common_clean file
| Quadrant A | 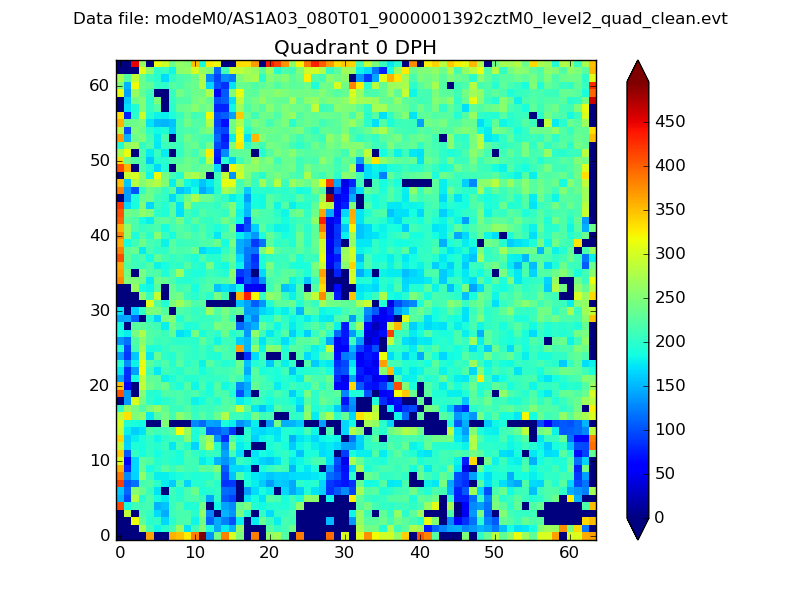 |
 |
Quadrant B |
|---|---|---|---|
| Quadrant D | 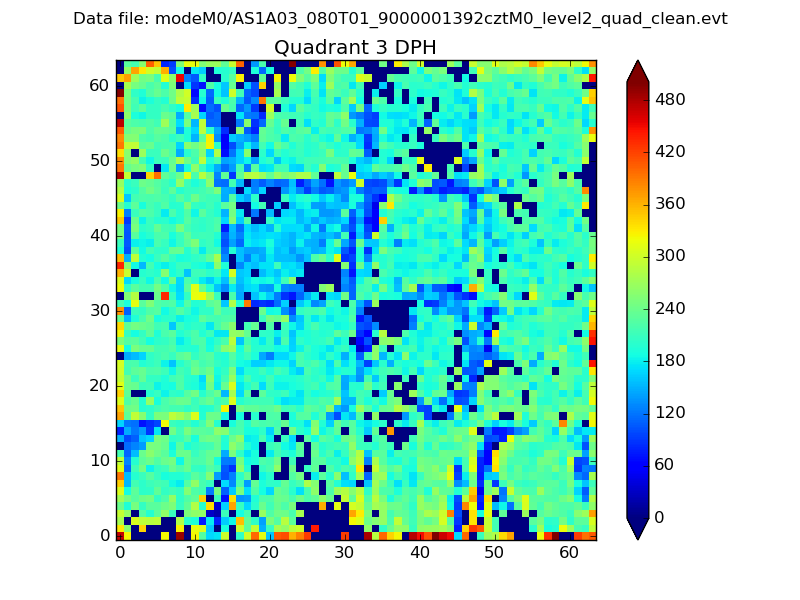 |
 |
Quadrant C |
| Plot type | Count rate plots | Images |
|---|---|---|
| Comparison with Poisson distribution Blue bars denote a histogram of data divided into 1 sec bins. Red curve is a Poisson curve with rate = median count rate of data. |
 |
 |
| Quadrant-wise count rates Data is divided into 100 sec bins |
 |
|
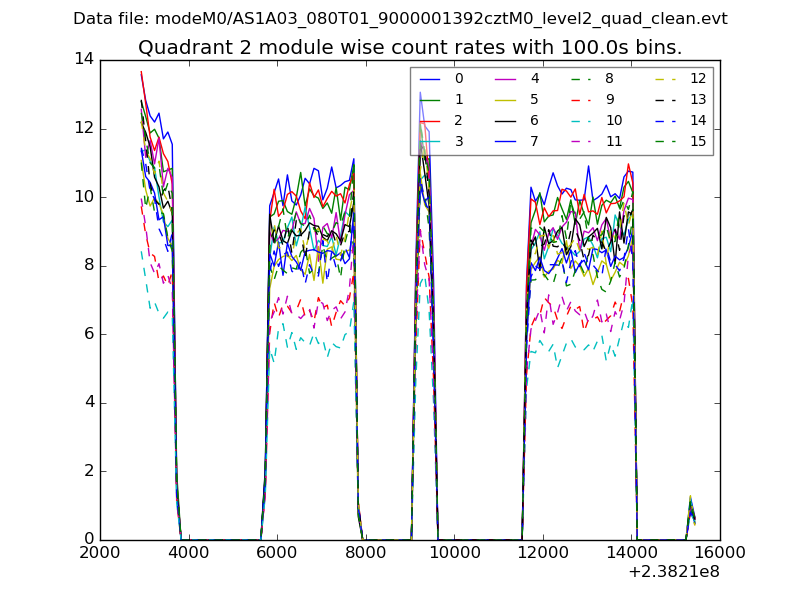
| Module-wise count rates for Quadrant A Data is divided into 100 sec bins |
 |
 |
| Module-wise count rates for Quadrant B Data is divided into 100 sec bins |
 |
 |
| Module-wise count rates for Quadrant C Data is divided into 100 sec bins |
 |
 |
| Module-wise count rates for Quadrant D Data is divided into 100 sec bins |
 |
 |
| Parameter | Plot |
|---|---|
| CZT HV Monitor |  |
| D_VDD | 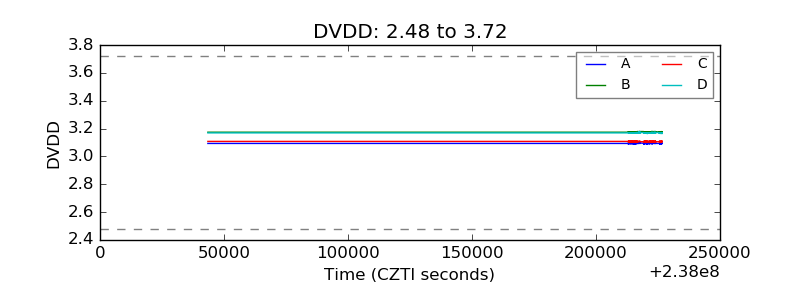 |
| Temperature 1 |  |
| Veto HV Monitor |  |
| Veto LLD | 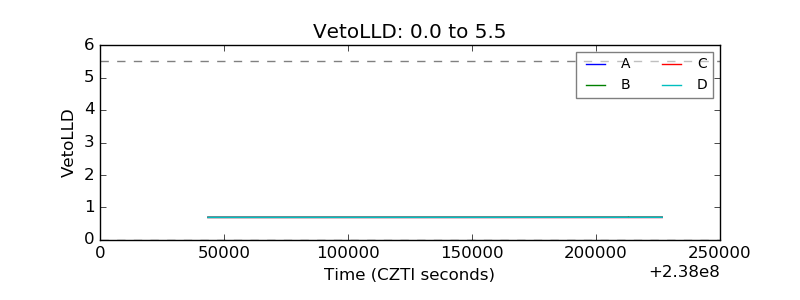 |
| Alpha Counter |  |
| _CPM_Rate | 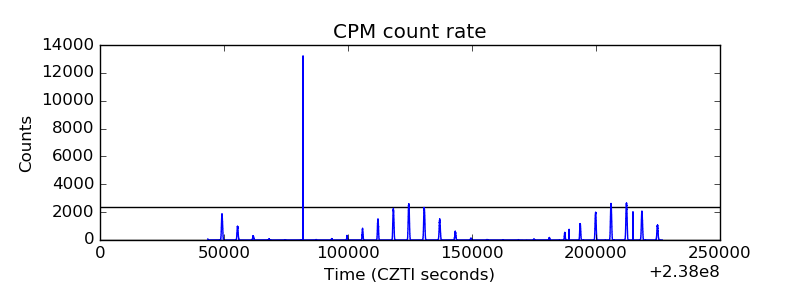 |
| CZT Counter | 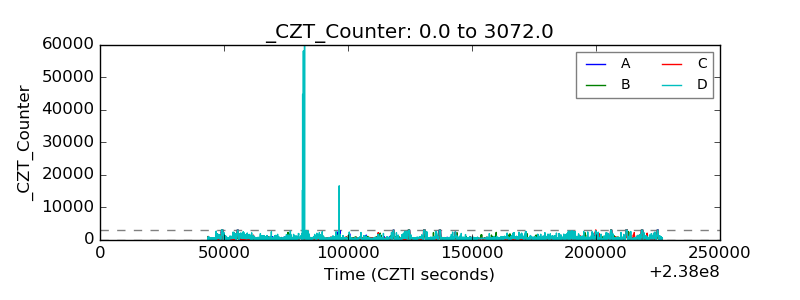 |
| +2.5 Volts monitor |  |
| +5 Volts monitor | 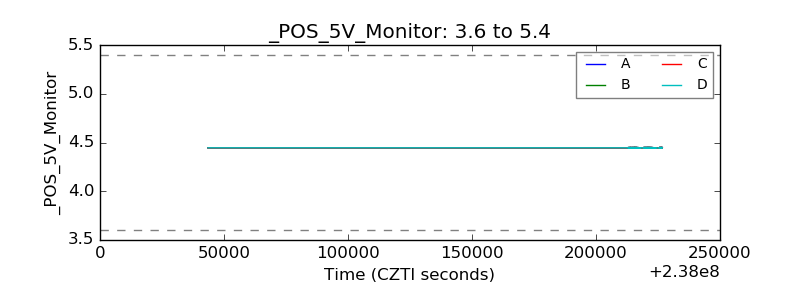 |
| _ROLL_ROT | 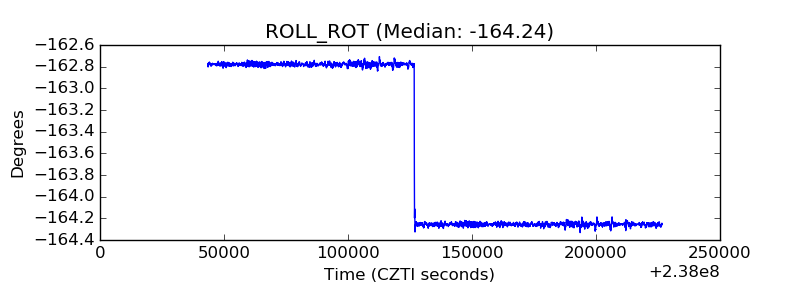 |
| _Roll_DEC |  |
| _Roll_RA | 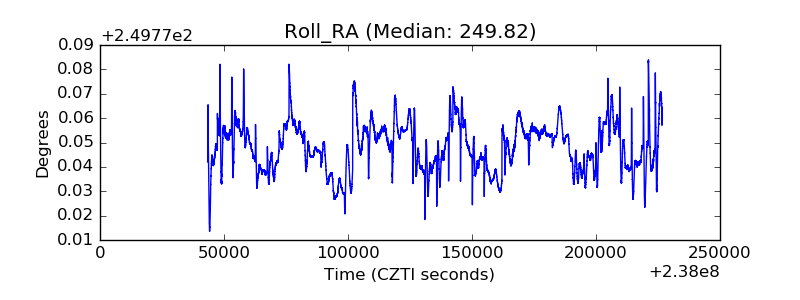 |
| Veto Counter | 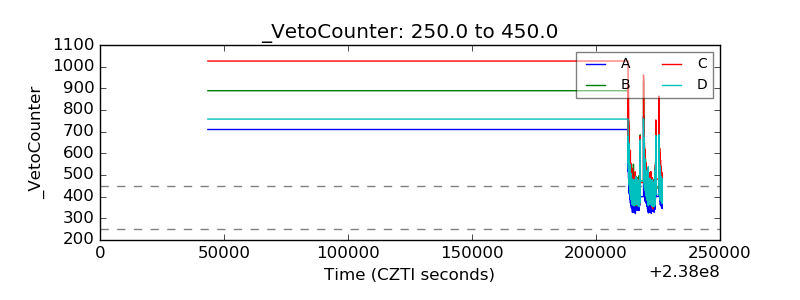 |