| Param | Original file | Final file |
|---|---|---|
| Filename | modeM0/AS1A03_080T01_9000001392_09755cztM0_level2.evt | modeM0/AS1A03_080T01_9000001392_09755cztM0_level2_quad_clean.evt |
| Size (bytes) | 460,494,720 | 72,167,040 |
| Size | 439.2 MB | 68.8 MB |
| Events in quadrant A | 3,047,990 | 436,711 |
| Events in quadrant B | 3,189,500 | 448,697 |
| Events in quadrant C | 3,069,613 | 446,668 |
| Events in quadrant D | 4,205,932 | 408,082 |
| Mode M0 | |||
|---|---|---|---|
| Quadrant | BADHDUFLAG | Total packets | Discarded packets |
| A | 0 | 13034 | 4 |
| B | 0 | 13312 | 3 |
| C | 0 | 13068 | 3 |
| D | 0 | 16718 | 3 |
| Mode M9 | |||
|---|---|---|---|
| Quadrant | BADHDUFLAG | Total packets | Discarded packets |
| A | 0 | 13 | 0 |
| B | 0 | 13 | 0 |
| C | 0 | 13 | 0 |
| D | 0 | 14 | 0 |
| Mode SS | |||
|---|---|---|---|
| Quadrant | BADHDUFLAG | Total packets | Discarded packets |
| A | 0 | 132 | 0 |
| B | 0 | 132 | 0 |
| C | 0 | 132 | 0 |
| D | 0 | 132 | 0 |
| Quadrant | Total seconds | Saturated seconds | Saturation percentage |
|---|---|---|---|
| A | 6368 | 13 | 0.204146% |
| B | 6368 | 22 | 0.345477% |
| C | 6368 | 19 | 0.298367% |
| D | 6368 | 209 | 3.282035% |
Noise dominated data is calculated using 1-second bins in cleaned event files. If a bin has >2000 counts, and if more than 50% of those come from <1% of pixels, then it is considered to be noise-dominated and hence unusable.
| Quadrant | # 1 sec bins | Bins with >0 counts | Bins with >2000 counts | High rate bins dominated by noise | Noise dominated (total time) | Noise dominated (detector-on time) | Marked lightcurve |
|---|---|---|---|---|---|---|---|
| A | 7723 | 6370 | 0 | 0 | 0.00% | 0.00% | 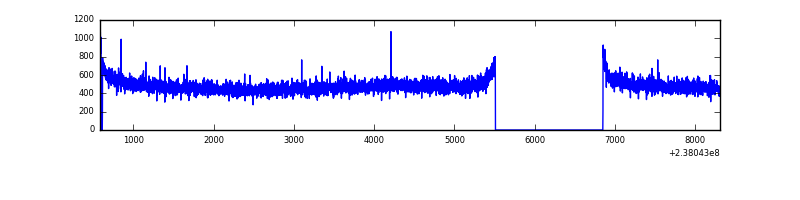 |
| B | 7723 | 6370 | 1 | 1 | 0.01% | 0.02% |  |
| C | 7723 | 6370 | 2 | 2 | 0.03% | 0.03% |  |
| D | 7723 | 6370 | 155 | 155 | 2.01% | 2.43% |  |
Top three noisy pixels from each quadrant. If the there are fewer than three noisy pixels in the level2.evt file, extra rows are filled as -1
| Pixel properties | Quadrant properties | ||||||
|---|---|---|---|---|---|---|---|
| Quadrant | DetID | PixID | Counts | Sigma | Mean | Median | Sigma |
| A | 0 | 226 | 7326 | 41.26 | 791 | 776 | 158.7 |
| A | 12 | 194 | 6464 | 35.83 | 791 | 776 | 158.7 |
| A | 3 | 137 | 3456 | 16.88 | 791 | 776 | 158.7 |
| B | 0 | 214 | 55900 | 367.59 | 803 | 784 | 149.9 |
| B | 12 | 111 | 16297 | 103.46 | 803 | 784 | 149.9 |
| B | 11 | 111 | 13409 | 84.2 | 803 | 784 | 149.9 |
| C | 14 | 234 | 12958 | 68.28 | 783 | 788 | 178.2 |
| C | 13 | 61 | 5729 | 27.72 | 783 | 788 | 178.2 |
| C | 14 | 67 | 2965 | 12.21 | 783 | 788 | 178.2 |
| D | 1 | 52 | 1057327 | 5672.44 | 760 | 741 | 186.3 |
| D | 13 | 137 | 215619 | 1153.6 | 760 | 741 | 186.3 |
| D | 2 | 234 | 20659 | 106.93 | 760 | 741 | 186.3 |
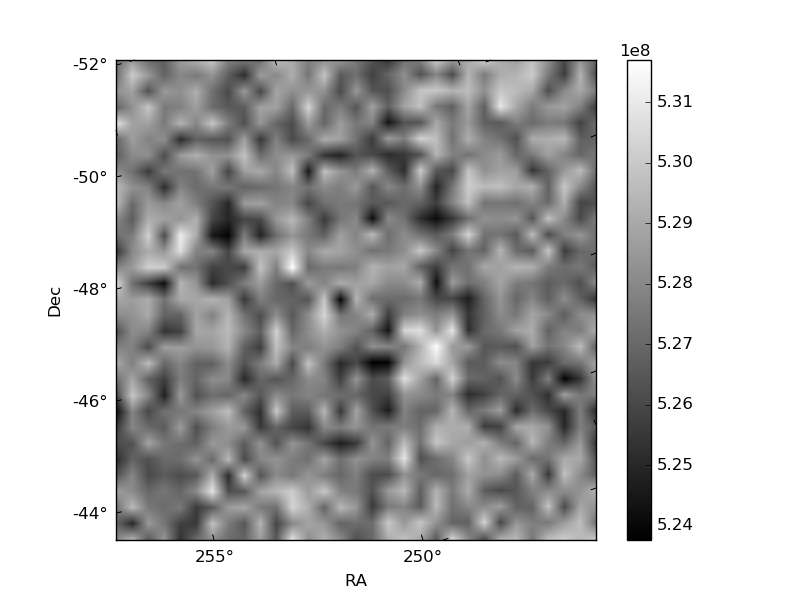
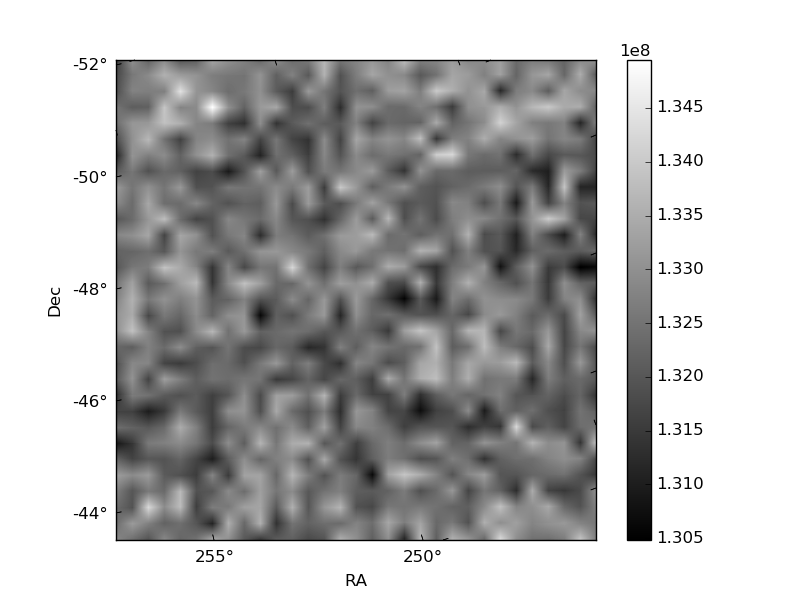
Histogram calculated using DETX and DETY for each event in the final _common_clean file
| Quadrant A | 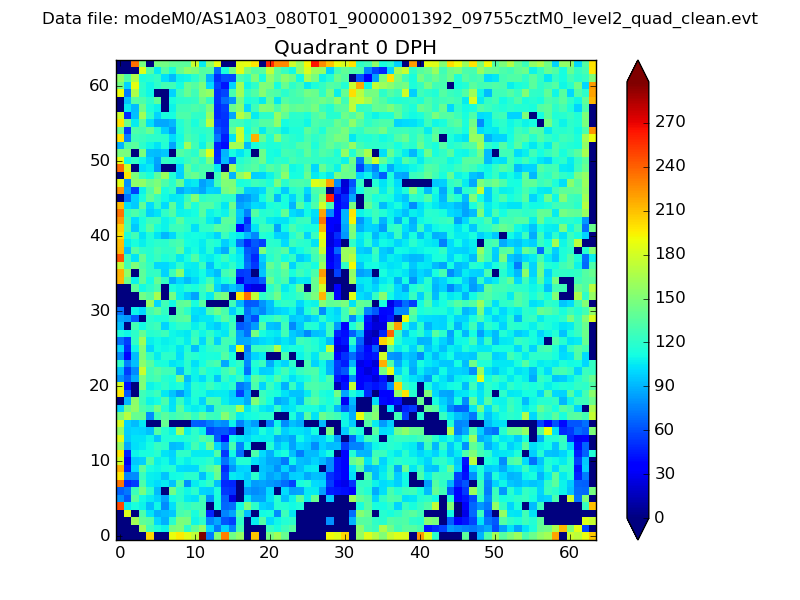 |
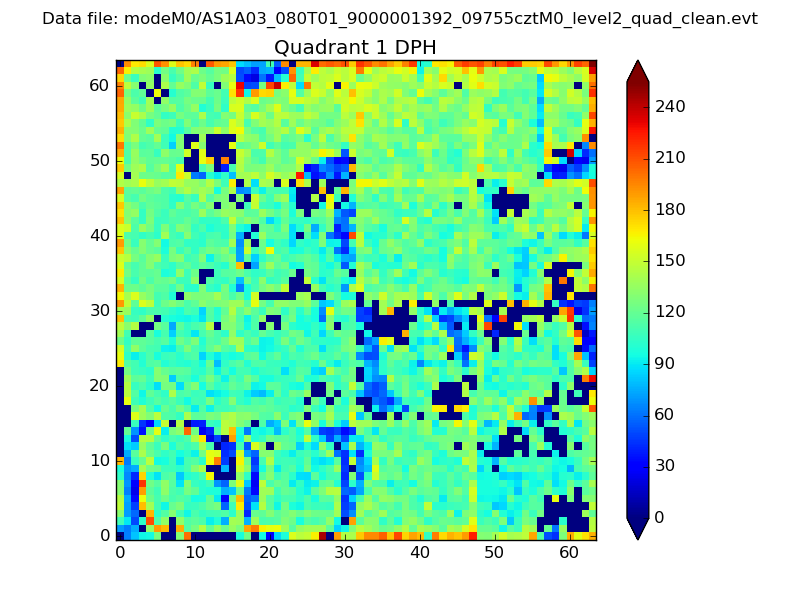 |
Quadrant B |
|---|---|---|---|
| Quadrant D | 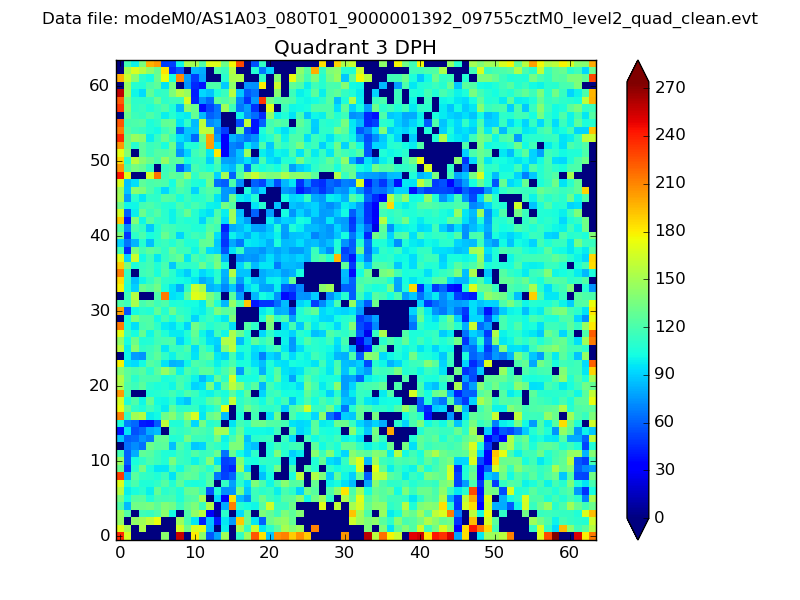 |
 |
Quadrant C |
| Plot type | Count rate plots | Images |
|---|---|---|
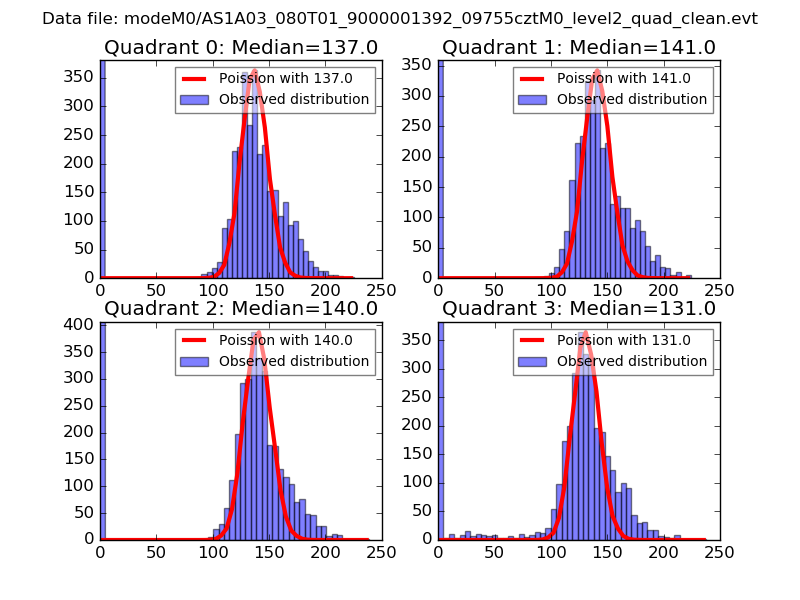
| Comparison with Poisson distribution Blue bars denote a histogram of data divided into 1 sec bins. Red curve is a Poisson curve with rate = median count rate of data. |
 |
 |
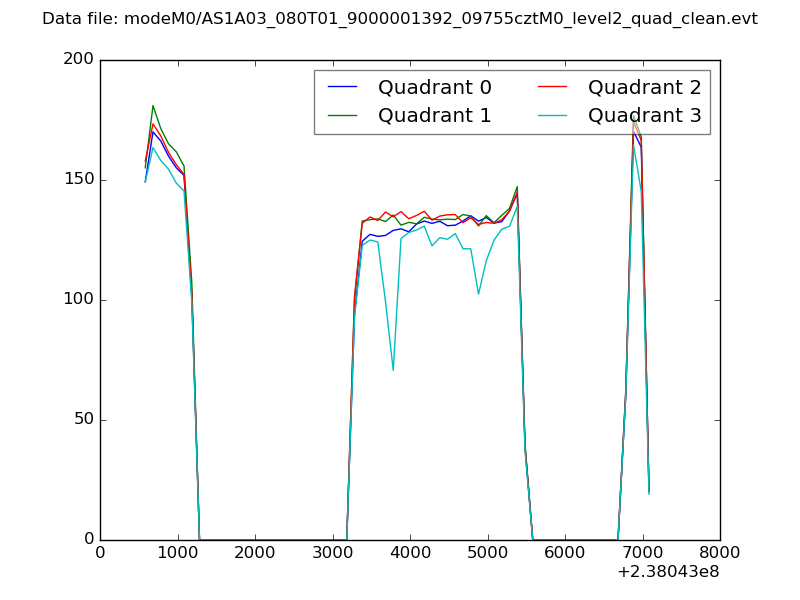
| Quadrant-wise count rates Data is divided into 100 sec bins |
 |
|
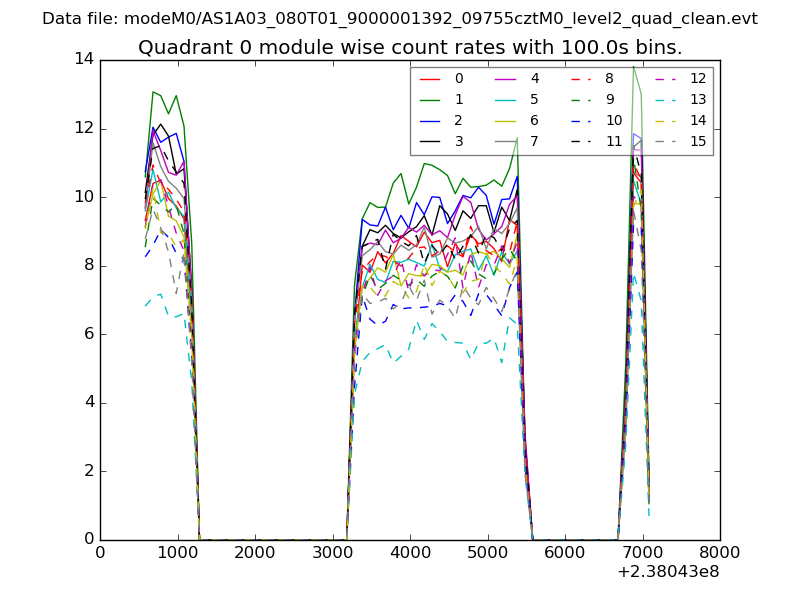
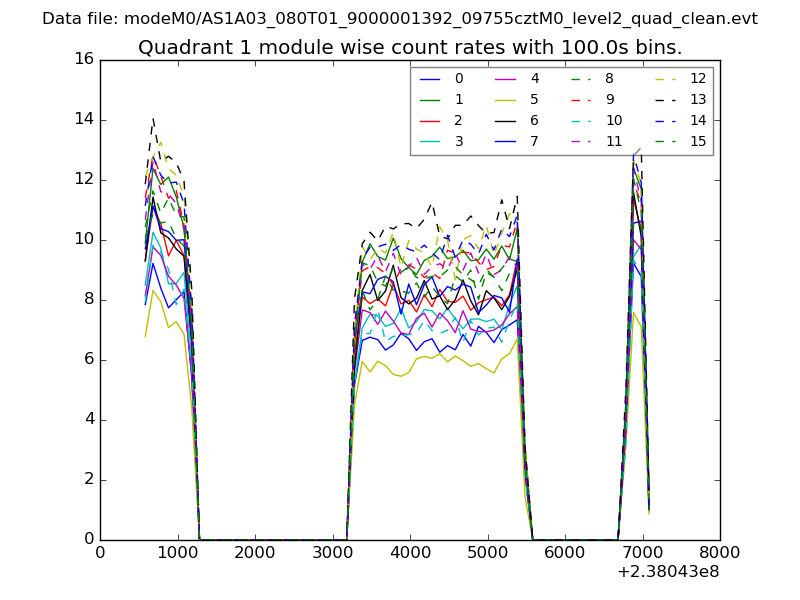
| Module-wise count rates for Quadrant A Data is divided into 100 sec bins |
 |
 |
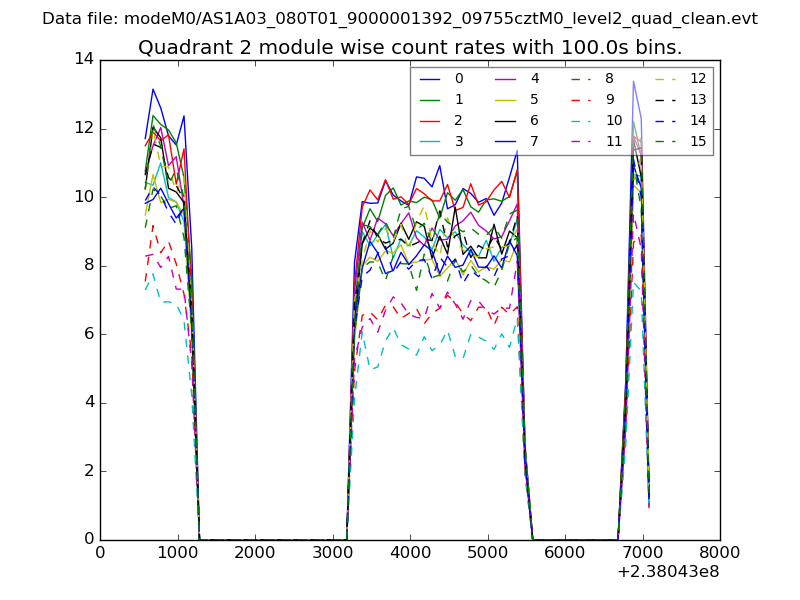
| Module-wise count rates for Quadrant B Data is divided into 100 sec bins |
 |
 |
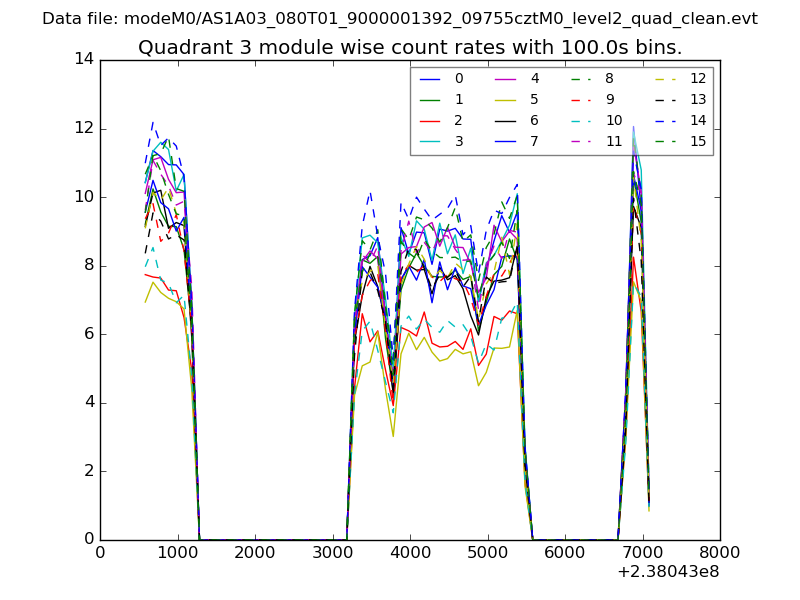
| Module-wise count rates for Quadrant C Data is divided into 100 sec bins |
 |
 |
| Module-wise count rates for Quadrant D Data is divided into 100 sec bins |
 |
 |
| Parameter | Plot |
|---|---|
| CZT HV Monitor | 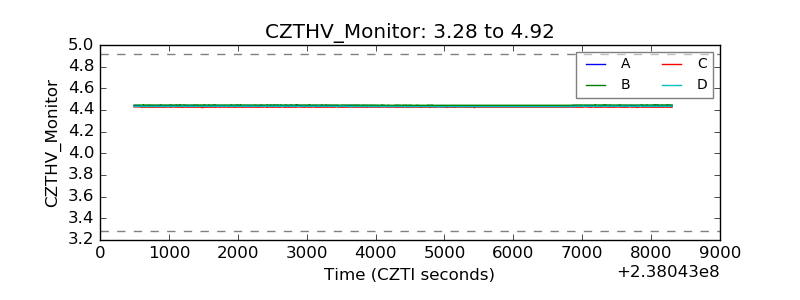 |
| D_VDD | 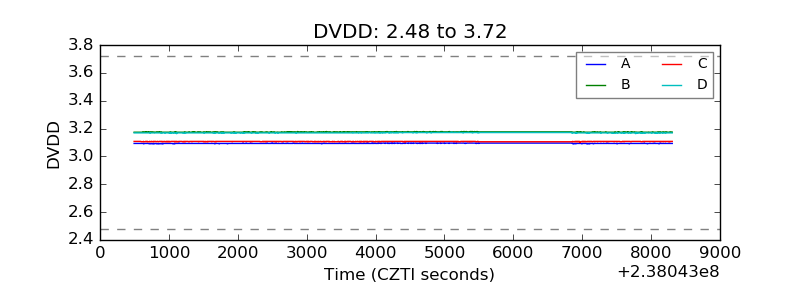 |
| Temperature 1 | 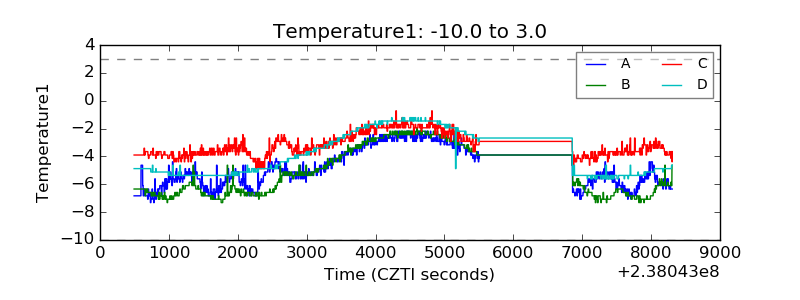 |
| Veto HV Monitor | 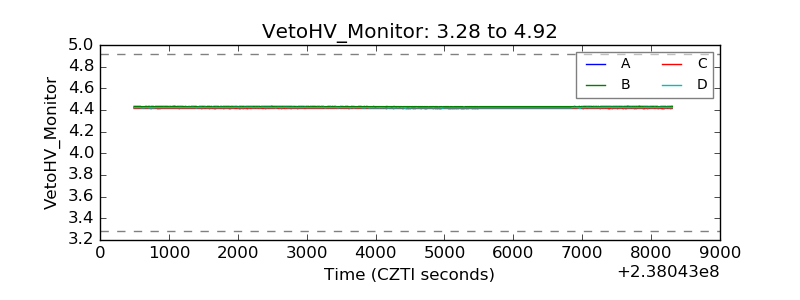 |
| Veto LLD | 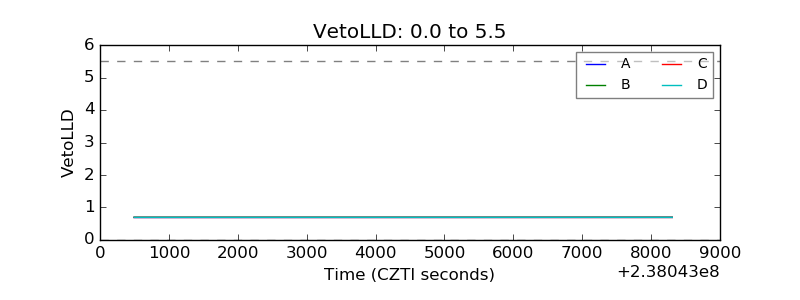 |
| Alpha Counter | 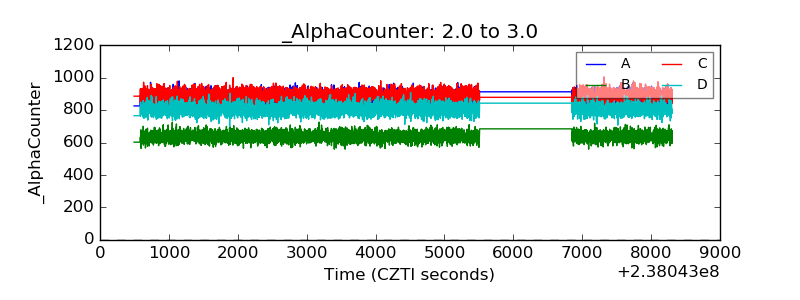 |
| _CPM_Rate | 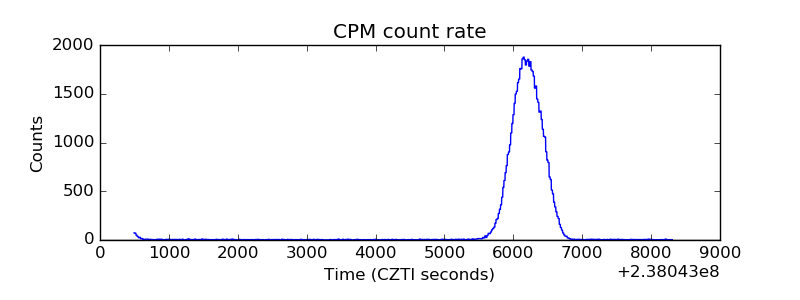 |
| CZT Counter |  |
| +2.5 Volts monitor |  |
| +5 Volts monitor | 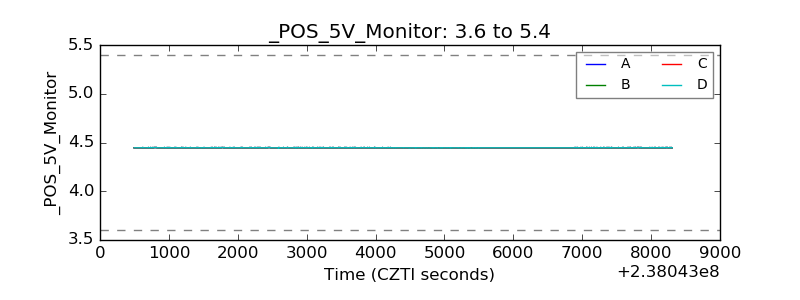 |
| _ROLL_ROT | 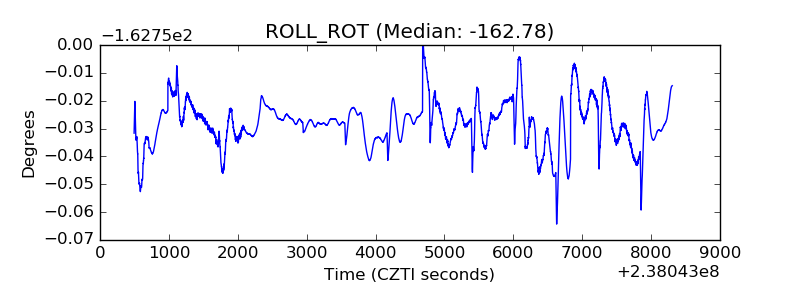 |
| _Roll_DEC | 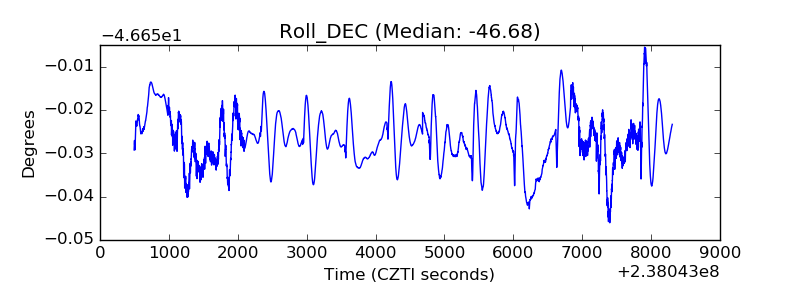 |
| _Roll_RA | 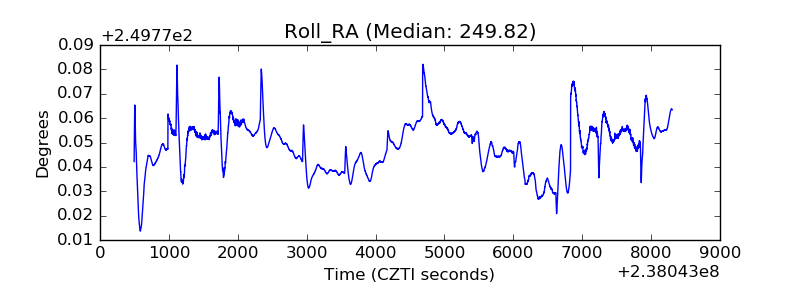 |
| Veto Counter | 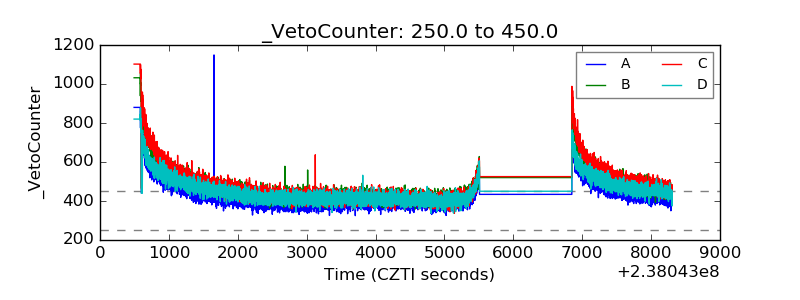 |