| Param | Original file | Final file |
|---|---|---|
| Filename | modeM0/AS1A03_080T01_9000001392_09757cztM0_level2.evt | modeM0/AS1A03_080T01_9000001392_09757cztM0_level2_quad_clean.evt |
| Size (bytes) | 490,392,000 | 68,221,440 |
| Size | 467.7 MB | 65.1 MB |
| Events in quadrant A | 2,980,493 | 412,464 |
| Events in quadrant B | 3,128,913 | 411,968 |
| Events in quadrant C | 2,948,236 | 412,110 |
| Events in quadrant D | 5,365,540 | 388,783 |
| Mode M0 | |||
|---|---|---|---|
| Quadrant | BADHDUFLAG | Total packets | Discarded packets |
| A | 0 | 13213 | 178 |
| B | 0 | 13475 | 250 |
| C | 0 | 13221 | 246 |
| D | 0 | 21127 | 901 |
| Mode M9 | |||
|---|---|---|---|
| Quadrant | BADHDUFLAG | Total packets | Discarded packets |
| A | 0 | 19 | 0 |
| B | 0 | 19 | 0 |
| C | 0 | 19 | 0 |
| D | 0 | 20 | 0 |
| Mode SS | |||
|---|---|---|---|
| Quadrant | BADHDUFLAG | Total packets | Discarded packets |
| A | 0 | 130 | 0 |
| B | 0 | 130 | 4 |
| C | 0 | 129 | 5 |
| D | 0 | 130 | 0 |
| Quadrant | Total seconds | Saturated seconds | Saturation percentage |
|---|---|---|---|
| A | 6351 | 56 | 0.881751% |
| B | 6320 | 65 | 1.028481% |
| C | 6316 | 47 | 0.744142% |
| D | 6250 | 223 | 3.568000% |
Noise dominated data is calculated using 1-second bins in cleaned event files. If a bin has >2000 counts, and if more than 50% of those come from <1% of pixels, then it is considered to be noise-dominated and hence unusable.
| Quadrant | # 1 sec bins | Bins with >0 counts | Bins with >2000 counts | High rate bins dominated by noise | Noise dominated (total time) | Noise dominated (detector-on time) | Marked lightcurve |
|---|---|---|---|---|---|---|---|
| A | 7538 | 6430 | 0 | 0 | 0.00% | 0.00% | 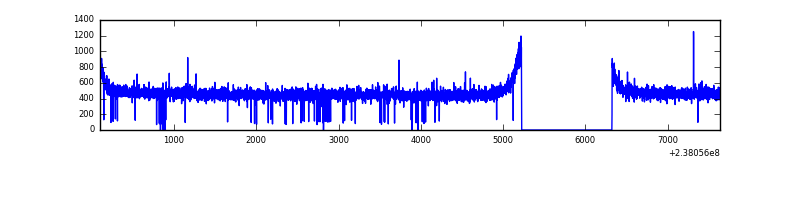 |
| B | 7538 | 6423 | 0 | 0 | 0.00% | 0.00% | 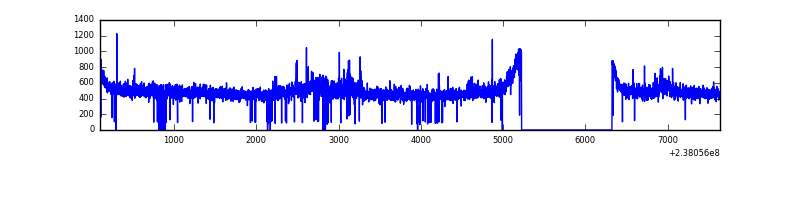 |
| C | 7538 | 6418 | 0 | 0 | 0.00% | 0.00% | 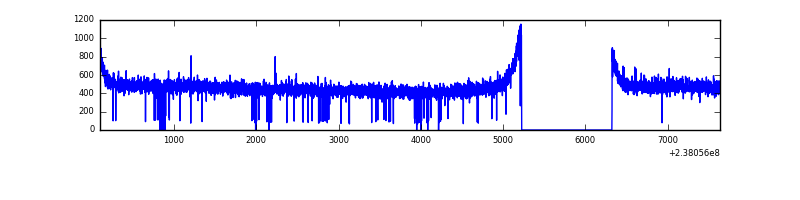 |
| D | 7538 | 6394 | 105 | 105 | 1.39% | 1.64% | 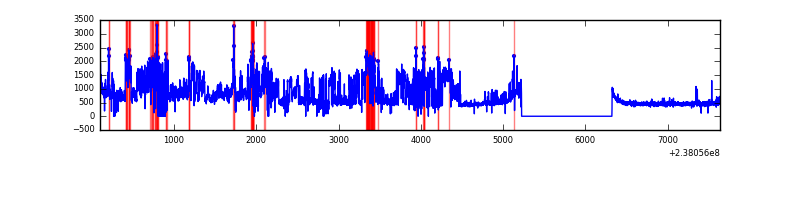 |
Top three noisy pixels from each quadrant. If the there are fewer than three noisy pixels in the level2.evt file, extra rows are filled as -1
| Pixel properties | Quadrant properties | ||||||
|---|---|---|---|---|---|---|---|
| Quadrant | DetID | PixID | Counts | Sigma | Mean | Median | Sigma |
| A | 0 | 226 | 7087 | 40.58 | 773 | 756 | 156.0 |
| A | 12 | 194 | 6494 | 36.78 | 773 | 756 | 156.0 |
| A | 13 | 253 | 5247 | 28.78 | 773 | 756 | 156.0 |
| B | 0 | 214 | 35368 | 236.66 | 774 | 756 | 146.3 |
| B | 0 | 187 | 29304 | 195.19 | 774 | 756 | 146.3 |
| B | 0 | 219 | 26538 | 176.28 | 774 | 756 | 146.3 |
| C | 13 | 61 | 5782 | 28.91 | 755 | 761 | 173.7 |
| C | 12 | 4 | 2535 | 10.21 | 755 | 761 | 173.7 |
| C | 14 | 67 | 2049 | 7.41 | 755 | 761 | 173.7 |
| D | 1 | 52 | 1348130 | 7558.14 | 735 | 719 | 178.3 |
| D | 13 | 137 | 1064991 | 5969.9 | 735 | 719 | 178.3 |
| D | 8 | 195 | 90325 | 502.63 | 735 | 719 | 178.3 |
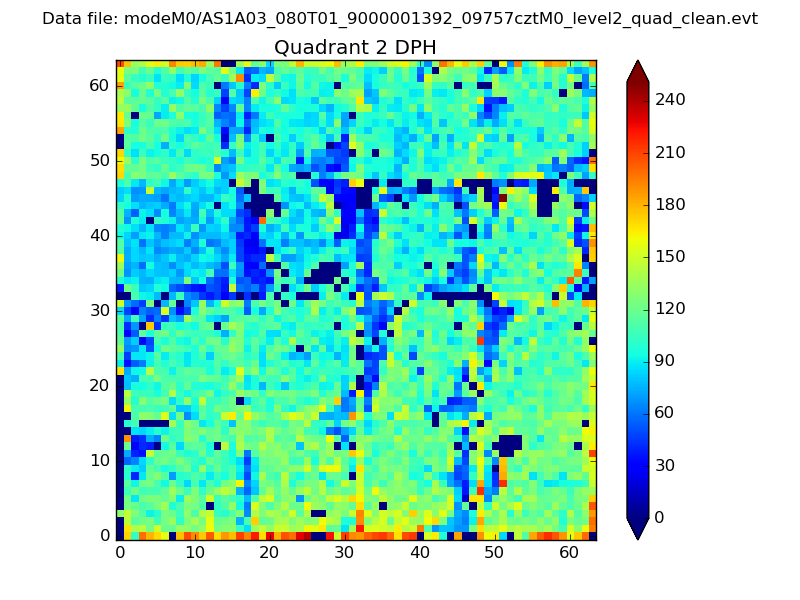
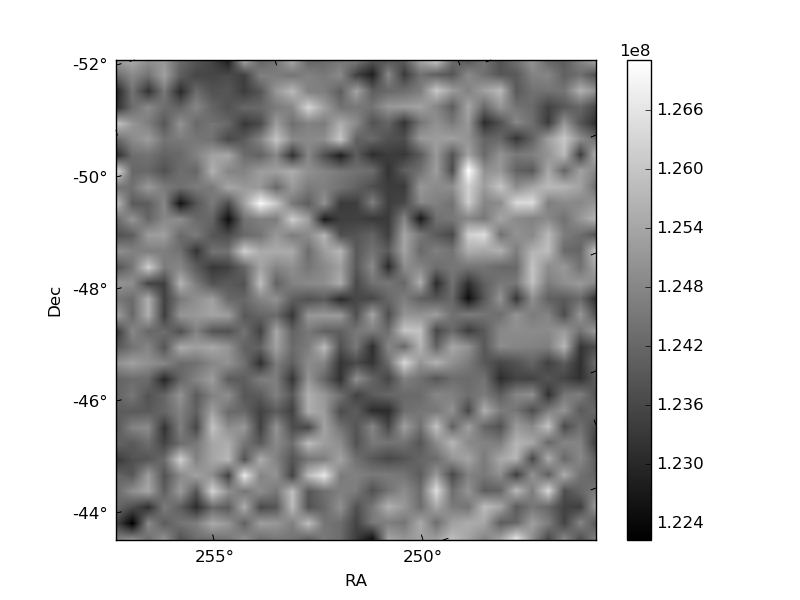
Histogram calculated using DETX and DETY for each event in the final _common_clean file
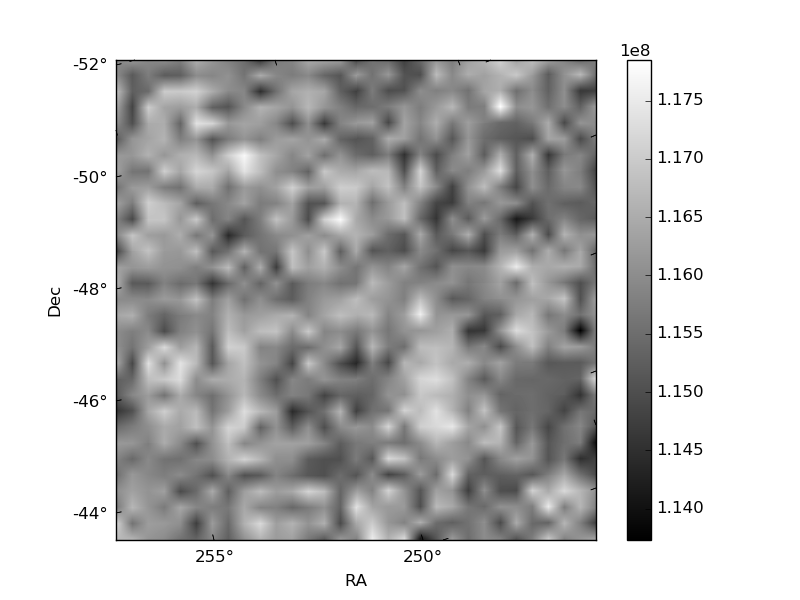
| Quadrant A | 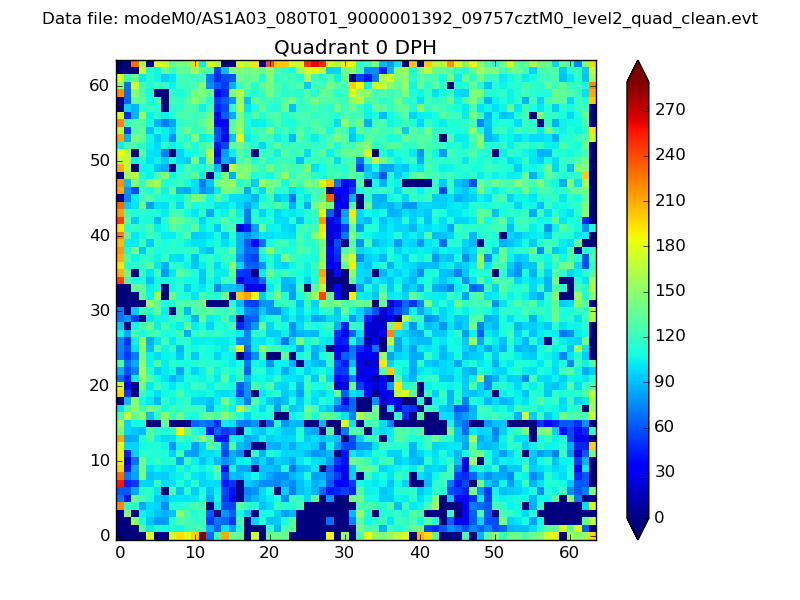 |
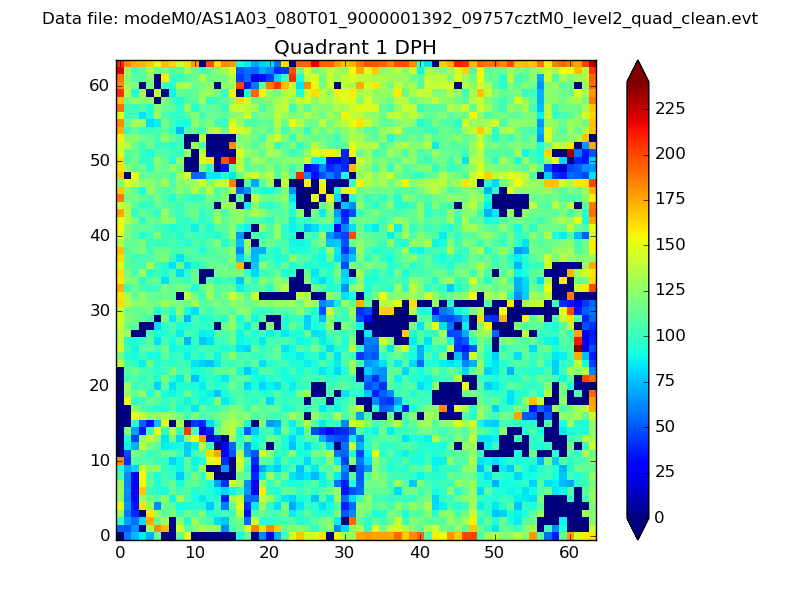 |
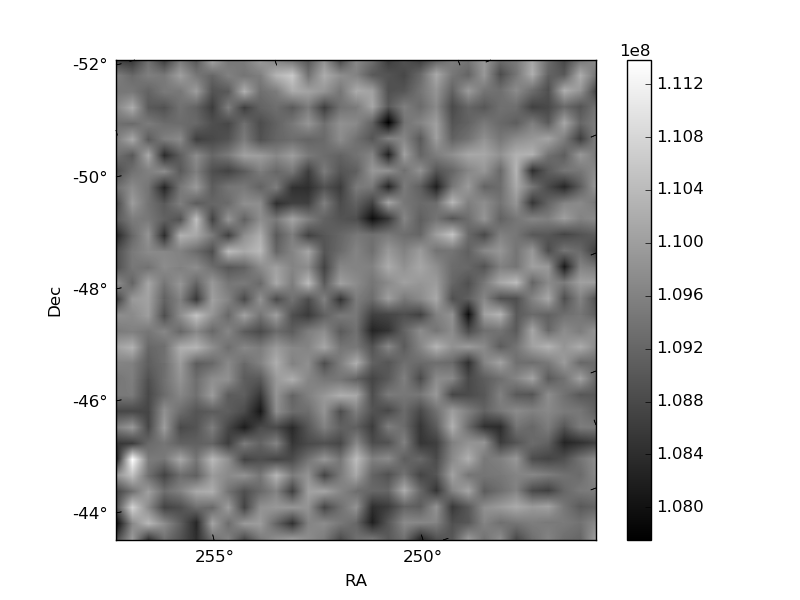
Quadrant B |
|---|---|---|---|
| Quadrant D | 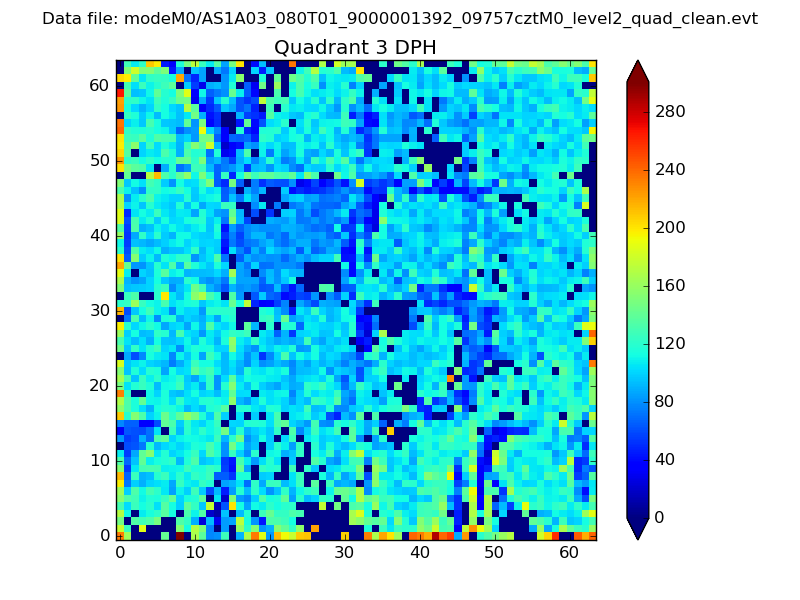 |
 |
Quadrant C |
| Plot type | Count rate plots | Images |
|---|---|---|
| Comparison with Poisson distribution Blue bars denote a histogram of data divided into 1 sec bins. Red curve is a Poisson curve with rate = median count rate of data. |
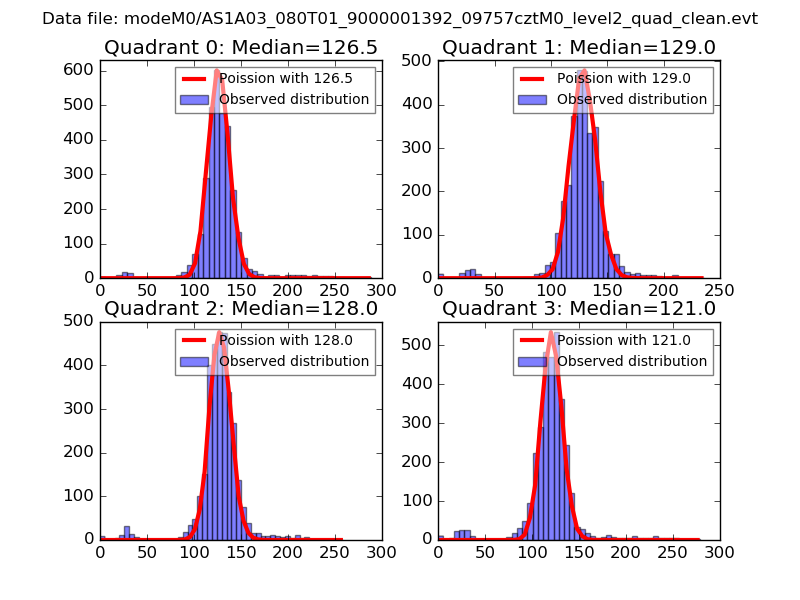 |
 |
| Quadrant-wise count rates Data is divided into 100 sec bins |
 |
|
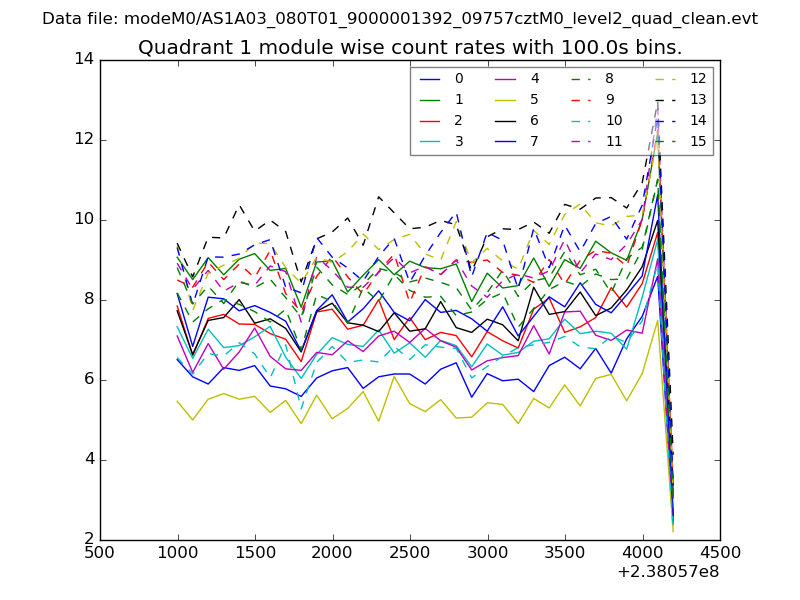
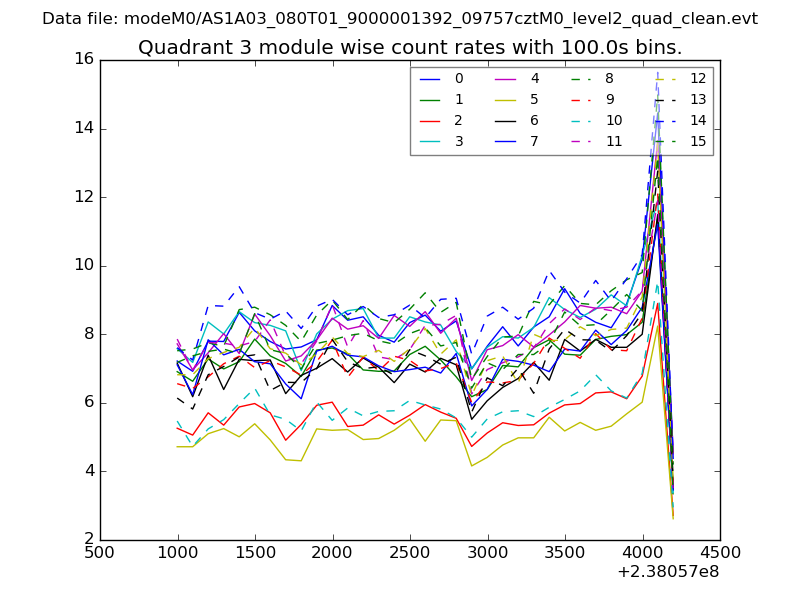
| Module-wise count rates for Quadrant A Data is divided into 100 sec bins |
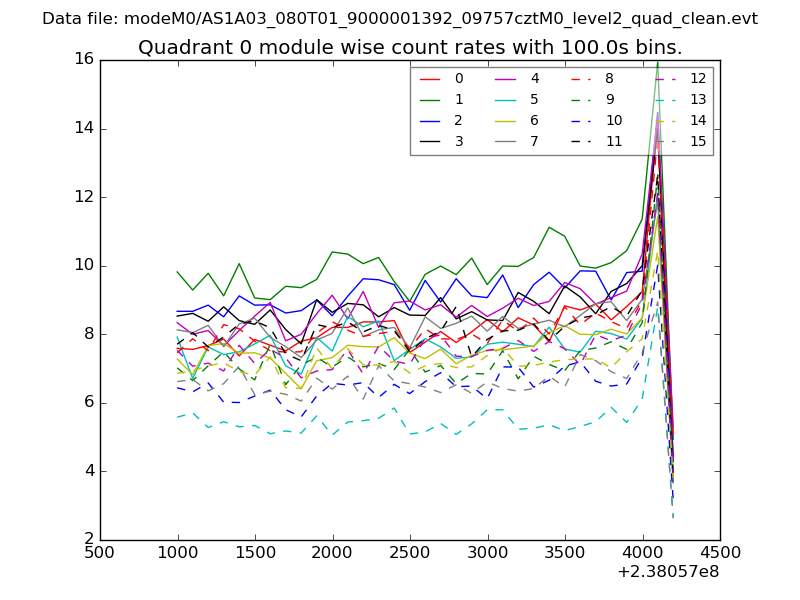 |
 |
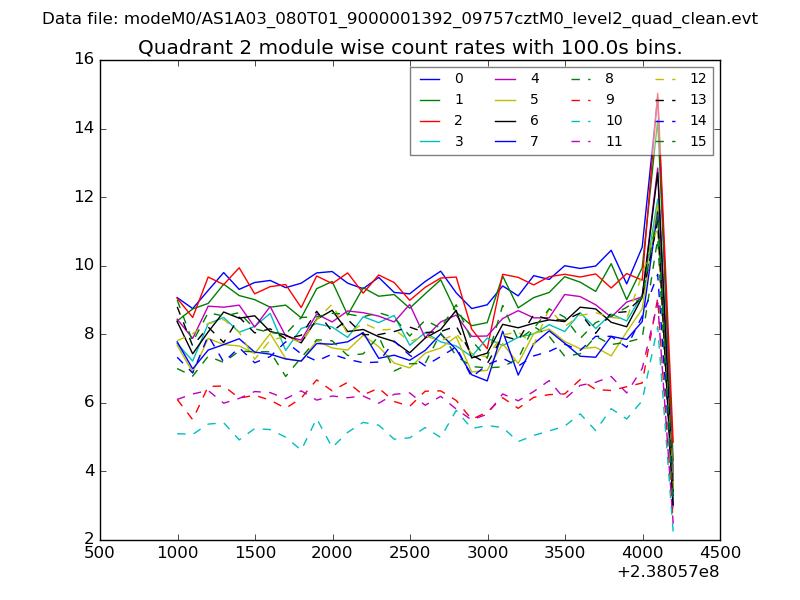
| Module-wise count rates for Quadrant B Data is divided into 100 sec bins |
 |
 |
| Module-wise count rates for Quadrant C Data is divided into 100 sec bins |
 |
 |
| Module-wise count rates for Quadrant D Data is divided into 100 sec bins |
 |
 |
| Parameter | Plot |
|---|---|
| CZT HV Monitor | 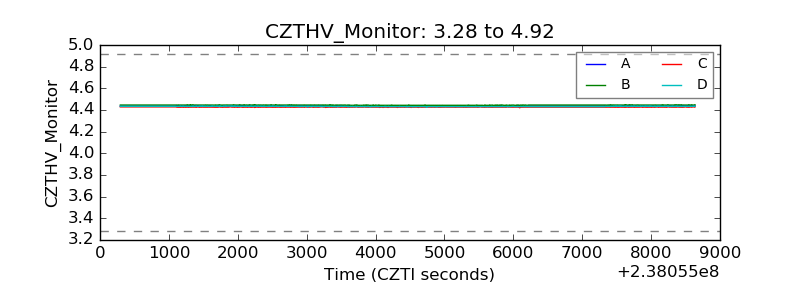 |
| D_VDD | 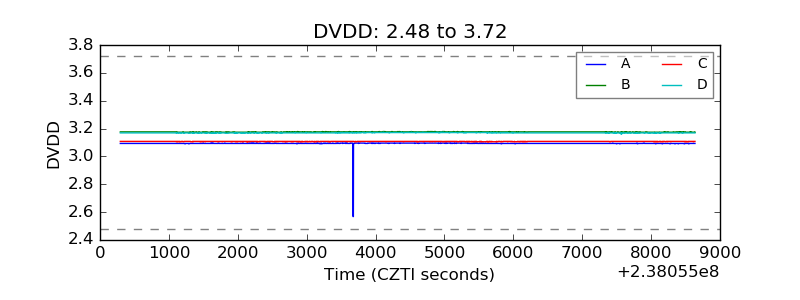 |
| Temperature 1 | 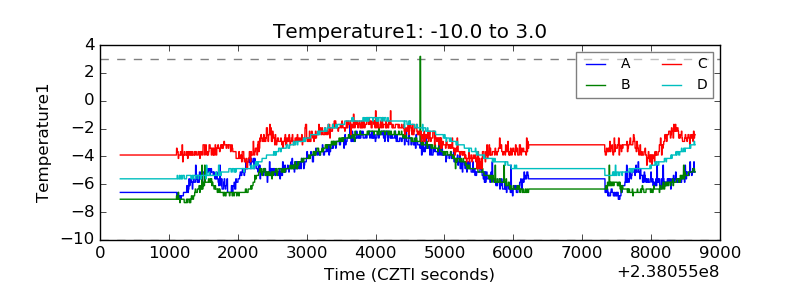 |
| Veto HV Monitor | 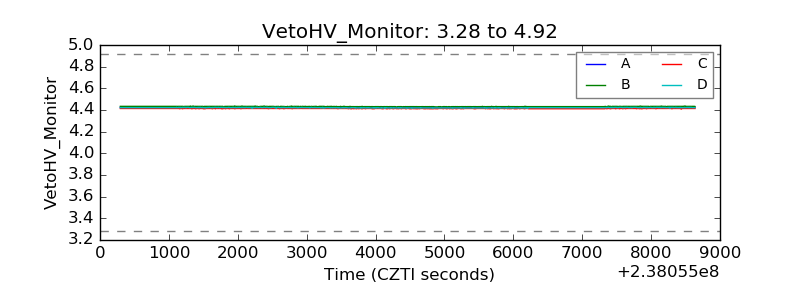 |
| Veto LLD | 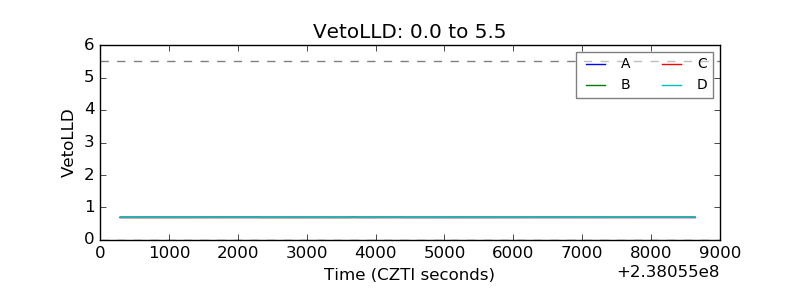 |
| Alpha Counter | 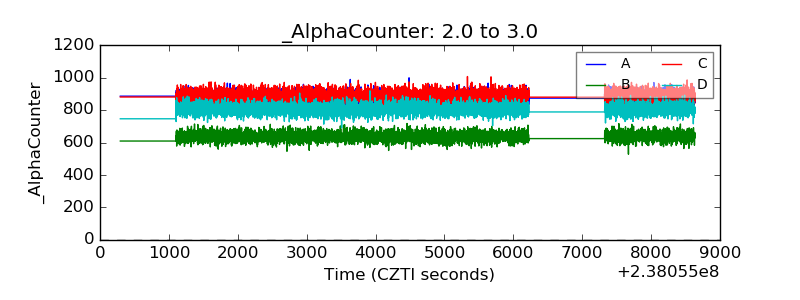 |
| _CPM_Rate | 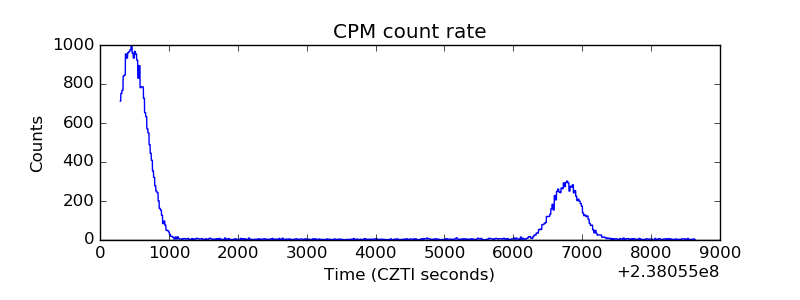 |
| CZT Counter | 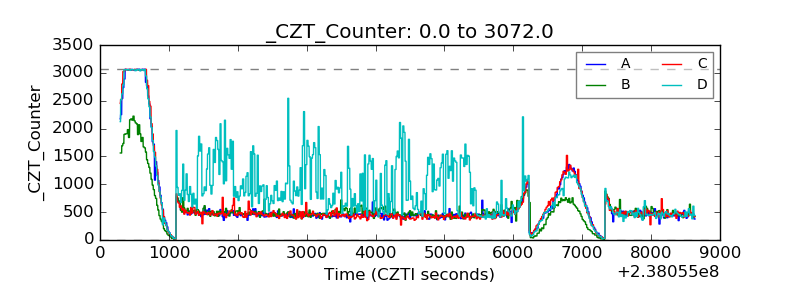 |
| +2.5 Volts monitor |  |
| +5 Volts monitor |  |
| _ROLL_ROT | 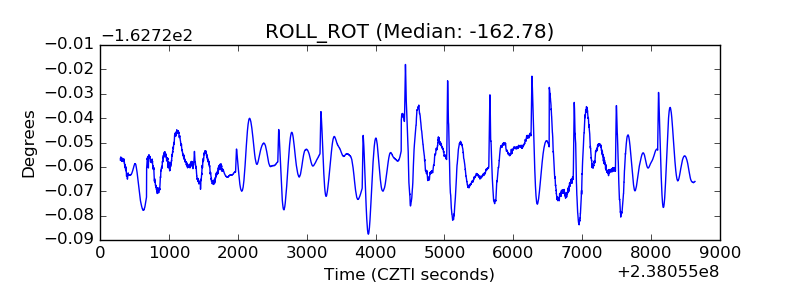 |
| _Roll_DEC | 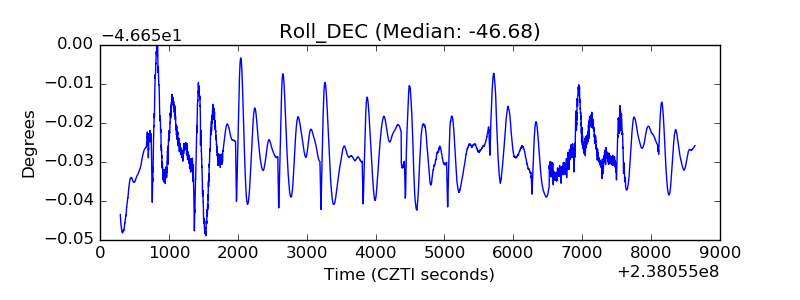 |
| _Roll_RA | 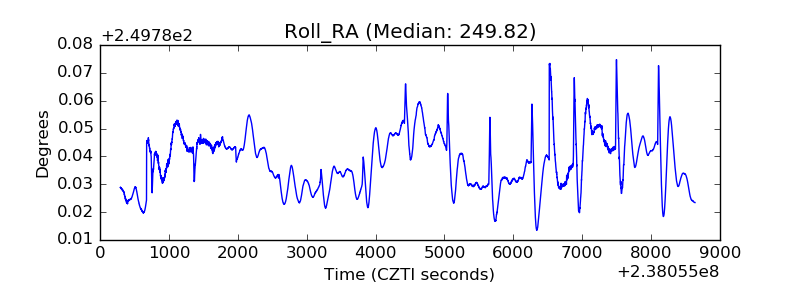 |
| Veto Counter | 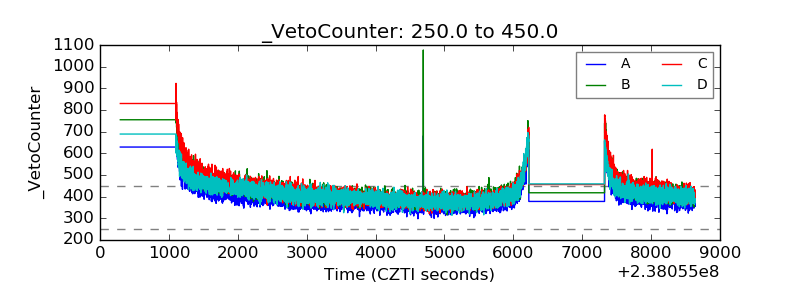 |