| Param | Original file | Final file |
|---|---|---|
| Filename | modeM0/AS1A03_080T01_9000001392_09759cztM0_level2.evt | modeM0/AS1A03_080T01_9000001392_09759cztM0_level2_quad_clean.evt |
| Size (bytes) | 502,090,560 | 89,663,040 |
| Size | 478.8 MB | 85.5 MB |
| Events in quadrant A | 3,574,977 | 553,137 |
| Events in quadrant B | 3,757,690 | 549,090 |
| Events in quadrant C | 3,502,834 | 555,969 |
| Events in quadrant D | 3,860,828 | 536,313 |
| Mode M0 | |||
|---|---|---|---|
| Quadrant | BADHDUFLAG | Total packets | Discarded packets |
| A | 0 | 16816 | 1057 |
| B | 0 | 17410 | 1350 |
| C | 0 | 16704 | 1022 |
| D | 0 | 17718 | 1237 |
| Mode M9 | |||
|---|---|---|---|
| Quadrant | BADHDUFLAG | Total packets | Discarded packets |
| A | 0 | 10 | 2 |
| B | 0 | 10 | 1 |
| C | 0 | 10 | 2 |
| D | 0 | 10 | 1 |
| Mode SS | |||
|---|---|---|---|
| Quadrant | BADHDUFLAG | Total packets | Discarded packets |
| A | 0 | 162 | 12 |
| B | 0 | 161 | 8 |
| C | 0 | 162 | 6 |
| D | 0 | 162 | 10 |
| Quadrant | Total seconds | Saturated seconds | Saturation percentage |
|---|---|---|---|
| A | 7493 | 309 | 4.123849% |
| B | 7465 | 334 | 4.474213% |
| C | 7508 | 257 | 3.423015% |
| D | 7460 | 278 | 3.726542% |
Noise dominated data is calculated using 1-second bins in cleaned event files. If a bin has >2000 counts, and if more than 50% of those come from <1% of pixels, then it is considered to be noise-dominated and hence unusable.
| Quadrant | # 1 sec bins | Bins with >0 counts | Bins with >2000 counts | High rate bins dominated by noise | Noise dominated (total time) | Noise dominated (detector-on time) | Marked lightcurve |
|---|---|---|---|---|---|---|---|
| A | 8952 | 7854 | 0 | 0 | 0.00% | 0.00% | 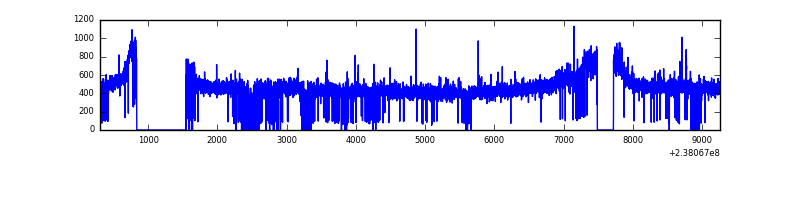 |
| B | 8952 | 7853 | 9 | 9 | 0.10% | 0.11% | 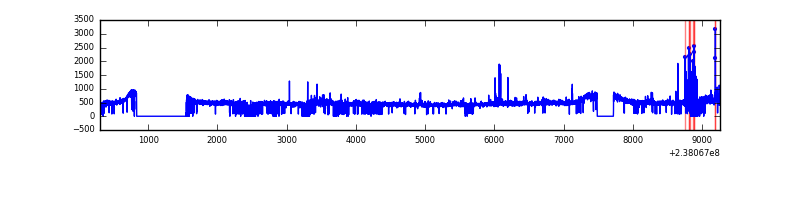 |
| C | 8951 | 7855 | 0 | 0 | 0.00% | 0.00% | 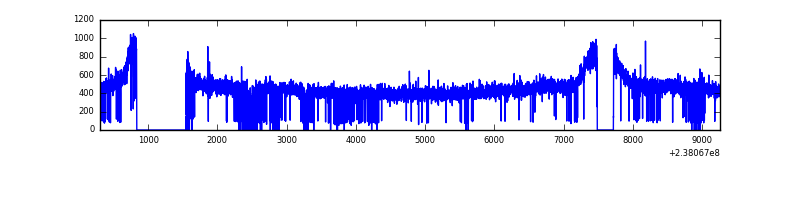 |
| D | 8952 | 7864 | 7 | 7 | 0.08% | 0.09% | 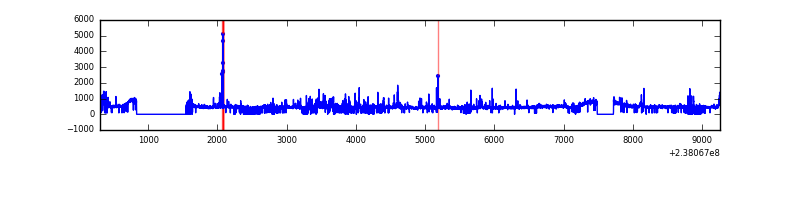 |
Top three noisy pixels from each quadrant. If the there are fewer than three noisy pixels in the level2.evt file, extra rows are filled as -1
| Pixel properties | Quadrant properties | ||||||
|---|---|---|---|---|---|---|---|
| Quadrant | DetID | PixID | Counts | Sigma | Mean | Median | Sigma |
| A | 14 | 111 | 36442 | 190.9 | 911 | 887 | 186.3 |
| A | 13 | 248 | 18289 | 93.43 | 911 | 887 | 186.3 |
| A | 15 | 239 | 12232 | 60.91 | 911 | 887 | 186.3 |
| B | 10 | 245 | 113005 | 638.81 | 906 | 882 | 175.5 |
| B | 0 | 214 | 62814 | 352.85 | 906 | 882 | 175.5 |
| B | 0 | 187 | 27621 | 152.34 | 906 | 882 | 175.5 |
| C | 8 | 222 | 8653 | 37.23 | 894 | 896 | 208.4 |
| C | 13 | 61 | 6676 | 27.74 | 894 | 896 | 208.4 |
| C | 14 | 67 | 4782 | 18.65 | 894 | 896 | 208.4 |
| D | 1 | 52 | 300652 | 1394.05 | 882 | 860 | 215.1 |
| D | 2 | 152 | 83001 | 381.96 | 882 | 860 | 215.1 |
| D | 8 | 195 | 59194 | 271.26 | 882 | 860 | 215.1 |
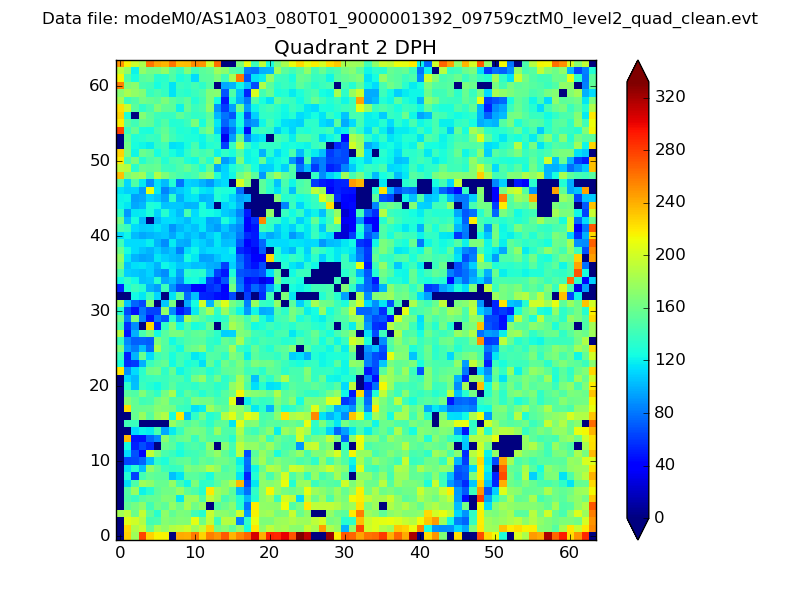
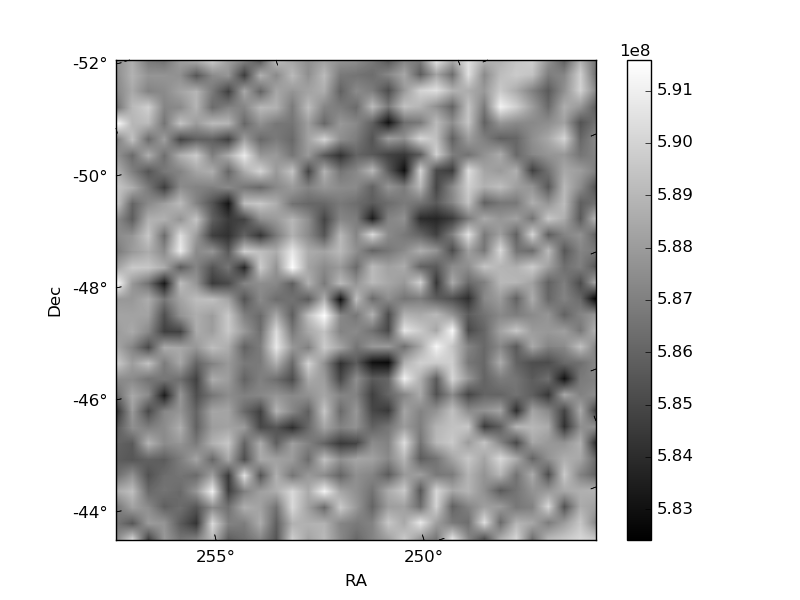
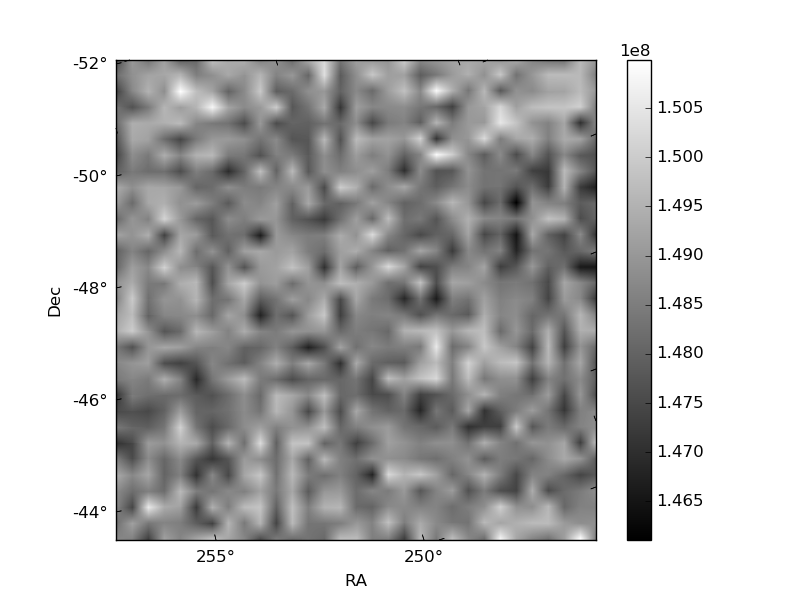
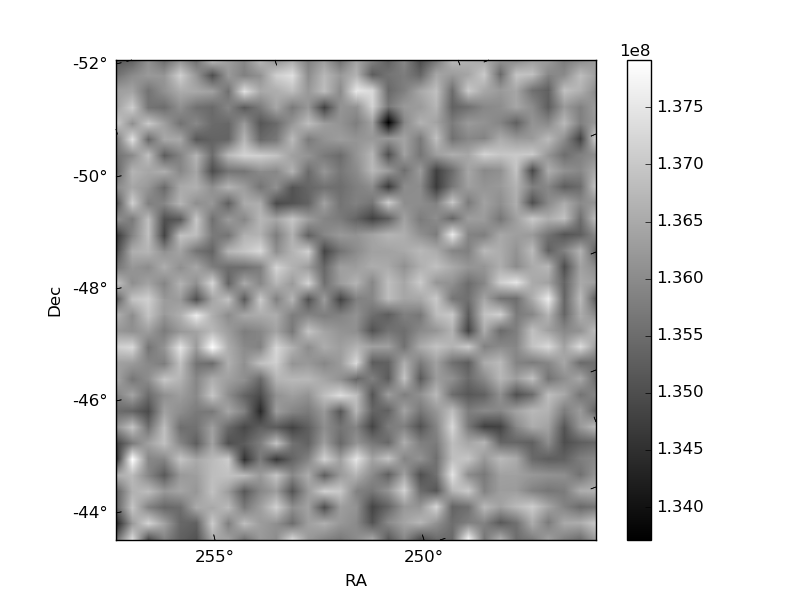
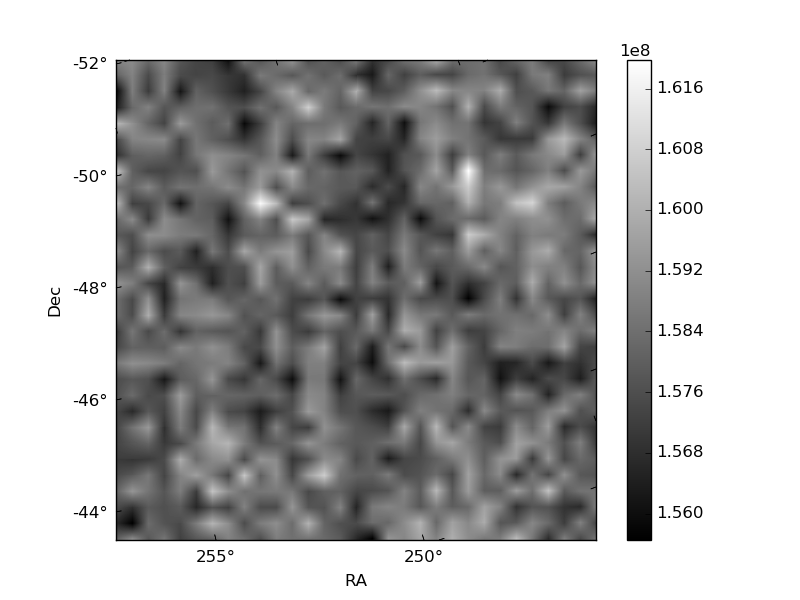
Histogram calculated using DETX and DETY for each event in the final _common_clean file
| Quadrant A | 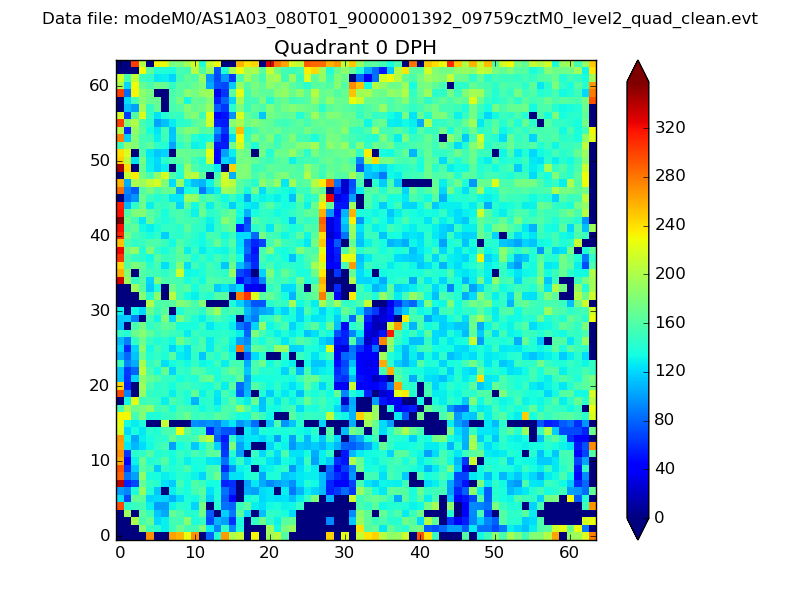 |
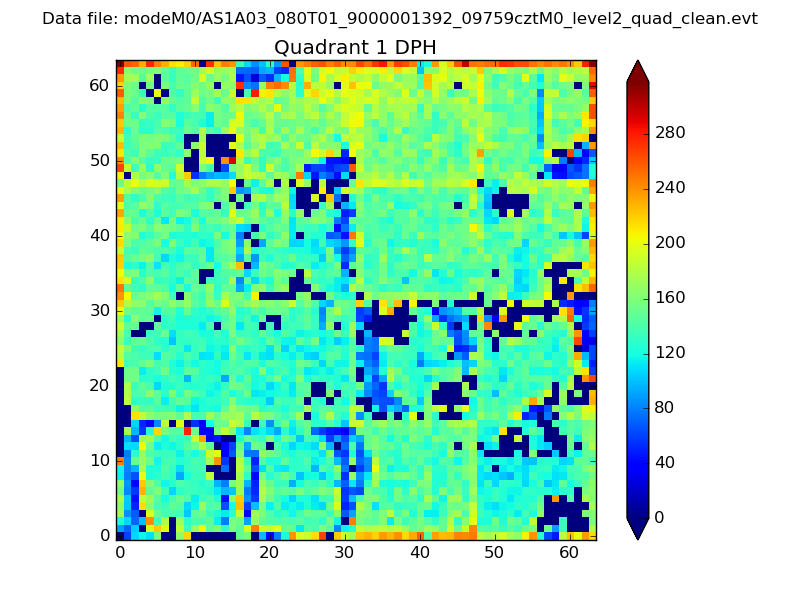 |
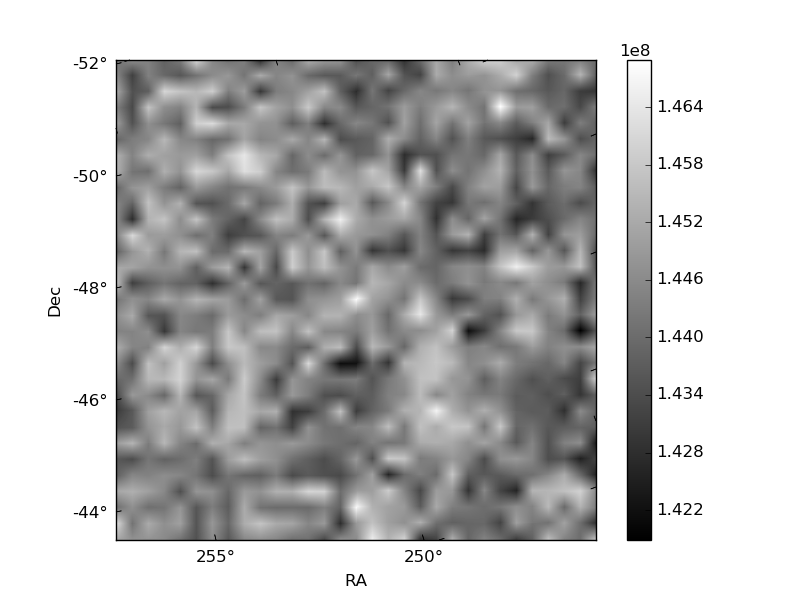
Quadrant B |
|---|---|---|---|
| Quadrant D | 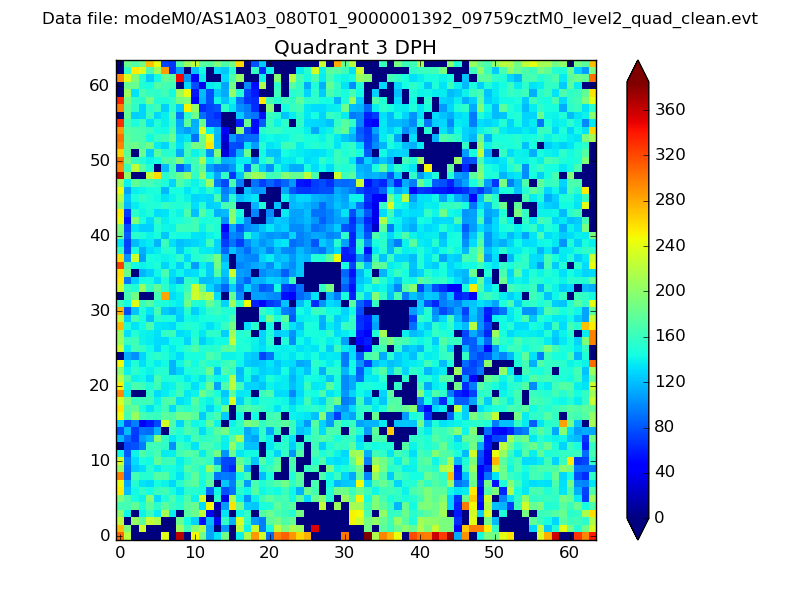 |
 |
Quadrant C |
| Plot type | Count rate plots | Images |
|---|---|---|
| Comparison with Poisson distribution Blue bars denote a histogram of data divided into 1 sec bins. Red curve is a Poisson curve with rate = median count rate of data. |
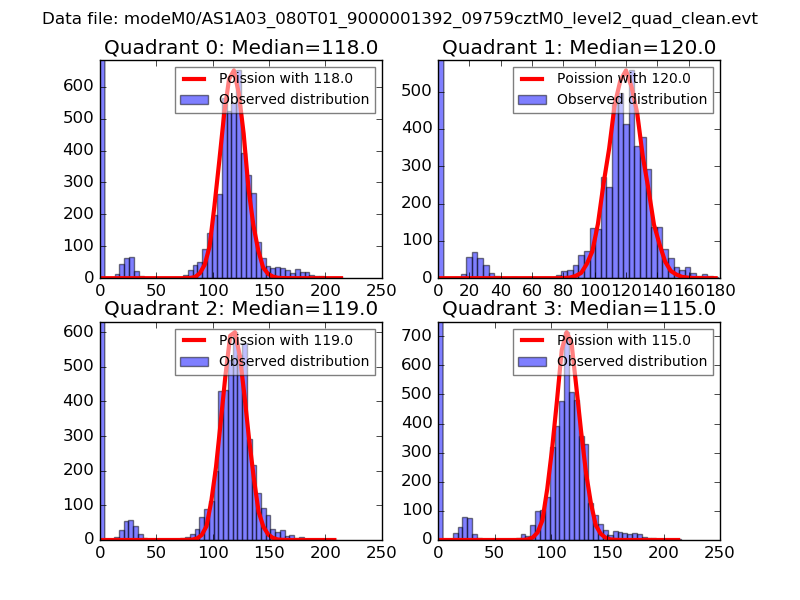 |
 |
| Quadrant-wise count rates Data is divided into 100 sec bins |
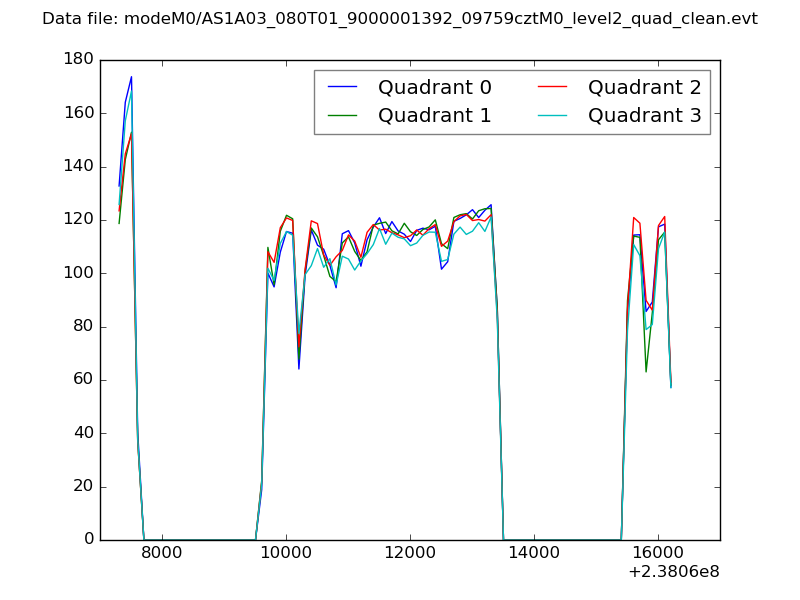 |
|
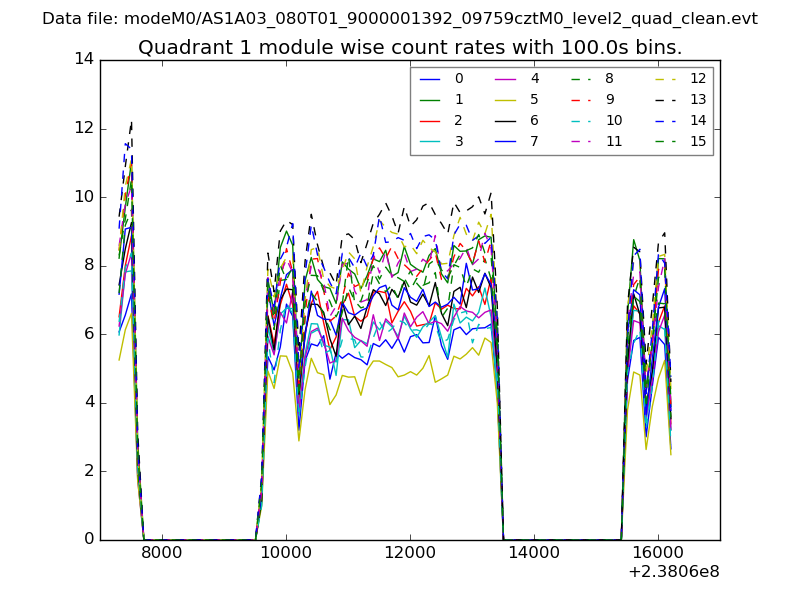
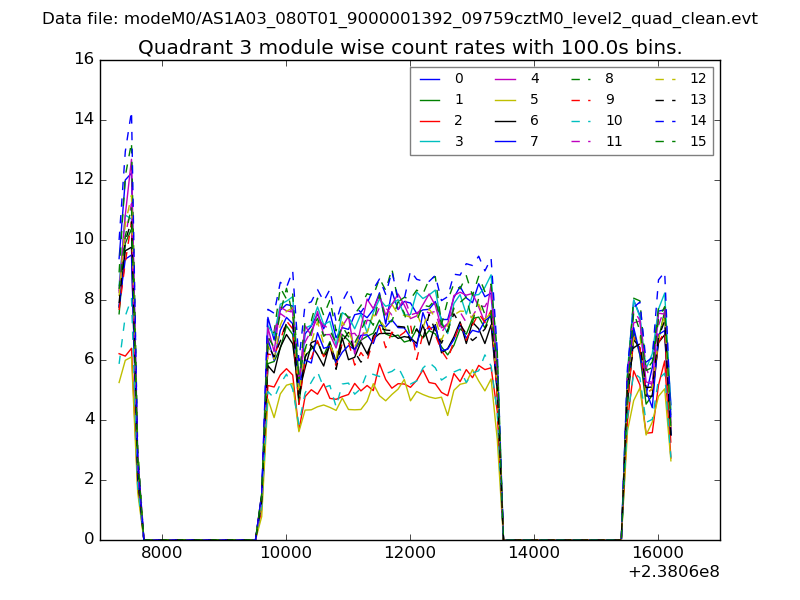
| Module-wise count rates for Quadrant A Data is divided into 100 sec bins |
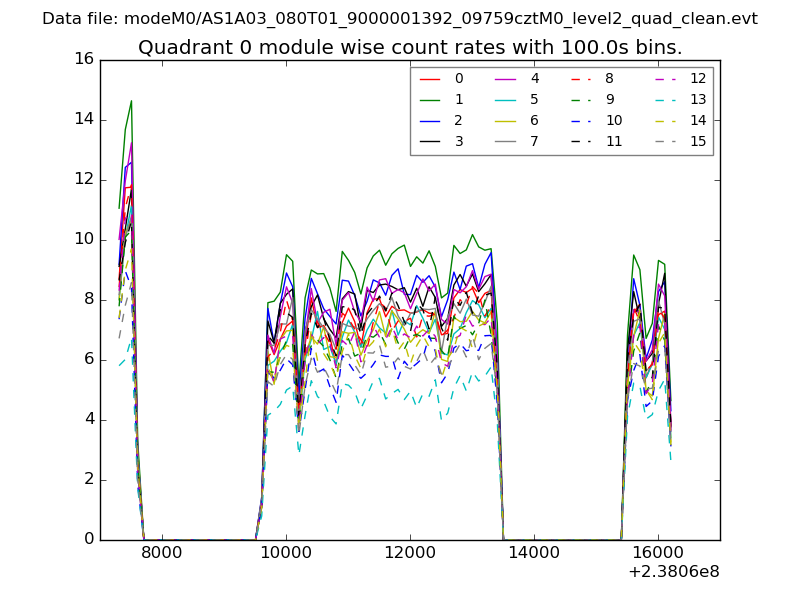 |
 |
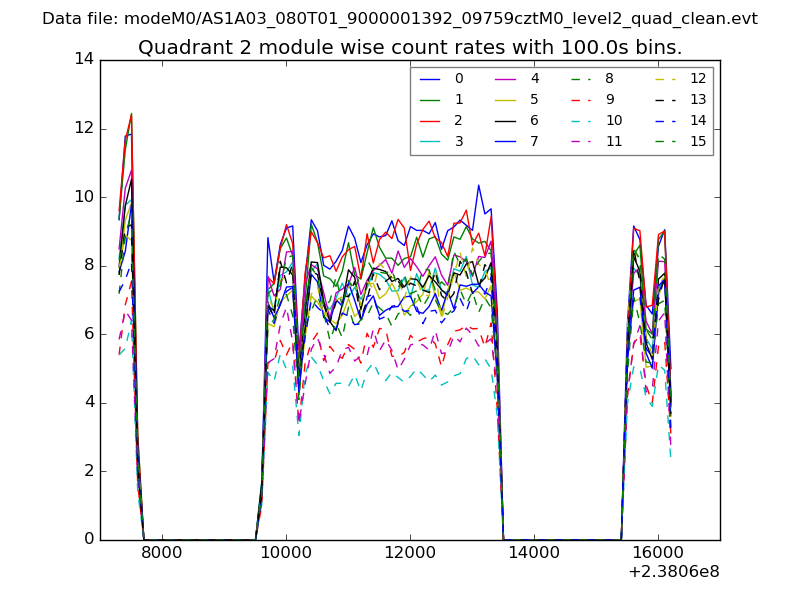
| Module-wise count rates for Quadrant B Data is divided into 100 sec bins |
 |
 |
| Module-wise count rates for Quadrant C Data is divided into 100 sec bins |
 |
 |
| Module-wise count rates for Quadrant D Data is divided into 100 sec bins |
 |
 |
| Parameter | Plot |
|---|---|
| CZT HV Monitor | 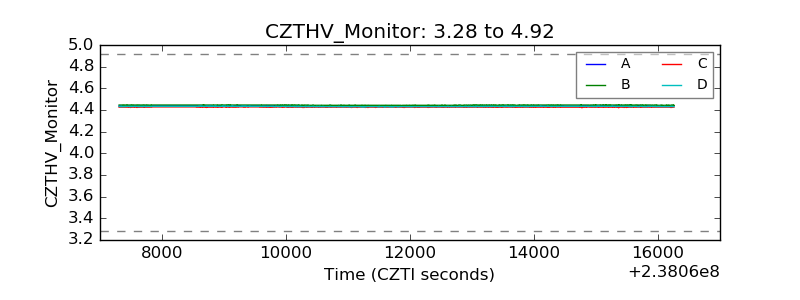 |
| D_VDD | 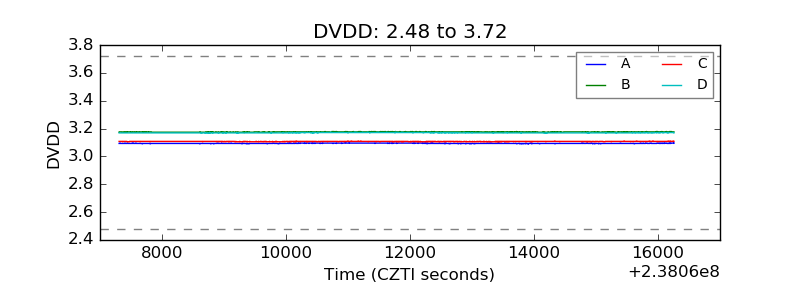 |
| Temperature 1 | 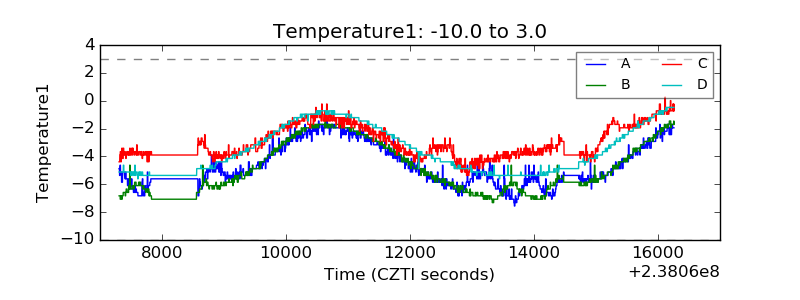 |
| Veto HV Monitor | 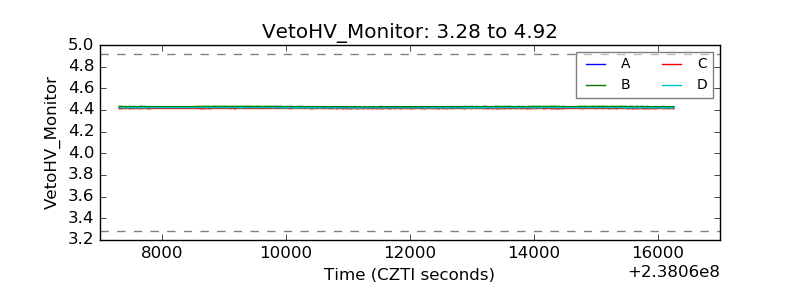 |
| Veto LLD | 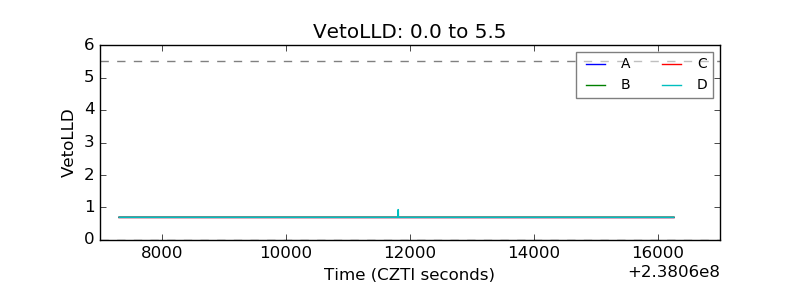 |
| Alpha Counter | 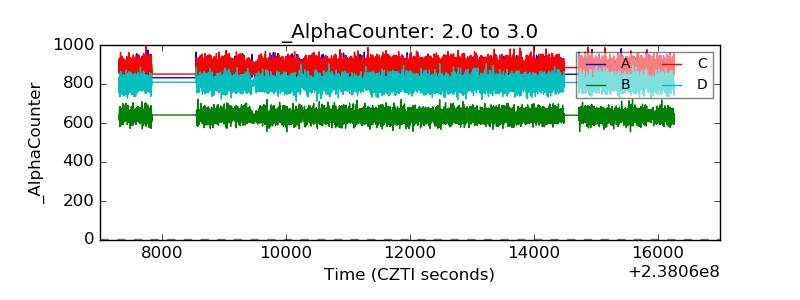 |
| _CPM_Rate | 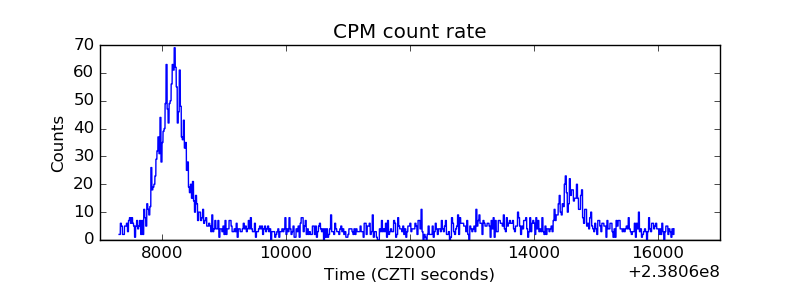 |
| CZT Counter | 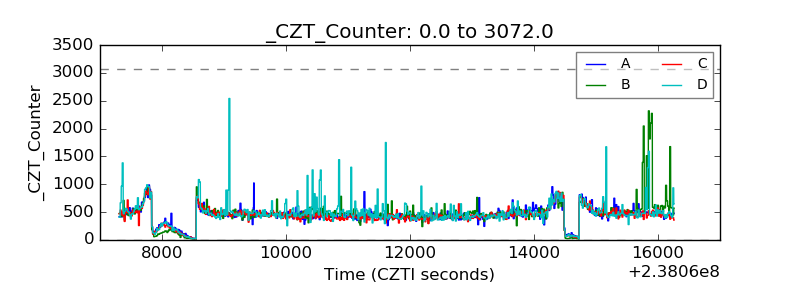 |
| +2.5 Volts monitor |  |
| +5 Volts monitor |  |
| _ROLL_ROT | 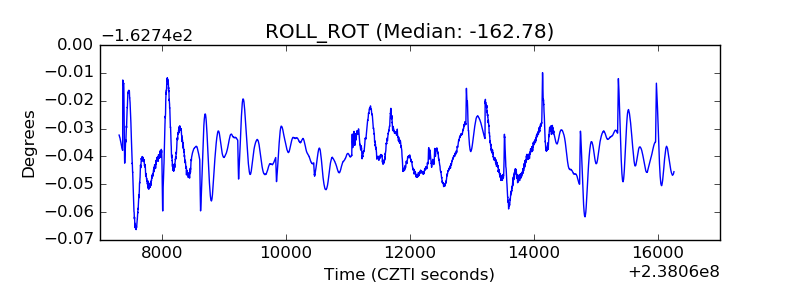 |
| _Roll_DEC | 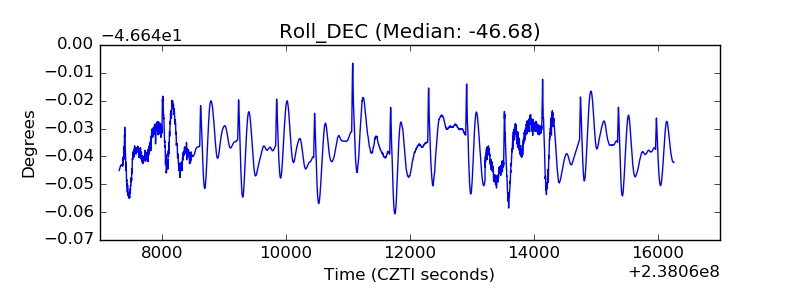 |
| _Roll_RA | 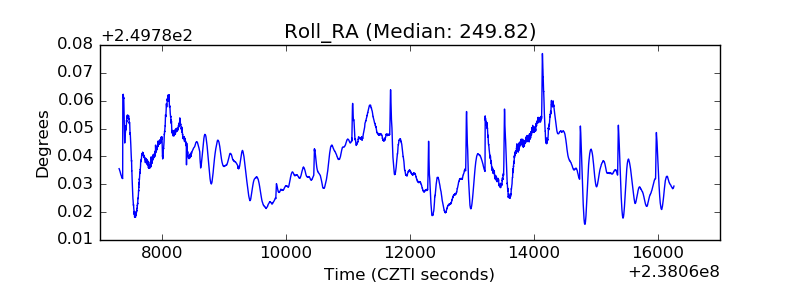 |
| Veto Counter | 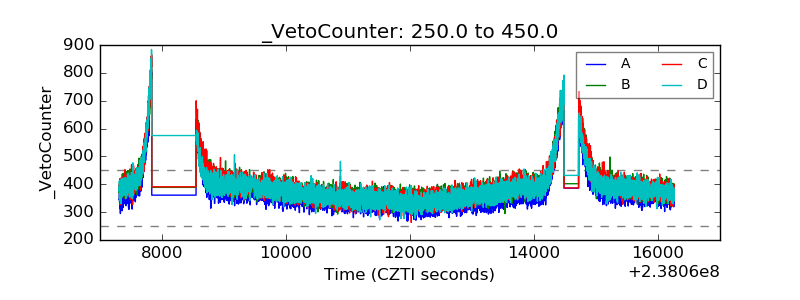 |