| Param | Original file | Final file |
|---|---|---|
| Filename | modeM0/AS1A03_080T01_9000001392_09760cztM0_level2.evt | modeM0/AS1A03_080T01_9000001392_09760cztM0_level2_quad_clean.evt |
| Size (bytes) | 540,797,760 | 86,846,400 |
| Size | 515.7 MB | 82.8 MB |
| Events in quadrant A | 3,693,358 | 536,134 |
| Events in quadrant B | 4,113,863 | 535,842 |
| Events in quadrant C | 3,508,403 | 512,735 |
| Events in quadrant D | 4,547,418 | 518,061 |
| Mode M0 | |||
|---|---|---|---|
| Quadrant | BADHDUFLAG | Total packets | Discarded packets |
| A | 0 | 16984 | 692 |
| B | 0 | 18093 | 731 |
| C | 0 | 16823 | 1172 |
| D | 0 | 19504 | 786 |
| Mode M9 | |||
|---|---|---|---|
| Quadrant | BADHDUFLAG | Total packets | Discarded packets |
| A | 0 | 3 | 0 |
| B | 0 | 3 | 0 |
| C | 0 | 3 | 0 |
| D | 0 | 3 | 0 |
| Mode SS | |||
|---|---|---|---|
| Quadrant | BADHDUFLAG | Total packets | Discarded packets |
| A | 0 | 162 | 10 |
| B | 0 | 162 | 6 |
| C | 0 | 162 | 12 |
| D | 0 | 161 | 9 |
| Quadrant | Total seconds | Saturated seconds | Saturation percentage |
|---|---|---|---|
| A | 7644 | 498 | 6.514914% |
| B | 7635 | 551 | 7.216765% |
| C | 7394 | 320 | 4.327833% |
| D | 7628 | 578 | 7.577347% |
Noise dominated data is calculated using 1-second bins in cleaned event files. If a bin has >2000 counts, and if more than 50% of those come from <1% of pixels, then it is considered to be noise-dominated and hence unusable.
| Quadrant | # 1 sec bins | Bins with >0 counts | Bins with >2000 counts | High rate bins dominated by noise | Noise dominated (total time) | Noise dominated (detector-on time) | Marked lightcurve |
|---|---|---|---|---|---|---|---|
| A | 8217 | 7798 | 4 | 4 | 0.05% | 0.05% | 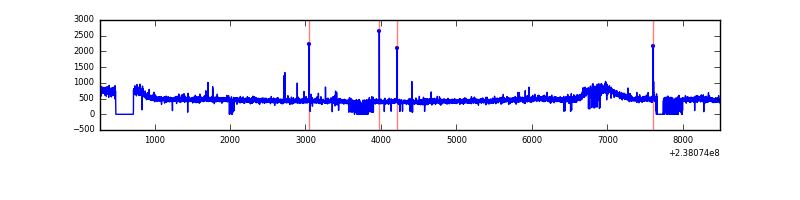 |
| B | 8217 | 7774 | 42 | 42 | 0.51% | 0.54% | 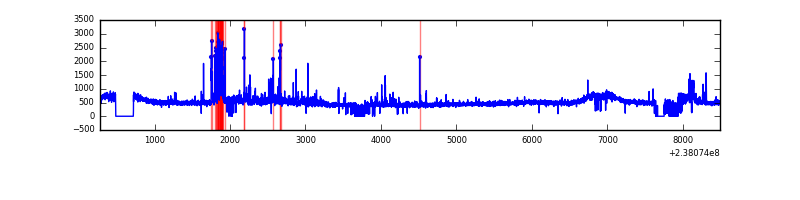 |
| C | 8217 | 7499 | 0 | 0 | 0.00% | 0.00% | 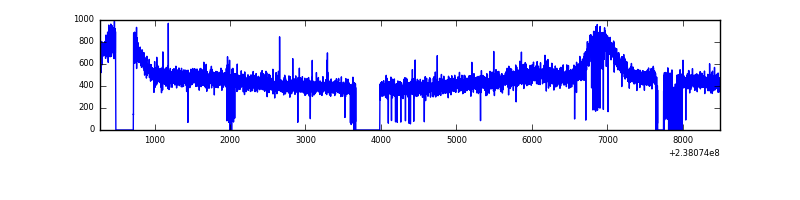 |
| D | 8217 | 7788 | 80 | 80 | 0.97% | 1.03% | 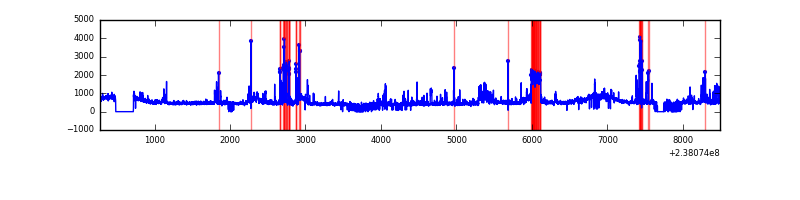 |
Top three noisy pixels from each quadrant. If the there are fewer than three noisy pixels in the level2.evt file, extra rows are filled as -1
| Pixel properties | Quadrant properties | ||||||
|---|---|---|---|---|---|---|---|
| Quadrant | DetID | PixID | Counts | Sigma | Mean | Median | Sigma |
| A | 14 | 111 | 42347 | 215.61 | 936 | 911 | 192.2 |
| A | 15 | 239 | 17960 | 88.71 | 936 | 911 | 192.2 |
| A | 13 | 248 | 16544 | 81.35 | 936 | 911 | 192.2 |
| B | 10 | 245 | 221745 | 1207.77 | 936 | 909 | 182.8 |
| B | 0 | 214 | 128606 | 698.39 | 936 | 909 | 182.8 |
| B | 0 | 187 | 52951 | 284.62 | 936 | 909 | 182.8 |
| C | 8 | 222 | 7325 | 30.84 | 896 | 895 | 208.5 |
| C | 13 | 61 | 6766 | 28.16 | 896 | 895 | 208.5 |
| C | 14 | 67 | 5493 | 22.05 | 896 | 895 | 208.5 |
| D | 1 | 52 | 417711 | 1906.19 | 906 | 882 | 218.7 |
| D | 13 | 137 | 297969 | 1358.6 | 906 | 882 | 218.7 |
| D | 8 | 195 | 160303 | 729.04 | 906 | 882 | 218.7 |
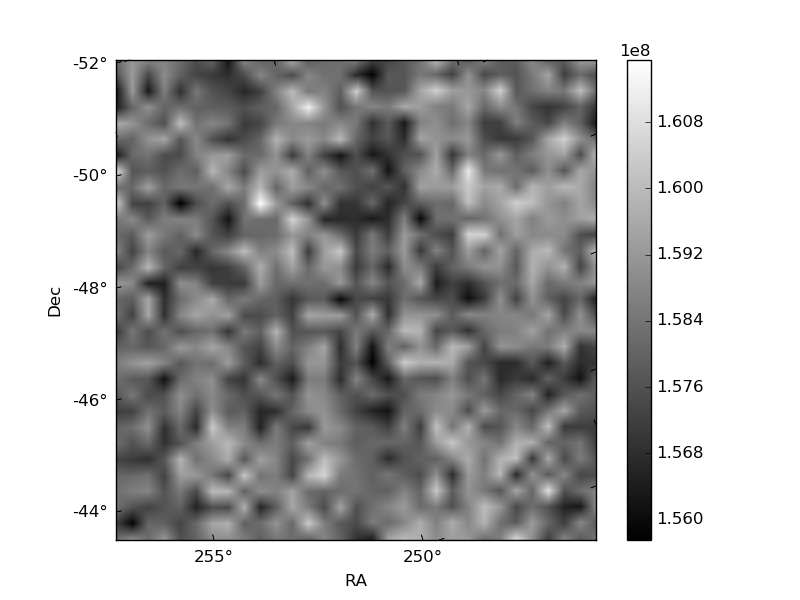
Histogram calculated using DETX and DETY for each event in the final _common_clean file
| Quadrant A |  |
 |
Quadrant B |
|---|---|---|---|
| Quadrant D |  |
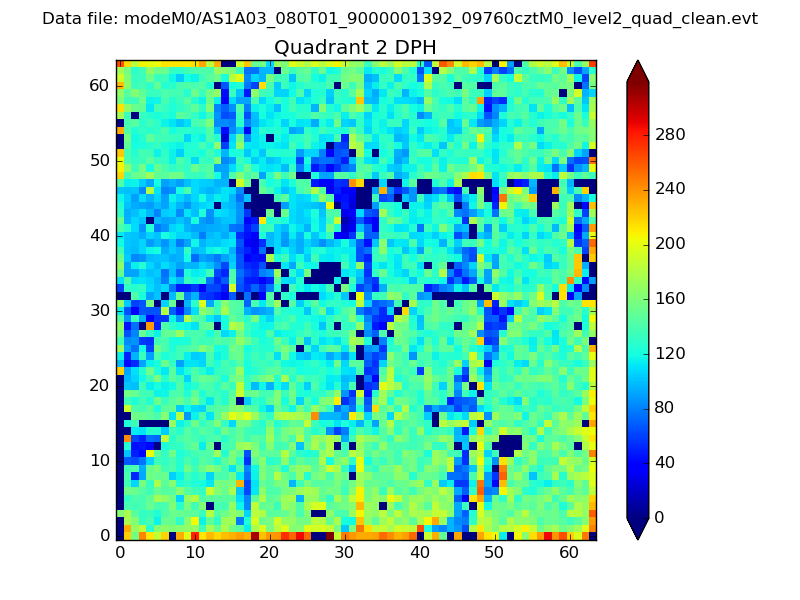 |
Quadrant C |
| Plot type | Count rate plots | Images |
|---|---|---|
| Comparison with Poisson distribution Blue bars denote a histogram of data divided into 1 sec bins. Red curve is a Poisson curve with rate = median count rate of data. |
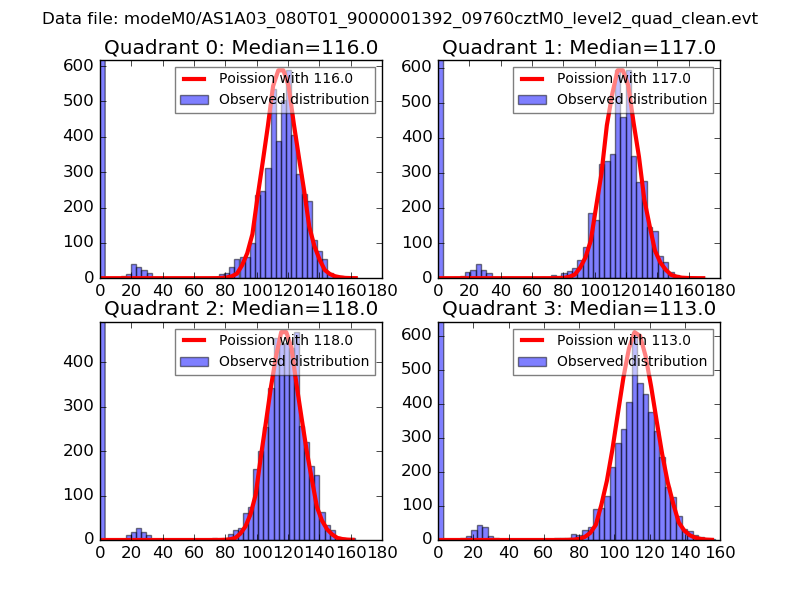 |
 |
| Quadrant-wise count rates Data is divided into 100 sec bins |
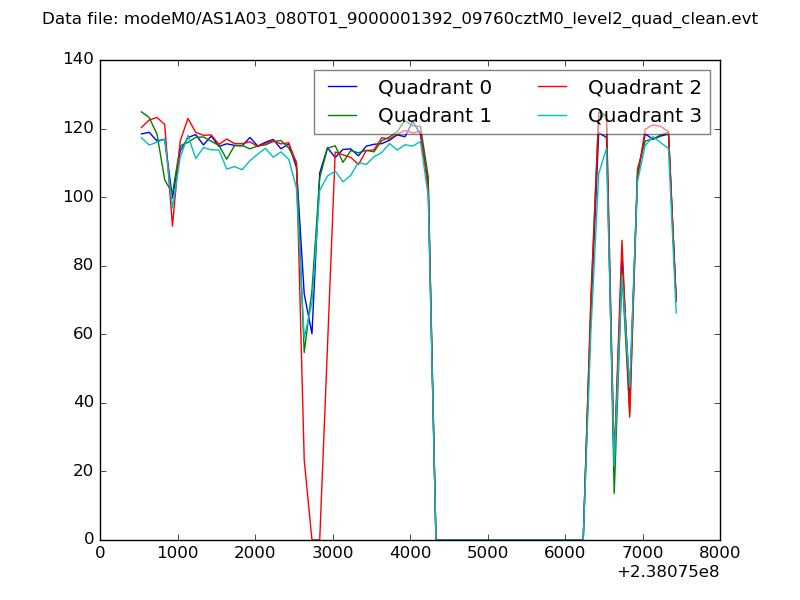 |
|
| Module-wise count rates for Quadrant A Data is divided into 100 sec bins |
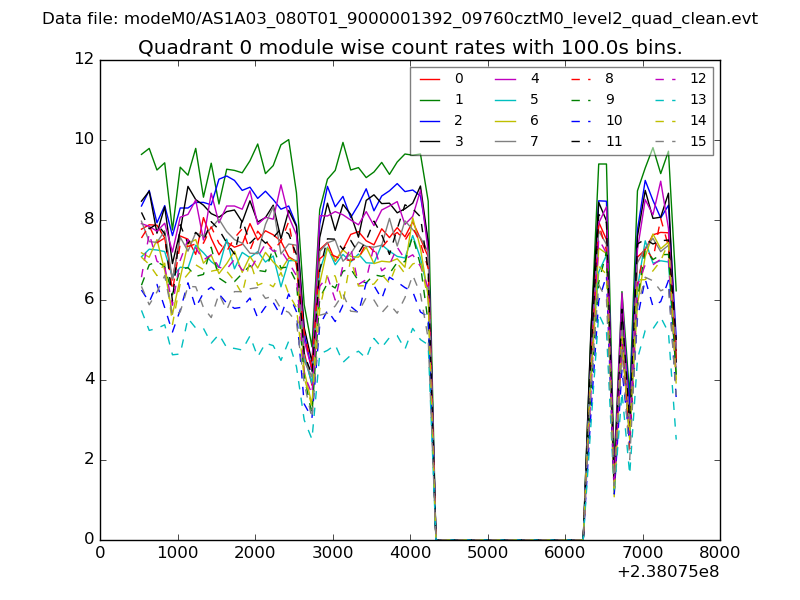 |
 |
| Module-wise count rates for Quadrant B Data is divided into 100 sec bins |
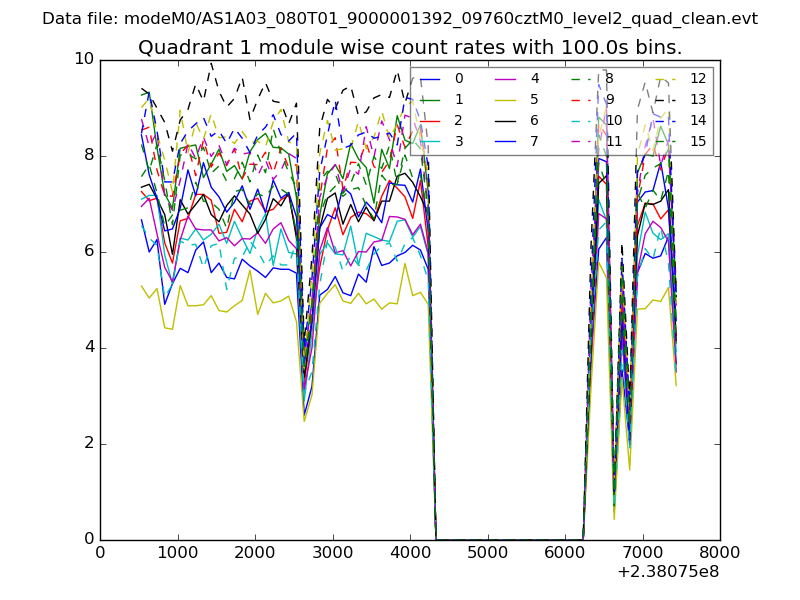 |
 |
| Module-wise count rates for Quadrant C Data is divided into 100 sec bins |
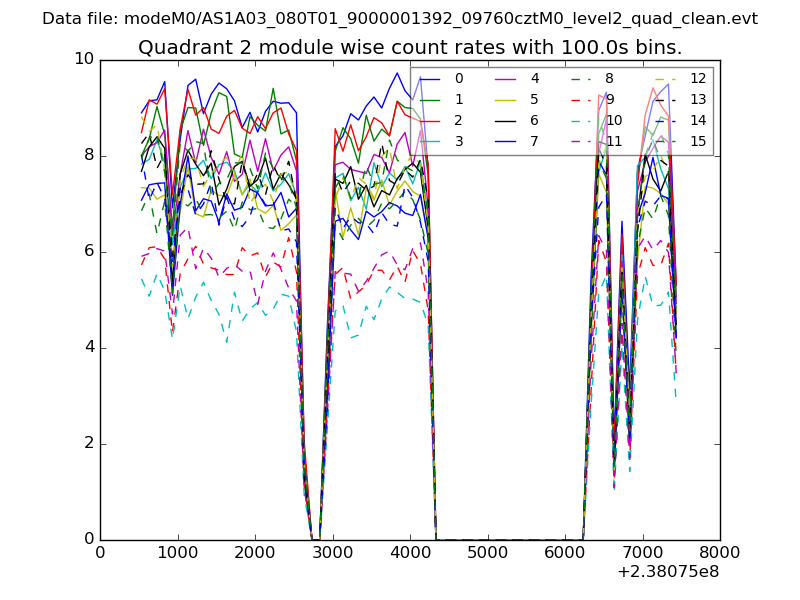 |
 |
| Module-wise count rates for Quadrant D Data is divided into 100 sec bins |
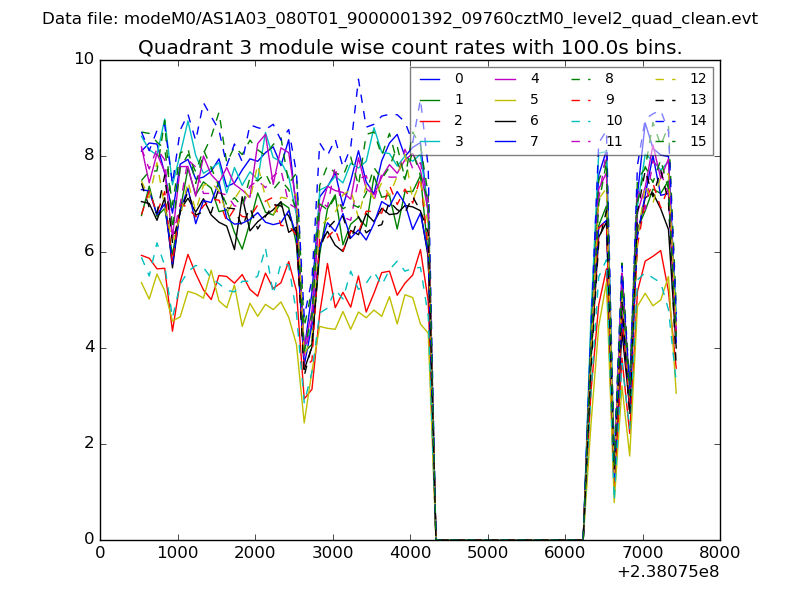 |
 |
| Parameter | Plot |
|---|---|
| CZT HV Monitor | 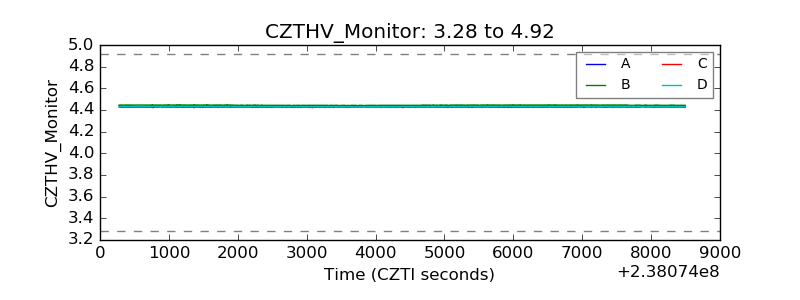 |
| D_VDD | 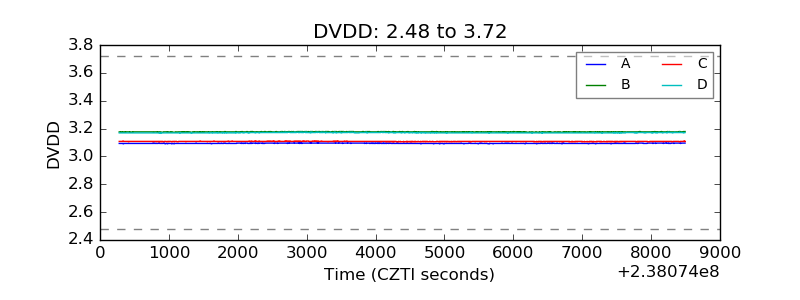 |
| Temperature 1 | 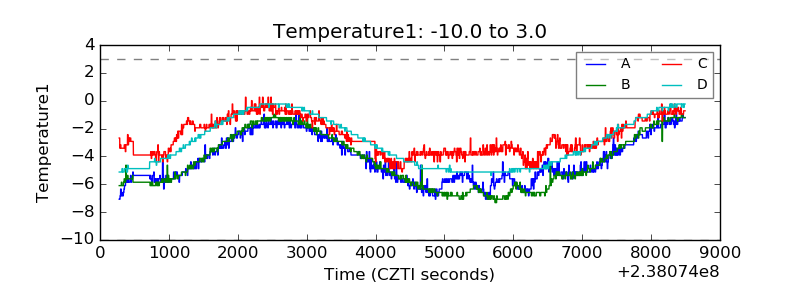 |
| Veto HV Monitor | 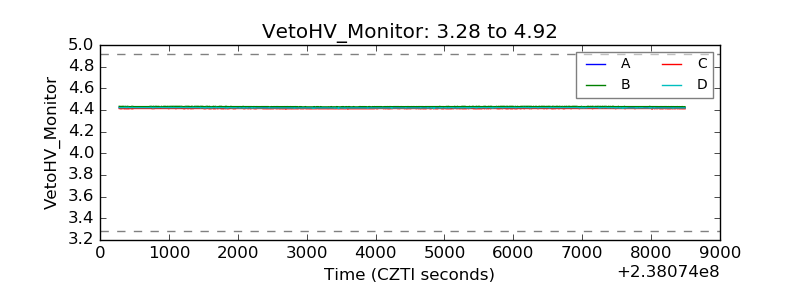 |
| Veto LLD | 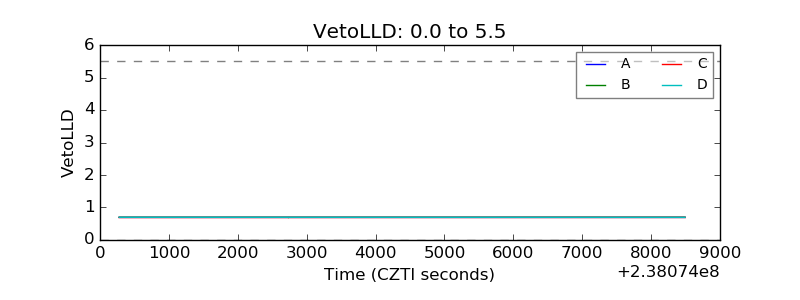 |
| Alpha Counter | 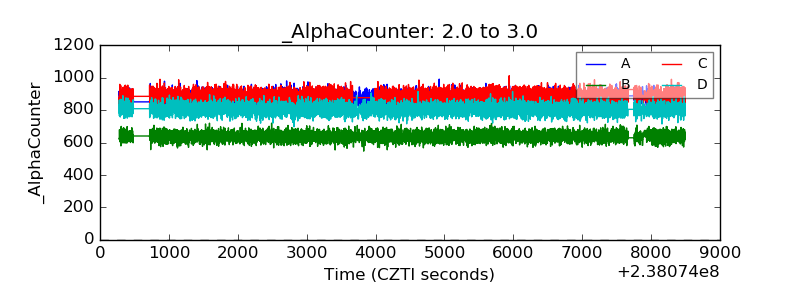 |
| _CPM_Rate | 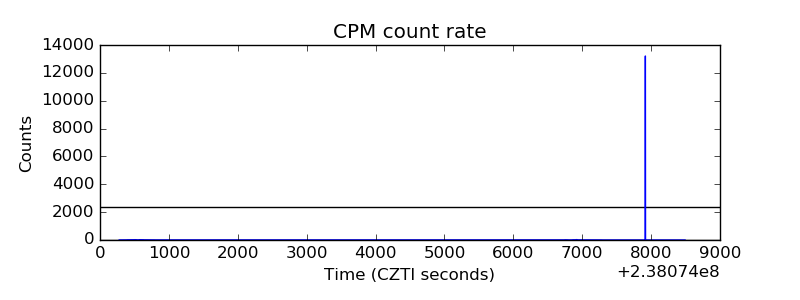 |
| CZT Counter | 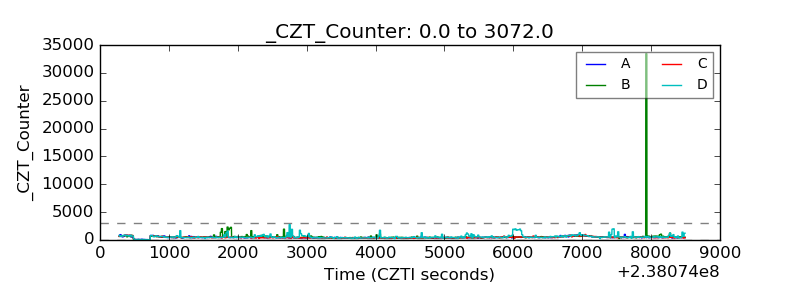 |
| +2.5 Volts monitor |  |
| +5 Volts monitor |  |
| _ROLL_ROT | 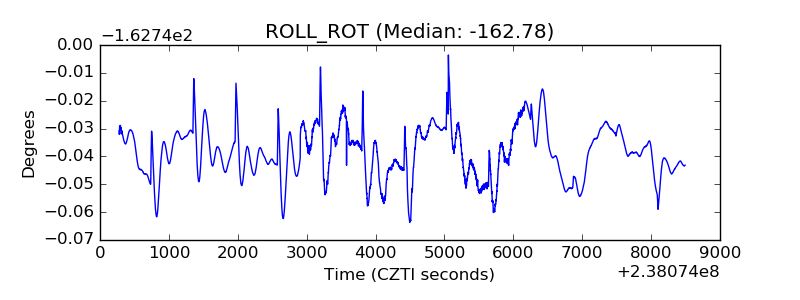 |
| _Roll_DEC | 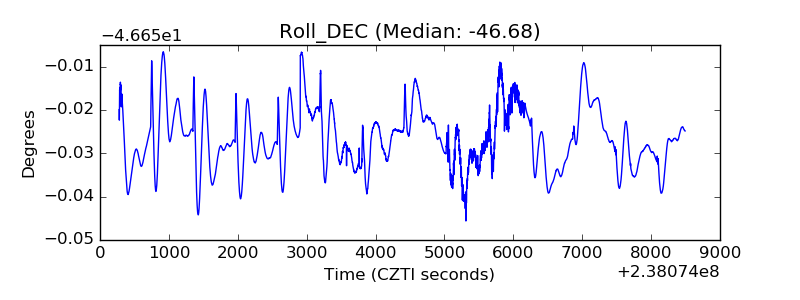 |
| _Roll_RA | 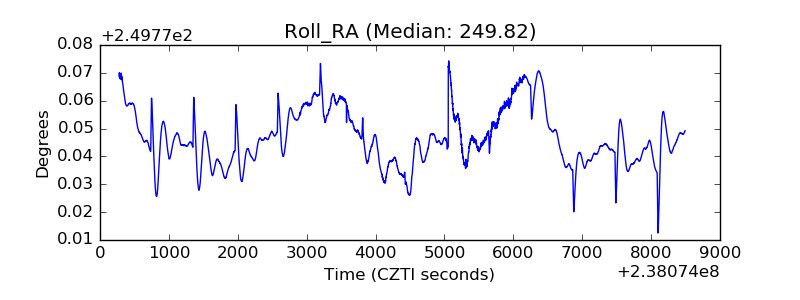 |
| Veto Counter | 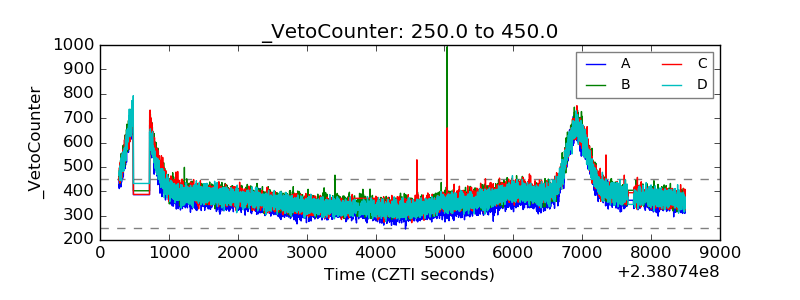 |