| Param | Original file | Final file |
|---|---|---|
| Filename | modeM0/AS1A03_080T01_9000001392_09761cztM0_level2.evt | modeM0/AS1A03_080T01_9000001392_09761cztM0_level2_quad_clean.evt |
| Size (bytes) | 356,800,320 | 61,845,120 |
| Size | 340.3 MB | 59.0 MB |
| Events in quadrant A | 2,383,129 | 385,498 |
| Events in quadrant B | 2,487,251 | 388,896 |
| Events in quadrant C | 2,266,016 | 384,210 |
| Events in quadrant D | 3,321,823 | 356,250 |
| Mode M0 | |||
|---|---|---|---|
| Quadrant | BADHDUFLAG | Total packets | Discarded packets |
| A | 0 | 12850 | 2242 |
| B | 0 | 13146 | 2418 |
| C | 0 | 12663 | 2274 |
| D | 0 | 17107 | 3818 |
| Mode M9 | |||
|---|---|---|---|
| Quadrant | BADHDUFLAG | Total packets | Discarded packets |
| A | 0 | 4 | 0 |
| B | 0 | 4 | 0 |
| C | 0 | 4 | 0 |
| D | 0 | 4 | 0 |
| Mode SS | |||
|---|---|---|---|
| Quadrant | BADHDUFLAG | Total packets | Discarded packets |
| A | 0 | 128 | 22 |
| B | 0 | 128 | 22 |
| C | 0 | 128 | 26 |
| D | 0 | 127 | 21 |
| Quadrant | Total seconds | Saturated seconds | Saturation percentage |
|---|---|---|---|
| A | 5120 | 68 | 1.328125% |
| B | 5119 | 54 | 1.054894% |
| C | 5094 | 26 | 0.510404% |
| D | 5036 | 135 | 2.680699% |
Noise dominated data is calculated using 1-second bins in cleaned event files. If a bin has >2000 counts, and if more than 50% of those come from <1% of pixels, then it is considered to be noise-dominated and hence unusable.
| Quadrant | # 1 sec bins | Bins with >0 counts | Bins with >2000 counts | High rate bins dominated by noise | Noise dominated (total time) | Noise dominated (detector-on time) | Marked lightcurve |
|---|---|---|---|---|---|---|---|
| A | 6572 | 5355 | 4 | 4 | 0.06% | 0.07% | 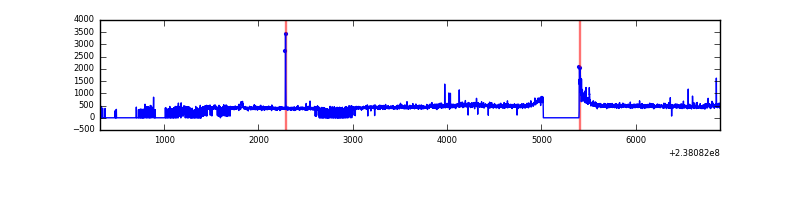 |
| B | 6537 | 5334 | 2 | 2 | 0.03% | 0.04% | 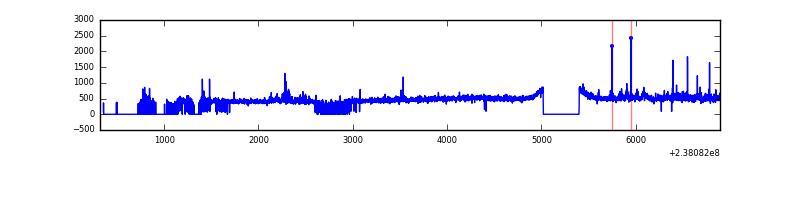 |
| C | 6574 | 5316 | 0 | 0 | 0.00% | 0.00% | 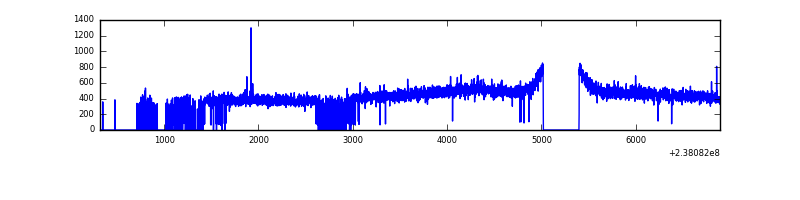 |
| D | 6543 | 5263 | 67 | 67 | 1.02% | 1.27% | 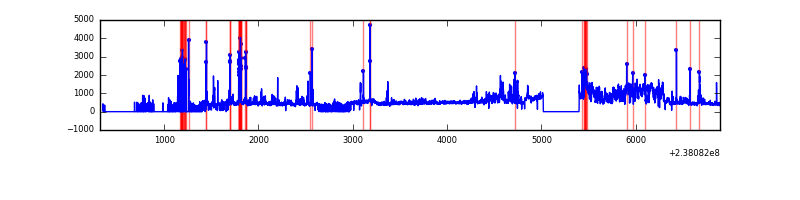 |
Top three noisy pixels from each quadrant. If the there are fewer than three noisy pixels in the level2.evt file, extra rows are filled as -1
| Pixel properties | Quadrant properties | ||||||
|---|---|---|---|---|---|---|---|
| Quadrant | DetID | PixID | Counts | Sigma | Mean | Median | Sigma |
| A | 8 | 15 | 45403 | 365.46 | 597 | 583 | 122.6 |
| A | 14 | 111 | 13962 | 109.09 | 597 | 583 | 122.6 |
| A | 0 | 230 | 8347 | 63.31 | 597 | 583 | 122.6 |
| B | 0 | 214 | 47102 | 397.23 | 601 | 585 | 117.1 |
| B | 10 | 245 | 37408 | 314.44 | 601 | 585 | 117.1 |
| B | 0 | 219 | 30878 | 258.68 | 601 | 585 | 117.1 |
| C | 13 | 61 | 4338 | 27.7 | 579 | 582 | 135.6 |
| C | 8 | 222 | 3906 | 24.52 | 579 | 582 | 135.6 |
| C | 11 | 7 | 2440 | 13.7 | 579 | 582 | 135.6 |
| D | 1 | 52 | 848817 | 6006.43 | 563 | 549 | 141.2 |
| D | 8 | 195 | 137097 | 966.87 | 563 | 549 | 141.2 |
| D | 10 | 253 | 53860 | 377.49 | 563 | 549 | 141.2 |
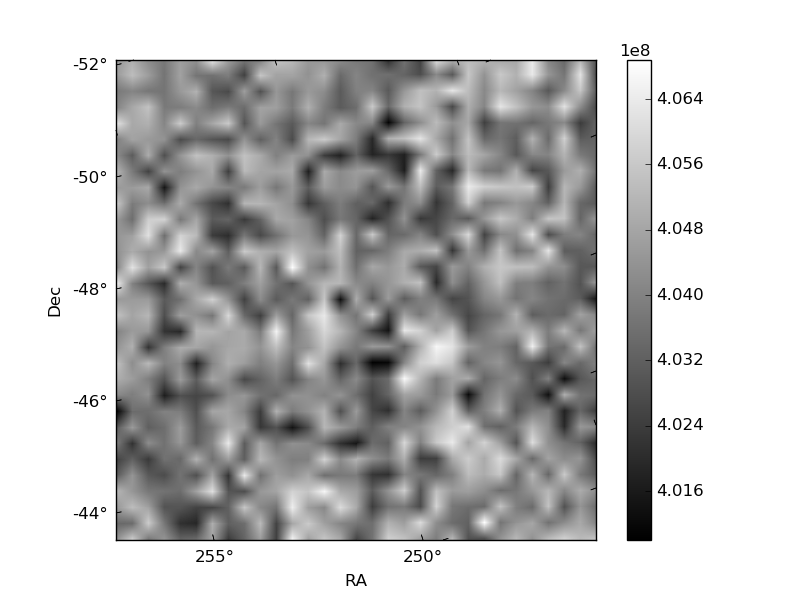
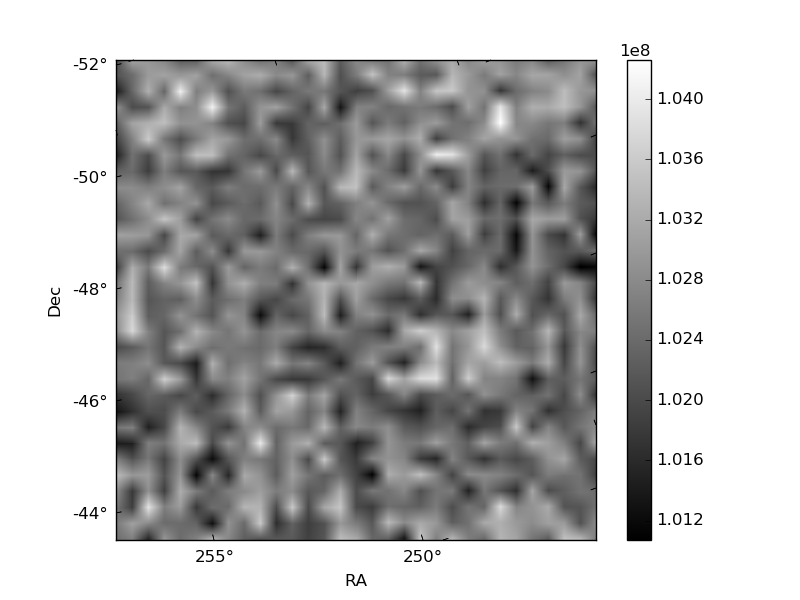
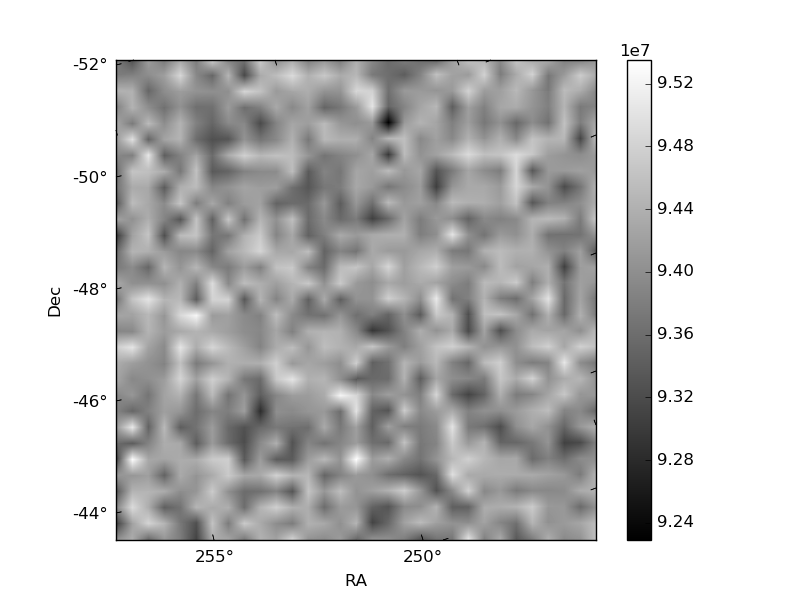
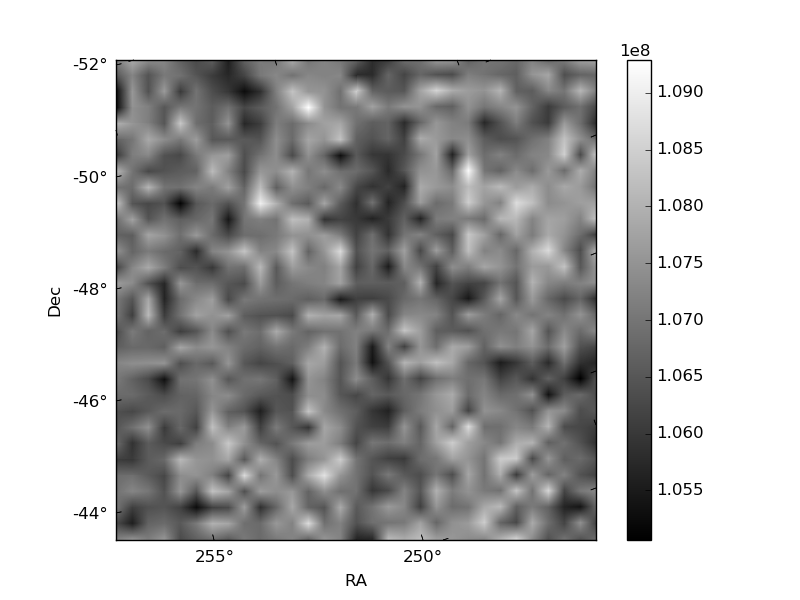
Histogram calculated using DETX and DETY for each event in the final _common_clean file
| Quadrant A | 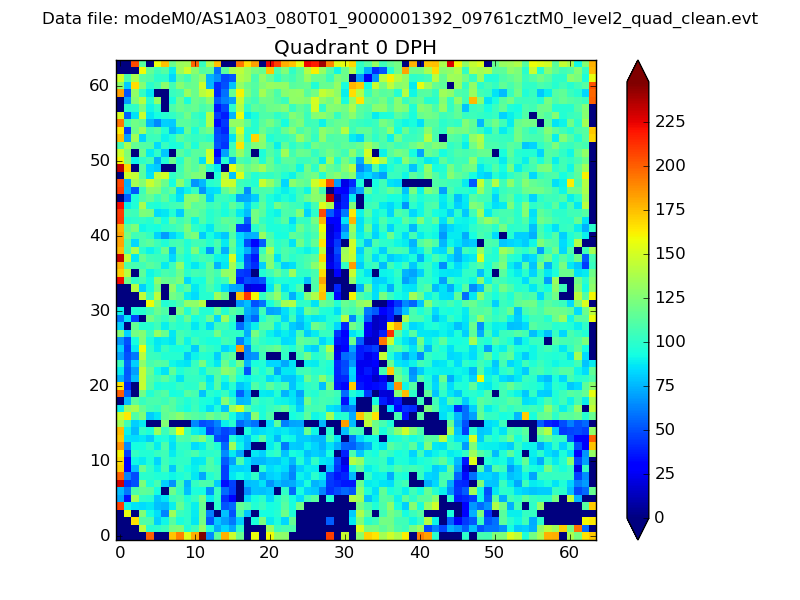 |
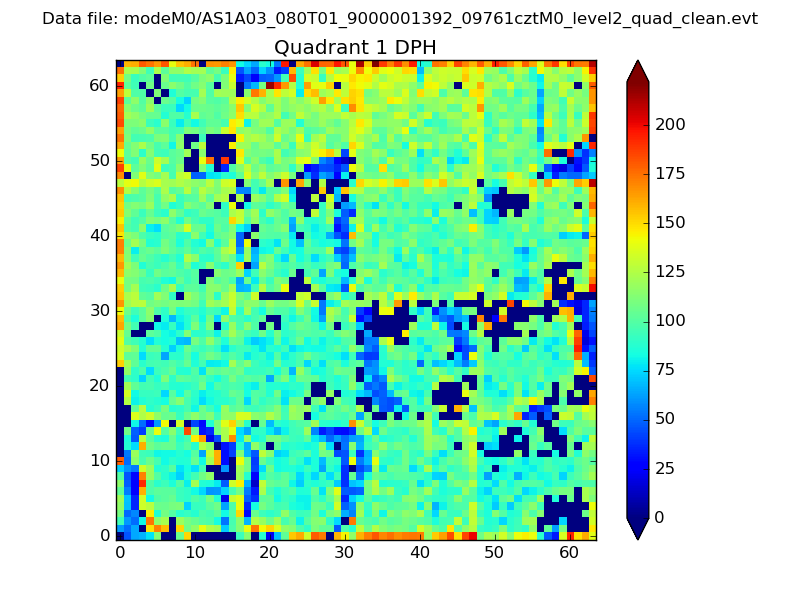 |
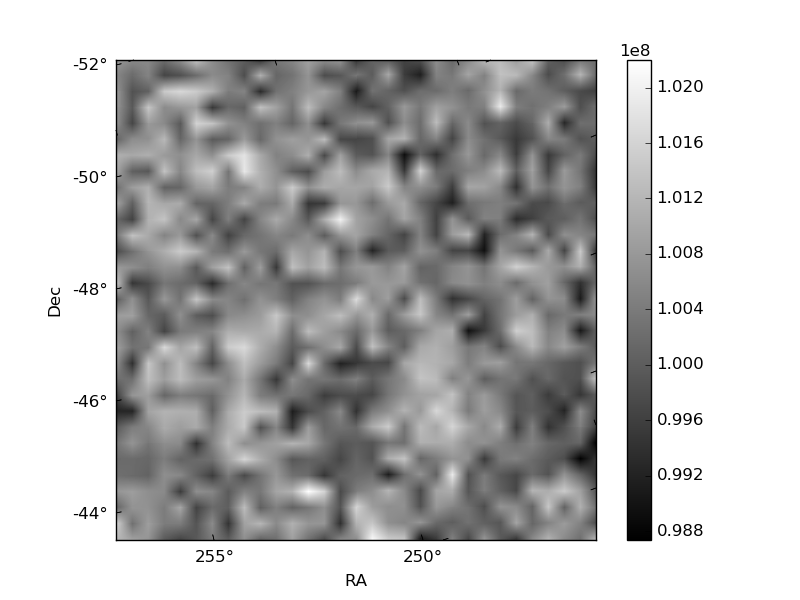
Quadrant B |
|---|---|---|---|
| Quadrant D | 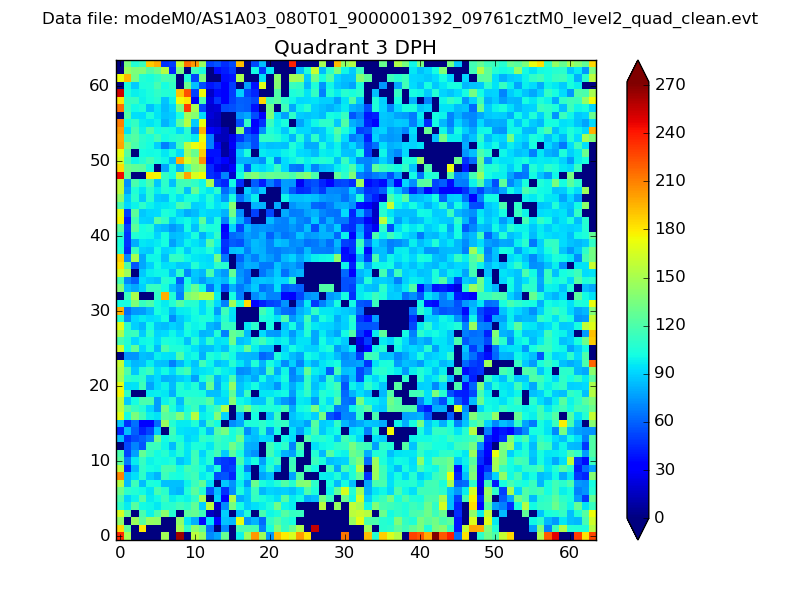 |
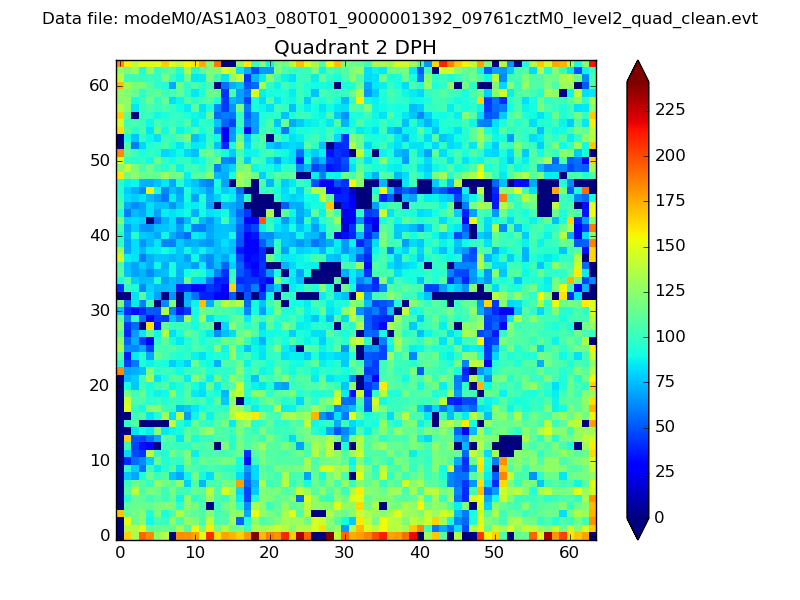 |
Quadrant C |
| Plot type | Count rate plots | Images |
|---|---|---|
| Comparison with Poisson distribution Blue bars denote a histogram of data divided into 1 sec bins. Red curve is a Poisson curve with rate = median count rate of data. |
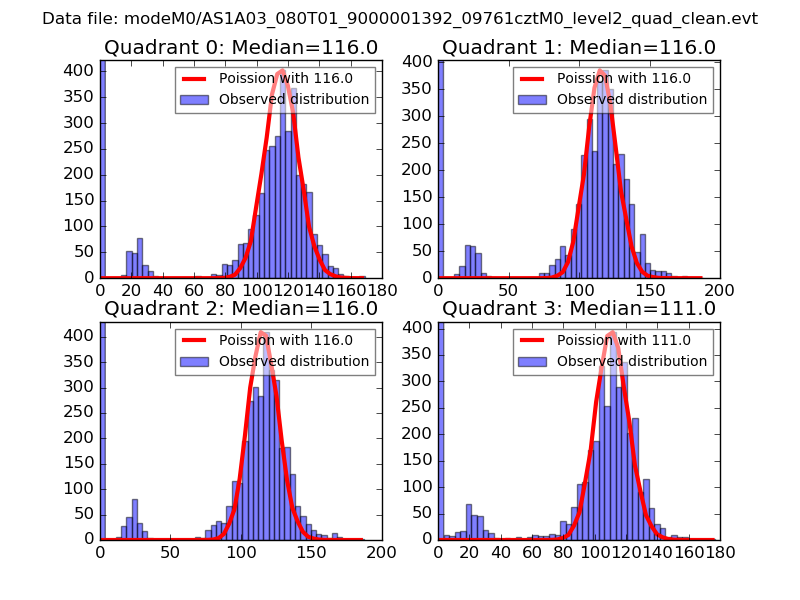 |
 |
| Quadrant-wise count rates Data is divided into 100 sec bins |
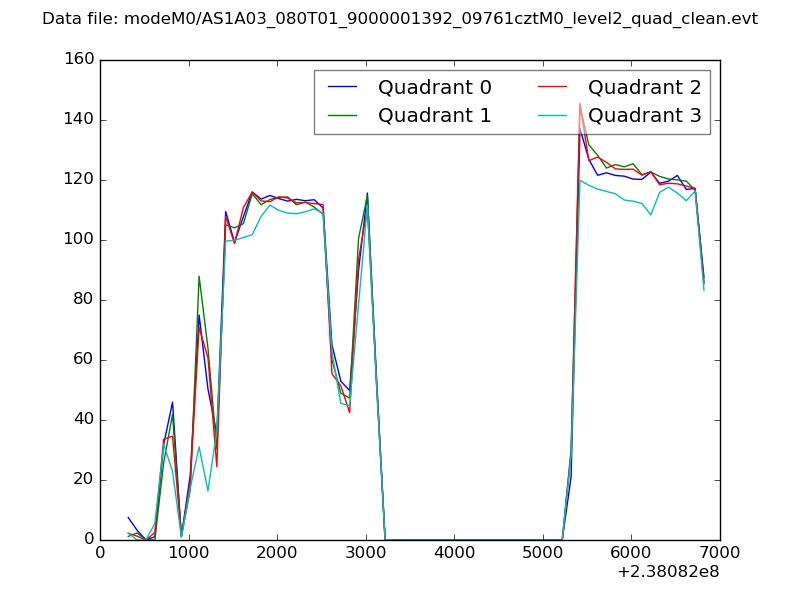 |
|
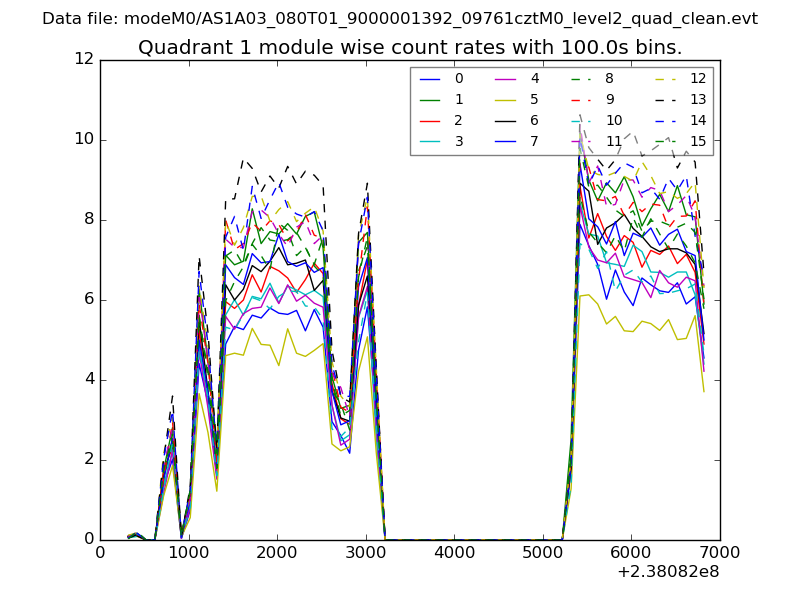
| Module-wise count rates for Quadrant A Data is divided into 100 sec bins |
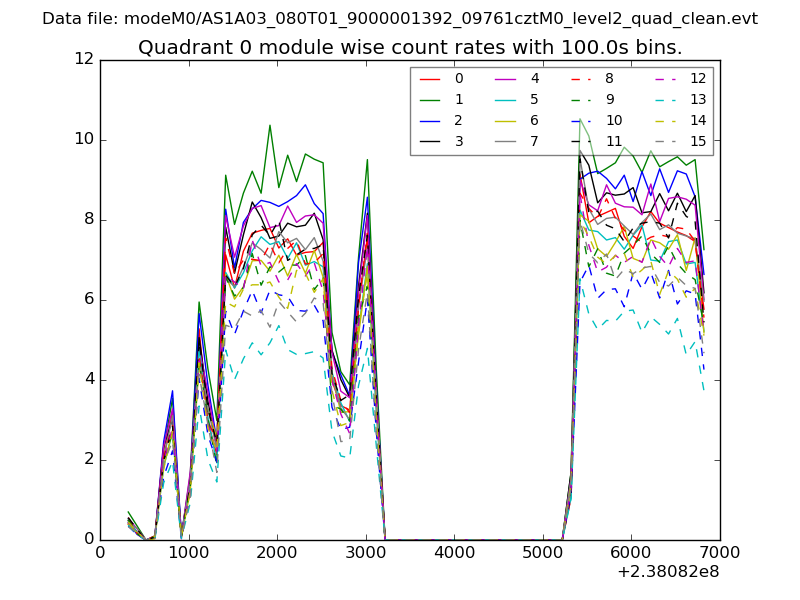 |
 |
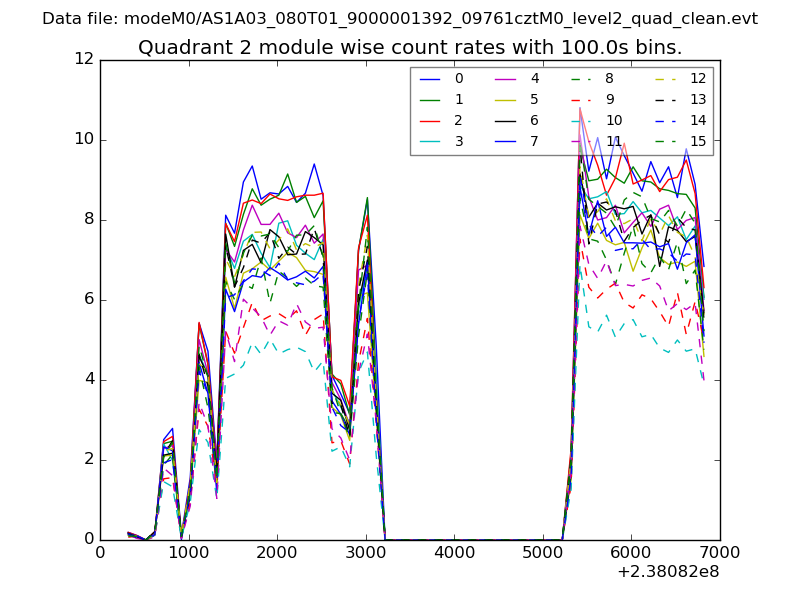
| Module-wise count rates for Quadrant B Data is divided into 100 sec bins |
 |
 |
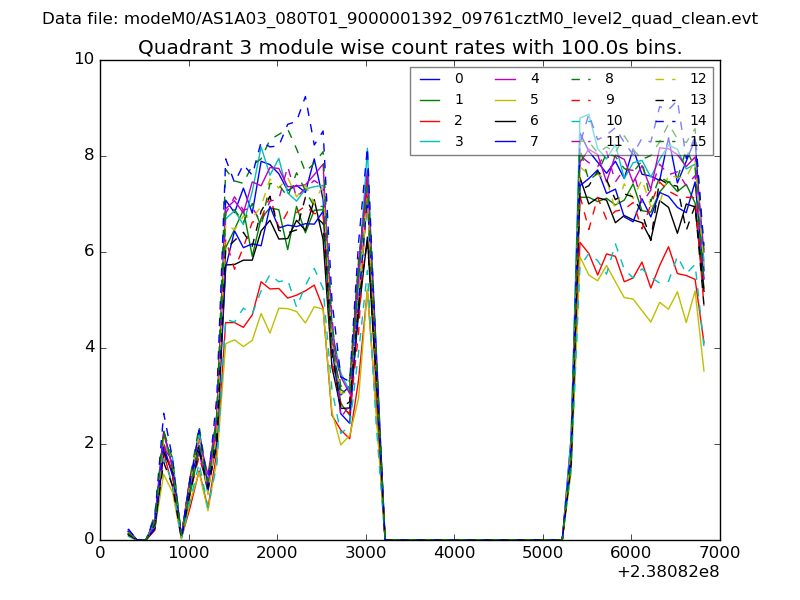
| Module-wise count rates for Quadrant C Data is divided into 100 sec bins |
 |
 |
| Module-wise count rates for Quadrant D Data is divided into 100 sec bins |
 |
 |
| Parameter | Plot |
|---|---|
| CZT HV Monitor | 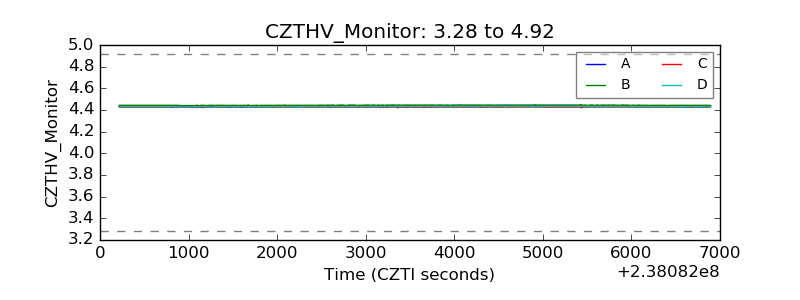 |
| D_VDD | 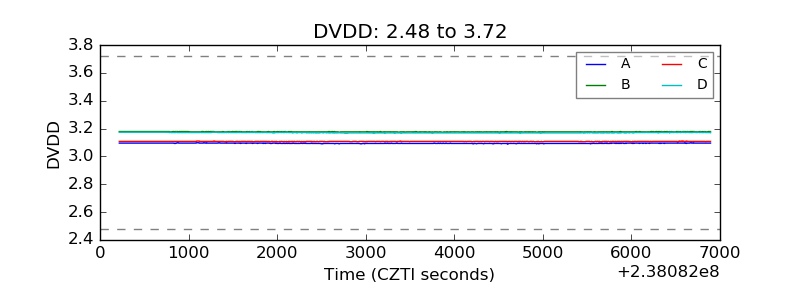 |
| Temperature 1 | 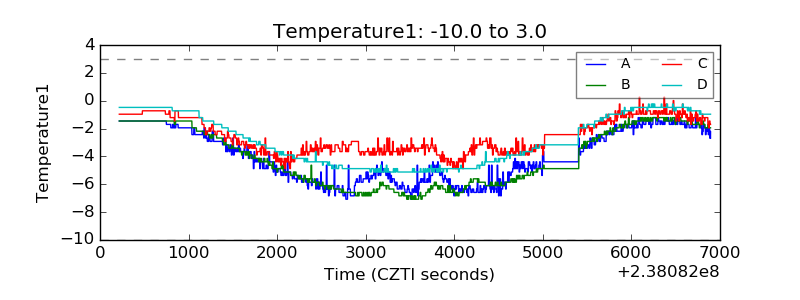 |
| Veto HV Monitor | 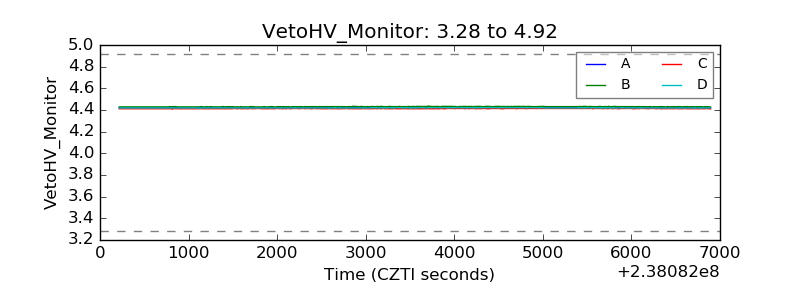 |
| Veto LLD | 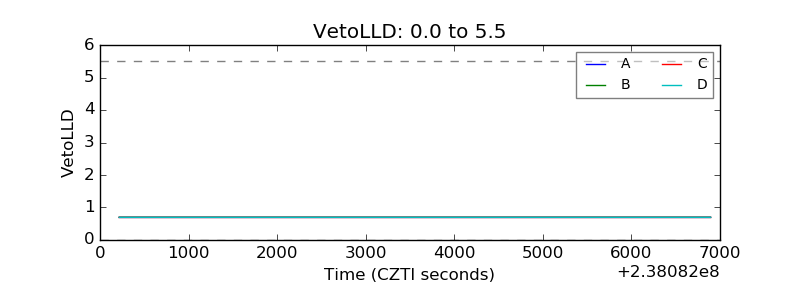 |
| Alpha Counter | 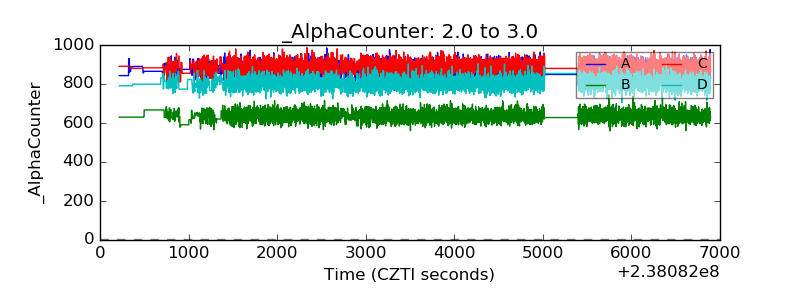 |
| _CPM_Rate | 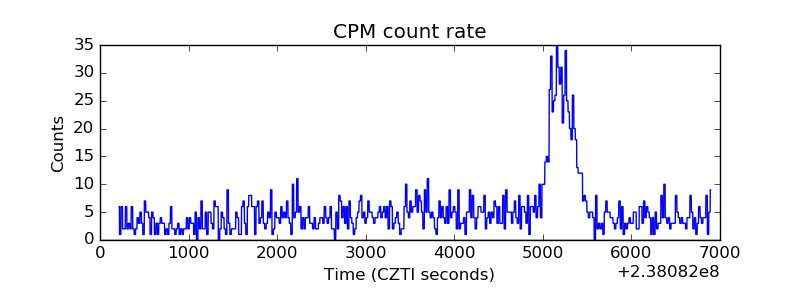 |
| CZT Counter | 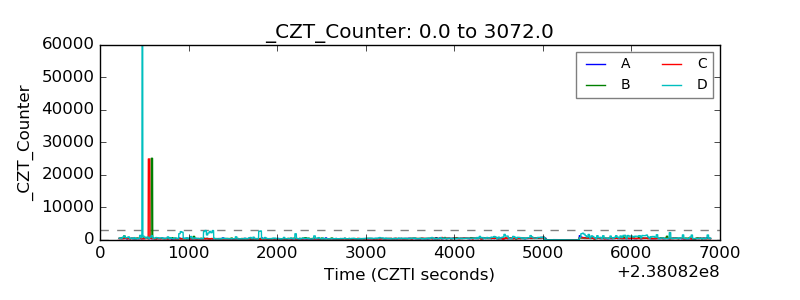 |
| +2.5 Volts monitor |  |
| +5 Volts monitor | 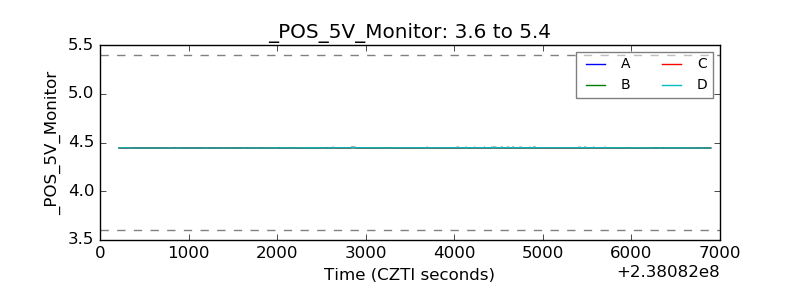 |
| _ROLL_ROT | 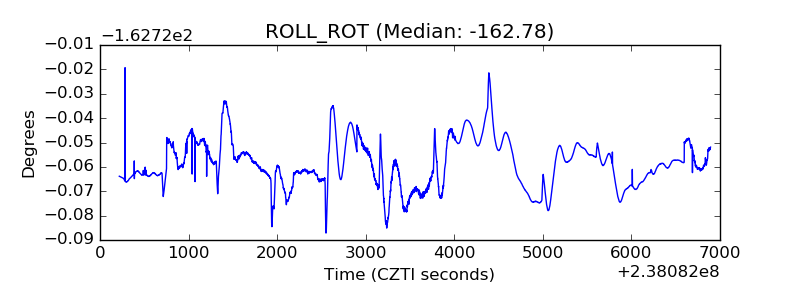 |
| _Roll_DEC | 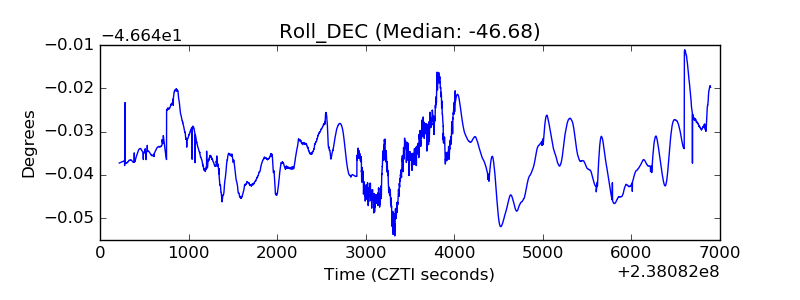 |
| _Roll_RA |  |
| Veto Counter | 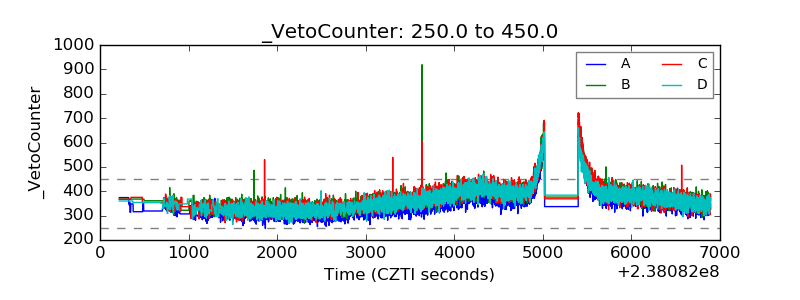 |