| Param | Original file | Final file |
|---|---|---|
| Filename | modeM0/AS1A03_080T01_9000001392_09763cztM0_level2.evt | modeM0/AS1A03_080T01_9000001392_09763cztM0_level2_quad_clean.evt |
| Size (bytes) | 588,934,080 | 121,792,320 |
| Size | 561.7 MB | 116.2 MB |
| Events in quadrant A | 4,149,229 | 777,535 |
| Events in quadrant B | 4,308,952 | 777,260 |
| Events in quadrant C | 3,936,825 | 768,908 |
| Events in quadrant D | 4,823,730 | 735,367 |
| Mode M0 | |||
|---|---|---|---|
| Quadrant | BADHDUFLAG | Total packets | Discarded packets |
| A | 0 | 25983 | 7484 |
| B | 0 | 26296 | 7508 |
| C | 0 | 25528 | 7308 |
| D | 0 | 28644 | 8142 |
| Mode M9 | |||
|---|---|---|---|
| Quadrant | BADHDUFLAG | Total packets | Discarded packets |
| A | 0 | 13 | 2 |
| B | 0 | 13 | 1 |
| C | 0 | 13 | 3 |
| D | 0 | 13 | 2 |
| Mode SS | |||
|---|---|---|---|
| Quadrant | BADHDUFLAG | Total packets | Discarded packets |
| A | 0 | 258 | 52 |
| B | 0 | 258 | 68 |
| C | 0 | 256 | 55 |
| D | 0 | 257 | 67 |
| Quadrant | Total seconds | Saturated seconds | Saturation percentage |
|---|---|---|---|
| A | 9046 | 51 | 0.563785% |
| B | 9006 | 65 | 0.721741% |
| C | 9004 | 15 | 0.166593% |
| D | 8973 | 62 | 0.690962% |
Noise dominated data is calculated using 1-second bins in cleaned event files. If a bin has >2000 counts, and if more than 50% of those come from <1% of pixels, then it is considered to be noise-dominated and hence unusable.
| Quadrant | # 1 sec bins | Bins with >0 counts | Bins with >2000 counts | High rate bins dominated by noise | Noise dominated (total time) | Noise dominated (detector-on time) | Marked lightcurve |
|---|---|---|---|---|---|---|---|
| A | 13942 | 10304 | 3 | 3 | 0.02% | 0.03% | 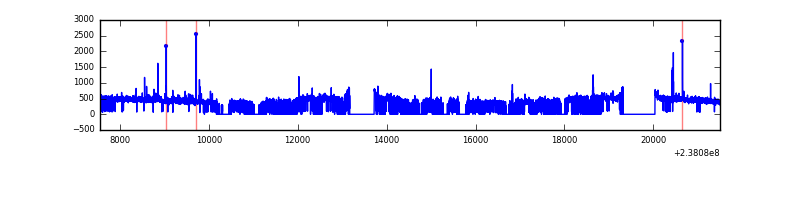 |
| B | 13941 | 10303 | 5 | 5 | 0.04% | 0.05% | 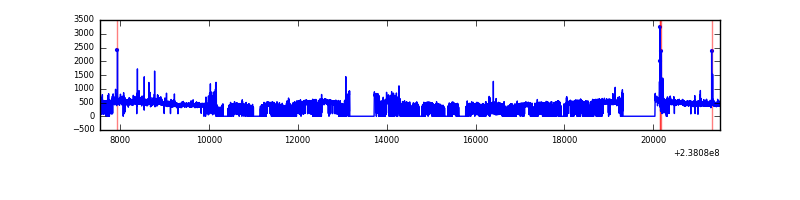 |
| C | 13942 | 10291 | 0 | 0 | 0.00% | 0.00% | 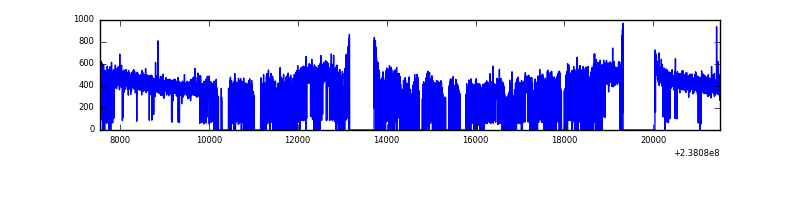 |
| D | 13942 | 10263 | 43 | 43 | 0.31% | 0.42% | 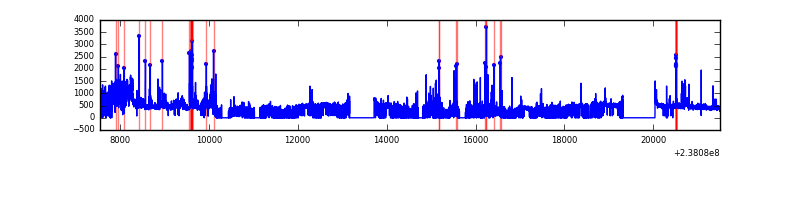 |
Top three noisy pixels from each quadrant. If the there are fewer than three noisy pixels in the level2.evt file, extra rows are filled as -1
| Pixel properties | Quadrant properties | ||||||
|---|---|---|---|---|---|---|---|
| Quadrant | DetID | PixID | Counts | Sigma | Mean | Median | Sigma |
| A | 15 | 174 | 42522 | 191.87 | 1053 | 1027 | 216.3 |
| A | 14 | 111 | 27628 | 123.0 | 1053 | 1027 | 216.3 |
| A | 8 | 15 | 21425 | 94.32 | 1053 | 1027 | 216.3 |
| B | 0 | 214 | 60161 | 293.6 | 1048 | 1021 | 201.4 |
| B | 10 | 245 | 49569 | 241.02 | 1048 | 1021 | 201.4 |
| B | 0 | 229 | 39141 | 189.25 | 1048 | 1021 | 201.4 |
| C | 13 | 61 | 7460 | 27.6 | 1007 | 1010 | 233.7 |
| C | 8 | 222 | 4951 | 16.86 | 1007 | 1010 | 233.7 |
| C | 14 | 67 | 2789 | 7.61 | 1007 | 1010 | 233.7 |
| D | 1 | 52 | 782969 | 3120.12 | 999 | 973 | 250.6 |
| D | 7 | 71 | 73412 | 289.03 | 999 | 973 | 250.6 |
| D | 2 | 152 | 60846 | 238.89 | 999 | 973 | 250.6 |
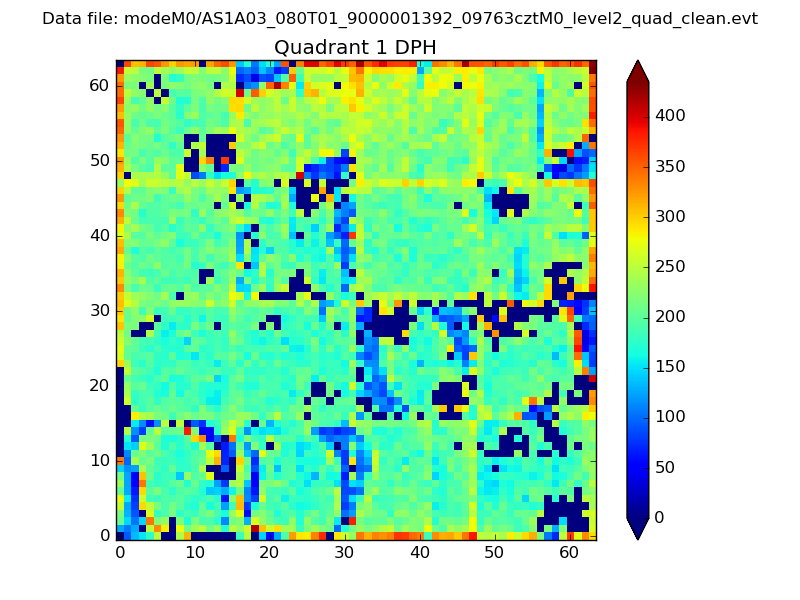
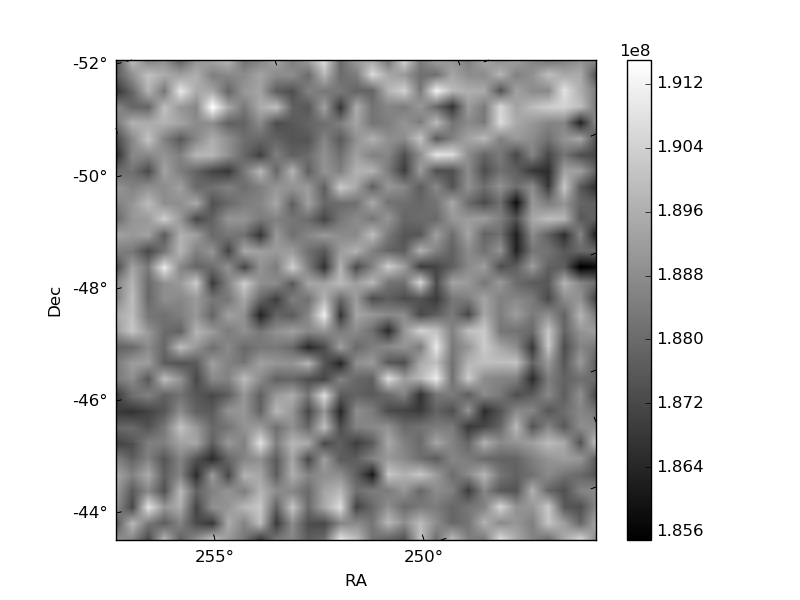
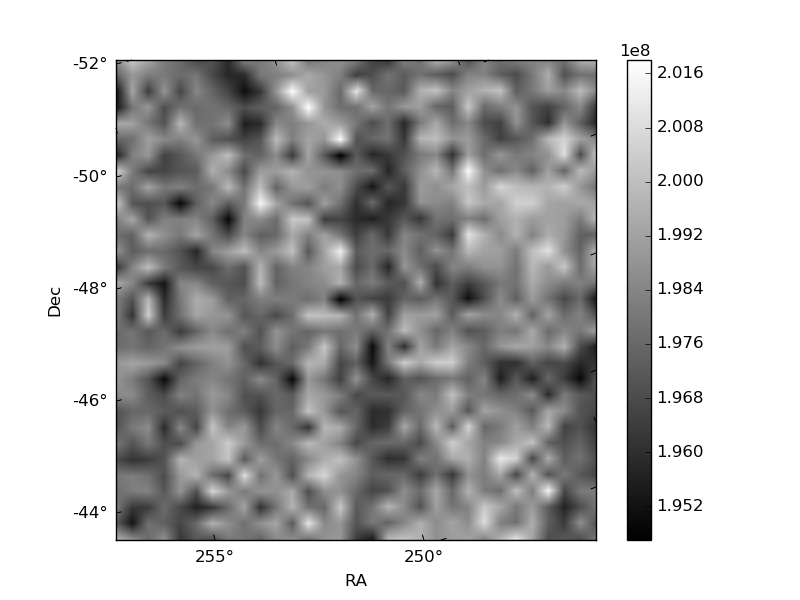
Histogram calculated using DETX and DETY for each event in the final _common_clean file
| Quadrant A |  |
 |
Quadrant B |
|---|---|---|---|
| Quadrant D | 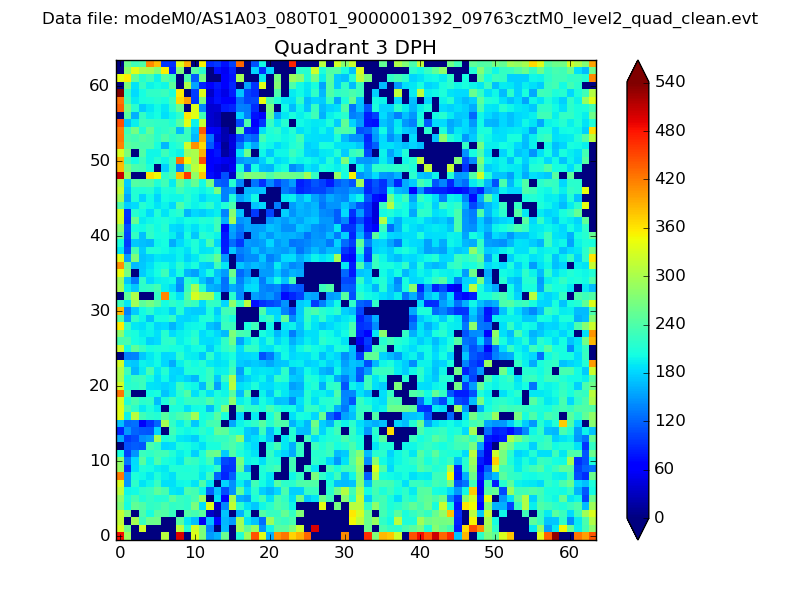 |
 |
Quadrant C |
| Plot type | Count rate plots | Images |
|---|---|---|
| Comparison with Poisson distribution Blue bars denote a histogram of data divided into 1 sec bins. Red curve is a Poisson curve with rate = median count rate of data. |
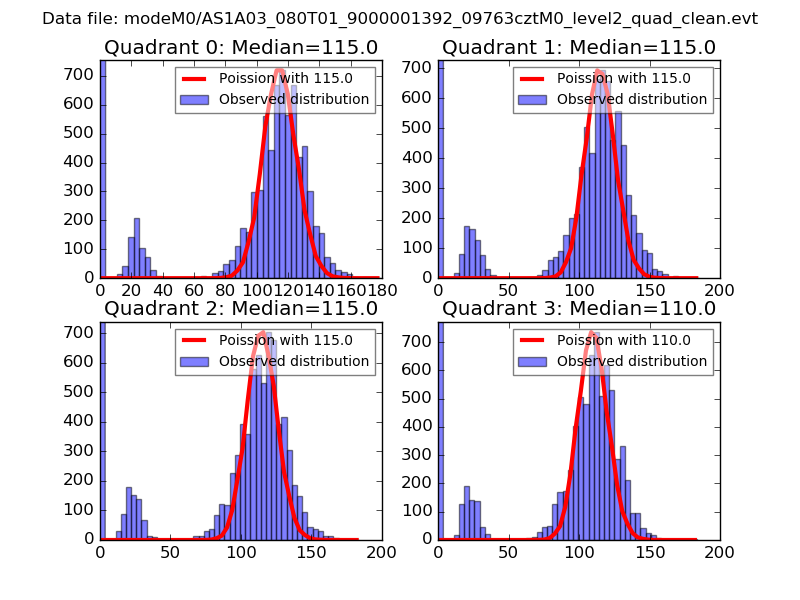 |
 |
| Quadrant-wise count rates Data is divided into 100 sec bins |
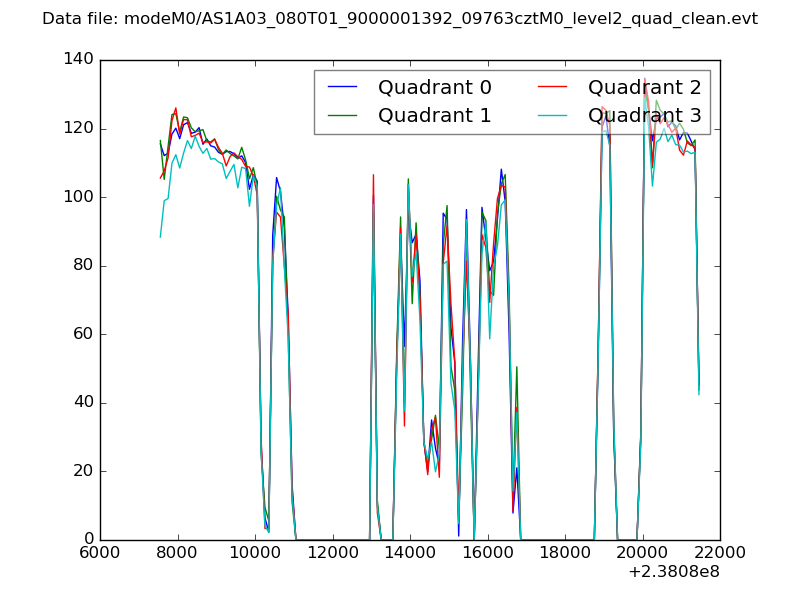 |
|
| Module-wise count rates for Quadrant A Data is divided into 100 sec bins |
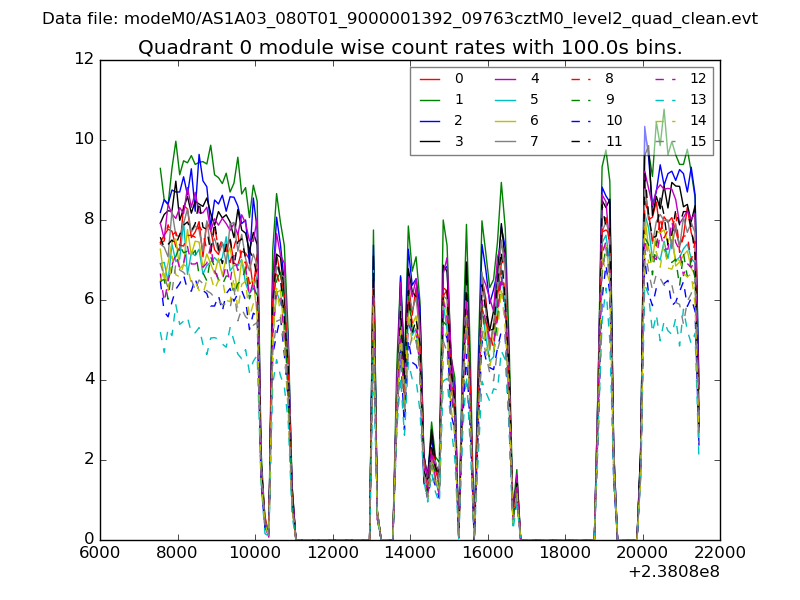 |
 |
| Module-wise count rates for Quadrant B Data is divided into 100 sec bins |
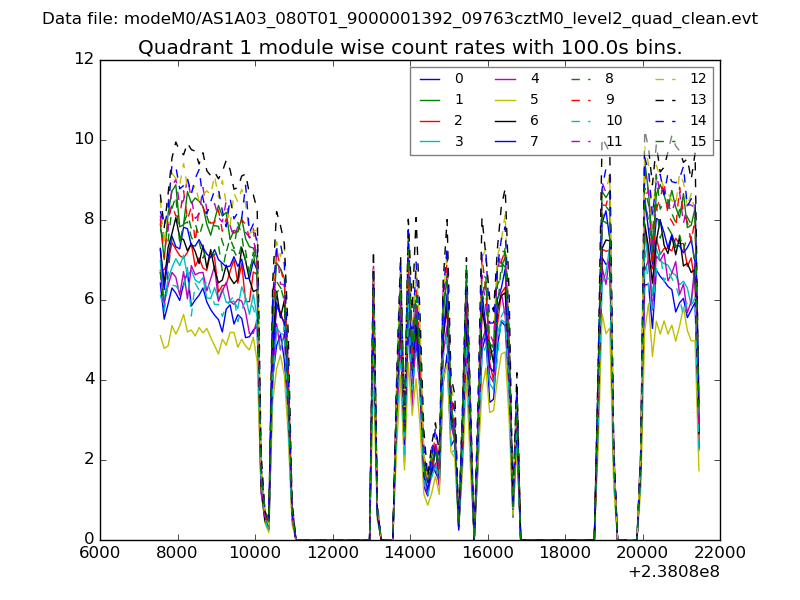 |
 |
| Module-wise count rates for Quadrant C Data is divided into 100 sec bins |
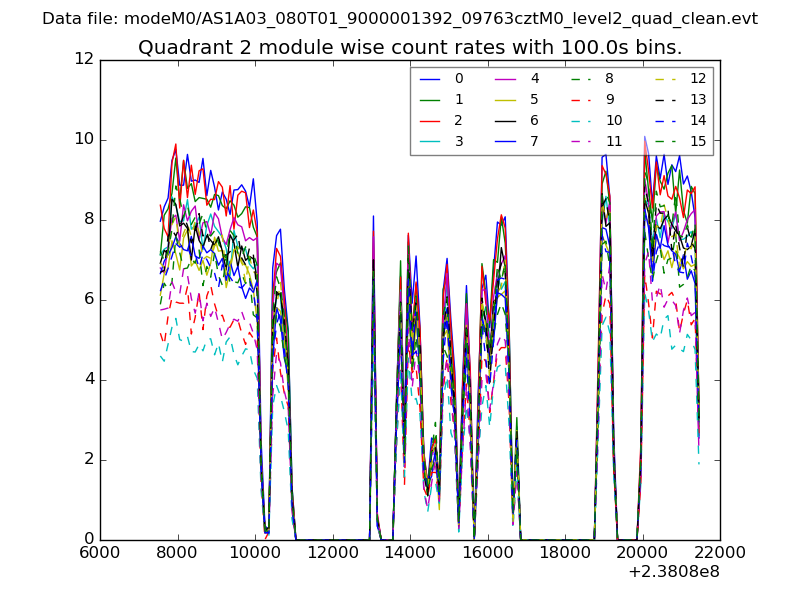 |
 |
| Module-wise count rates for Quadrant D Data is divided into 100 sec bins |
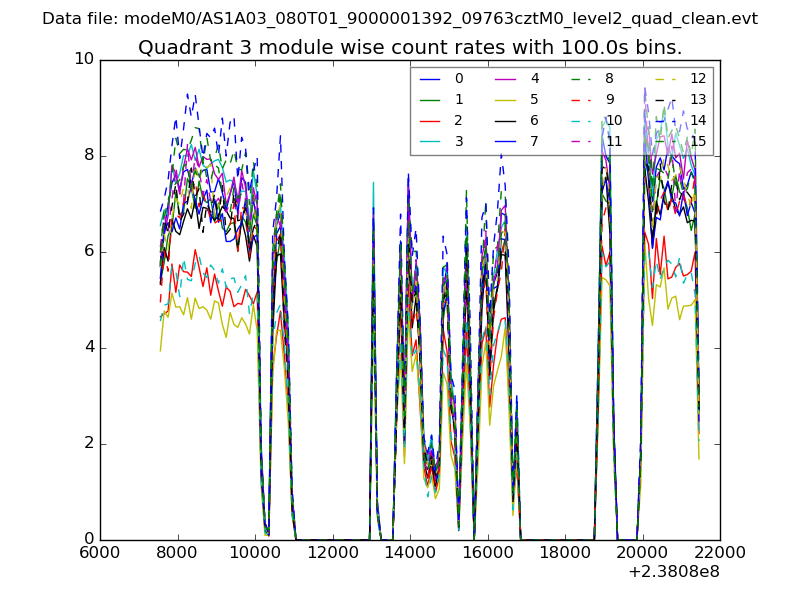 |
 |
| Parameter | Plot |
|---|---|
| CZT HV Monitor | 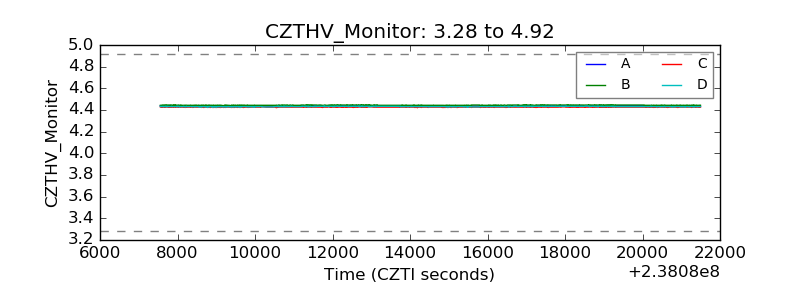 |
| D_VDD | 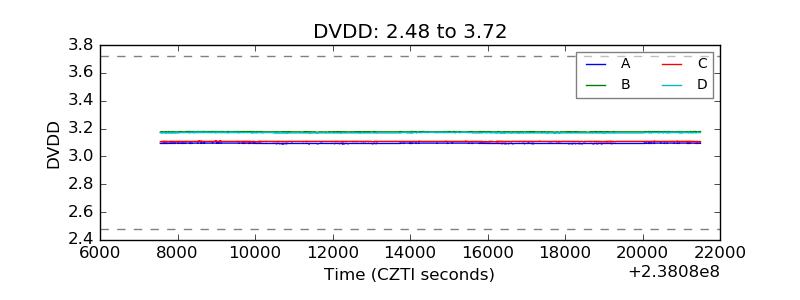 |
| Temperature 1 | 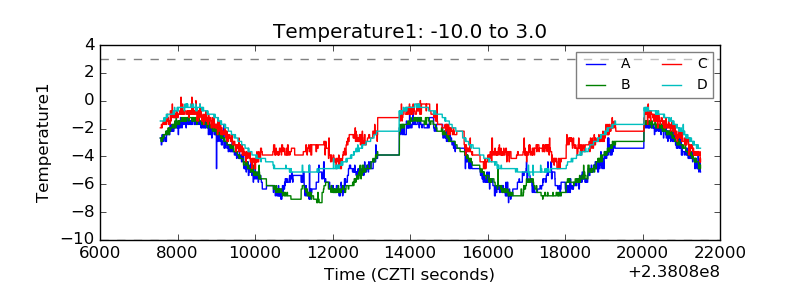 |
| Veto HV Monitor | 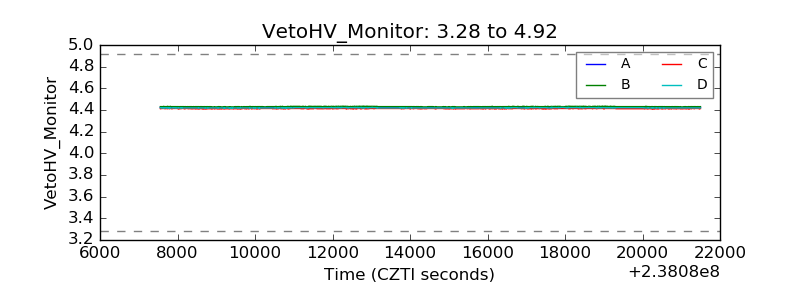 |
| Veto LLD | 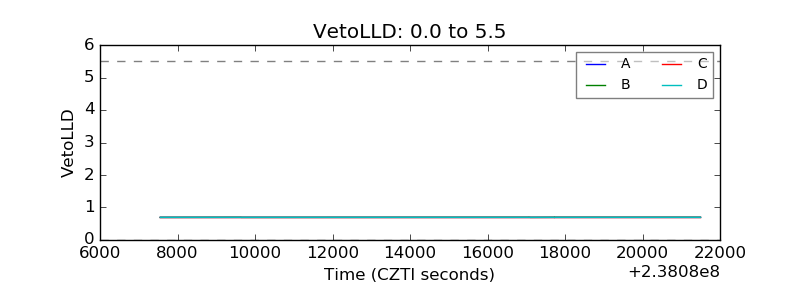 |
| Alpha Counter | 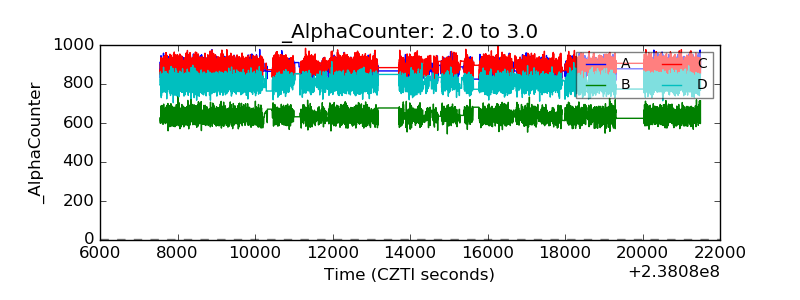 |
| _CPM_Rate | 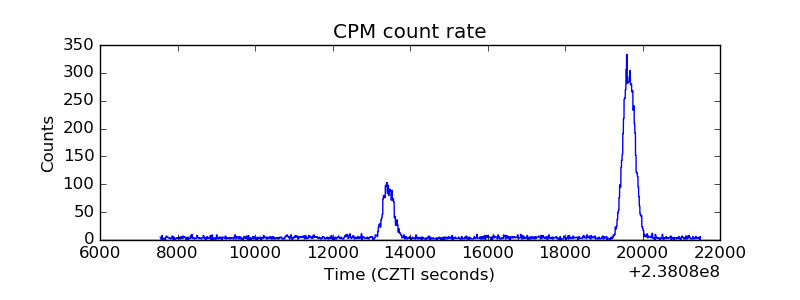 |
| CZT Counter | 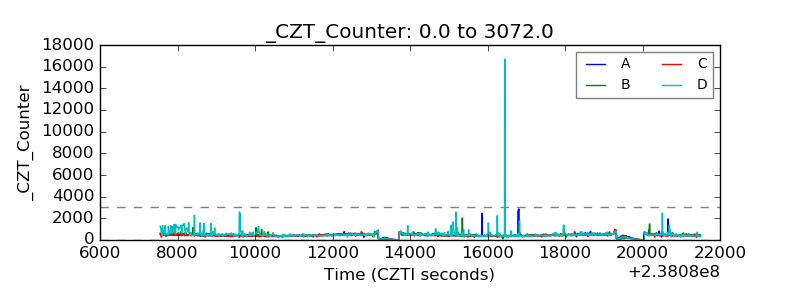 |
| +2.5 Volts monitor |  |
| +5 Volts monitor |  |
| _ROLL_ROT | 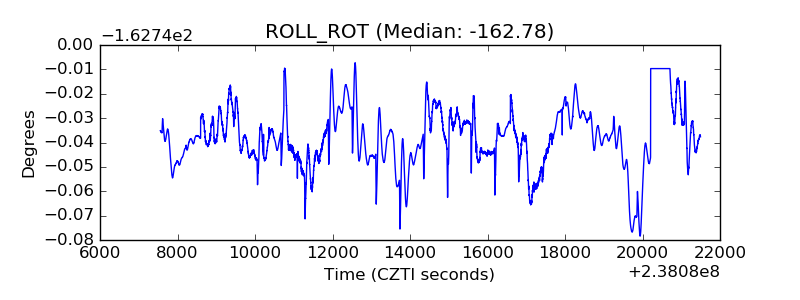 |
| _Roll_DEC | 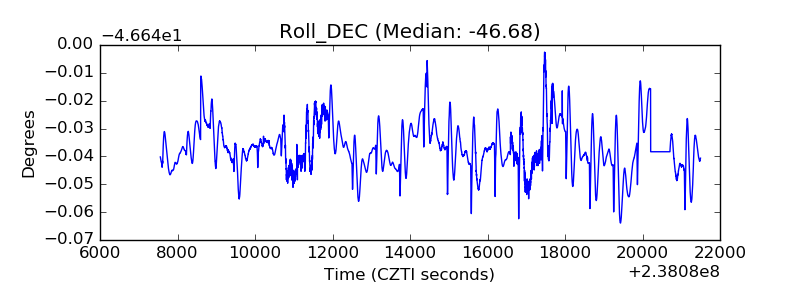 |
| _Roll_RA | 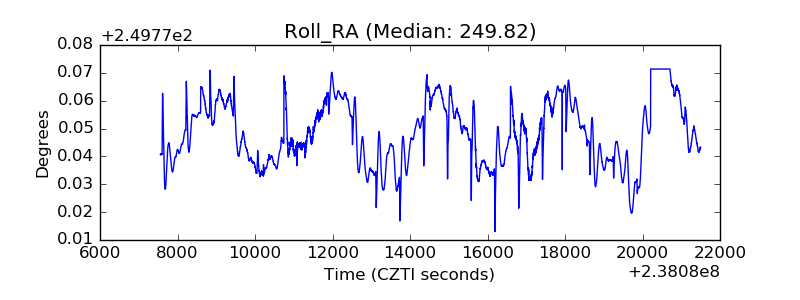 |
| Veto Counter | 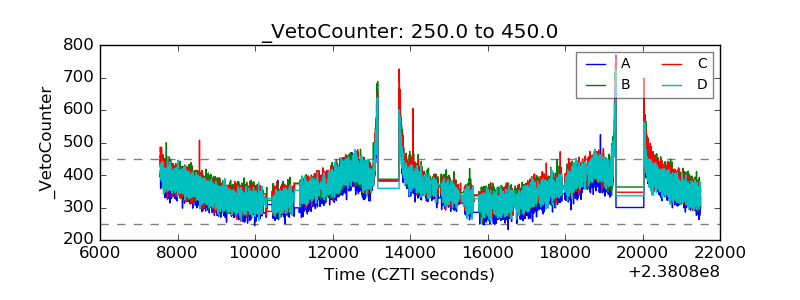 |