| Param | Original file | Final file |
|---|---|---|
| Filename | modeM0/AS1A03_080T01_9000001392_09764cztM0_level2.evt | modeM0/AS1A03_080T01_9000001392_09764cztM0_level2_quad_clean.evt |
| Size (bytes) | 405,380,160 | 84,643,200 |
| Size | 386.6 MB | 80.7 MB |
| Events in quadrant A | 2,893,211 | 532,812 |
| Events in quadrant B | 3,047,430 | 538,490 |
| Events in quadrant C | 2,782,464 | 532,600 |
| Events in quadrant D | 3,119,196 | 514,356 |
| Mode M0 | |||
|---|---|---|---|
| Quadrant | BADHDUFLAG | Total packets | Discarded packets |
| A | 0 | 13778 | 791 |
| B | 0 | 14092 | 783 |
| C | 0 | 13596 | 735 |
| D | 0 | 14616 | 777 |
| Mode M9 | |||
|---|---|---|---|
| Quadrant | BADHDUFLAG | Total packets | Discarded packets |
| A | 0 | 12 | 2 |
| B | 0 | 11 | 0 |
| C | 0 | 12 | 1 |
| D | 0 | 13 | 0 |
| Mode SS | |||
|---|---|---|---|
| Quadrant | BADHDUFLAG | Total packets | Discarded packets |
| A | 0 | 136 | 8 |
| B | 0 | 136 | 6 |
| C | 0 | 136 | 0 |
| D | 0 | 136 | 4 |
| Quadrant | Total seconds | Saturated seconds | Saturation percentage |
|---|---|---|---|
| A | 6353 | 31 | 0.487958% |
| B | 6373 | 48 | 0.753177% |
| C | 6361 | 14 | 0.220091% |
| D | 6375 | 37 | 0.580392% |
Noise dominated data is calculated using 1-second bins in cleaned event files. If a bin has >2000 counts, and if more than 50% of those come from <1% of pixels, then it is considered to be noise-dominated and hence unusable.
| Quadrant | # 1 sec bins | Bins with >0 counts | Bins with >2000 counts | High rate bins dominated by noise | Noise dominated (total time) | Noise dominated (detector-on time) | Marked lightcurve |
|---|---|---|---|---|---|---|---|
| A | 7624 | 6641 | 2 | 2 | 0.03% | 0.03% | 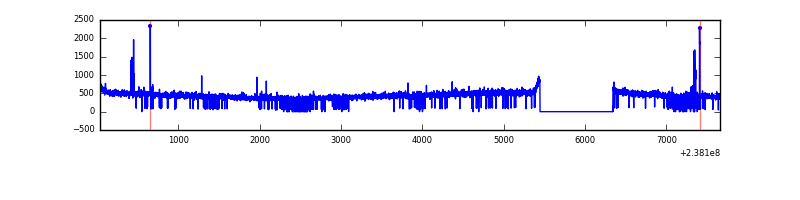 |
| B | 7624 | 6654 | 6 | 6 | 0.08% | 0.09% | 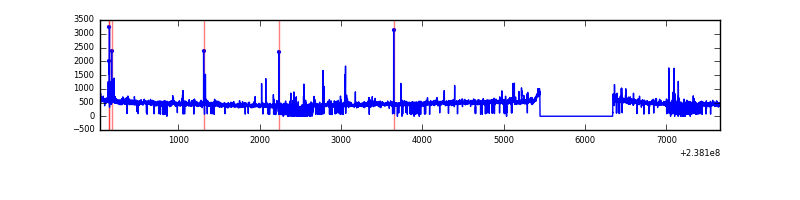 |
| C | 7624 | 6649 | 0 | 0 | 0.00% | 0.00% | 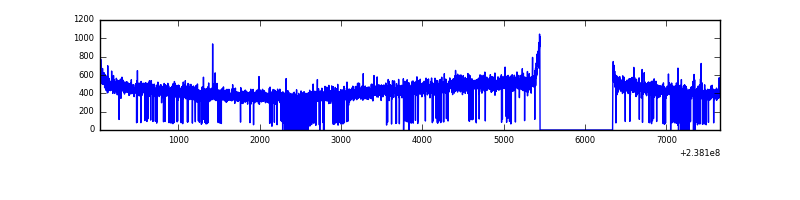 |
| D | 7624 | 6659 | 15 | 15 | 0.20% | 0.23% | 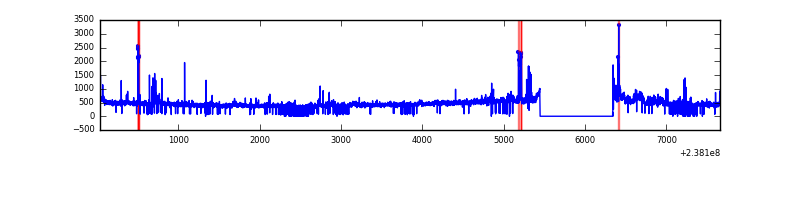 |
Top three noisy pixels from each quadrant. If the there are fewer than three noisy pixels in the level2.evt file, extra rows are filled as -1
| Pixel properties | Quadrant properties | ||||||
|---|---|---|---|---|---|---|---|
| Quadrant | DetID | PixID | Counts | Sigma | Mean | Median | Sigma |
| A | 15 | 174 | 40301 | 260.46 | 737 | 722 | 152.0 |
| A | 8 | 15 | 11684 | 72.14 | 737 | 722 | 152.0 |
| A | 0 | 226 | 7108 | 42.02 | 737 | 722 | 152.0 |
| B | 4 | 239 | 56891 | 390.51 | 742 | 725 | 143.8 |
| B | 10 | 245 | 46954 | 321.42 | 742 | 725 | 143.8 |
| B | 0 | 229 | 17789 | 118.64 | 742 | 725 | 143.8 |
| C | 13 | 61 | 5275 | 27.4 | 711 | 715 | 166.4 |
| C | 1 | 3 | 3412 | 16.2 | 711 | 715 | 166.4 |
| C | 8 | 222 | 2722 | 12.06 | 711 | 715 | 166.4 |
| D | 1 | 52 | 177235 | 985.81 | 706 | 688 | 179.1 |
| D | 7 | 46 | 109589 | 608.09 | 706 | 688 | 179.1 |
| D | 7 | 71 | 56644 | 312.45 | 706 | 688 | 179.1 |
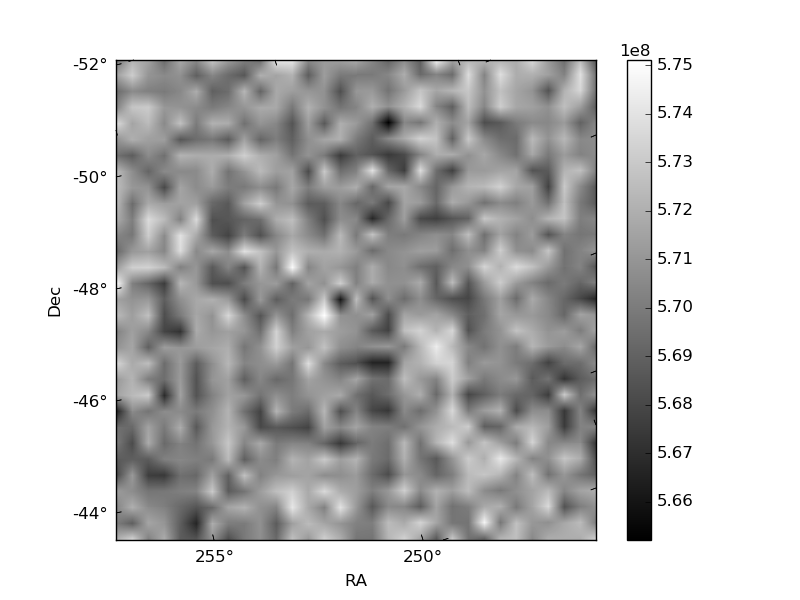
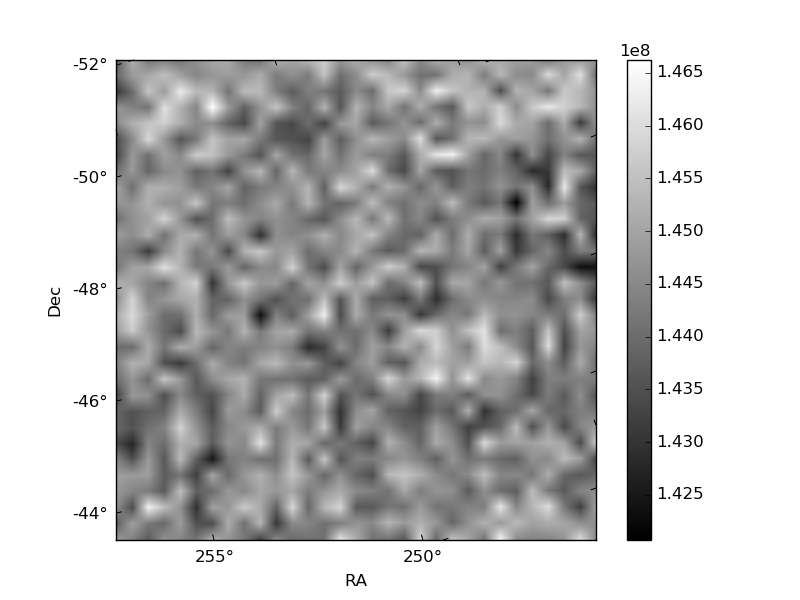
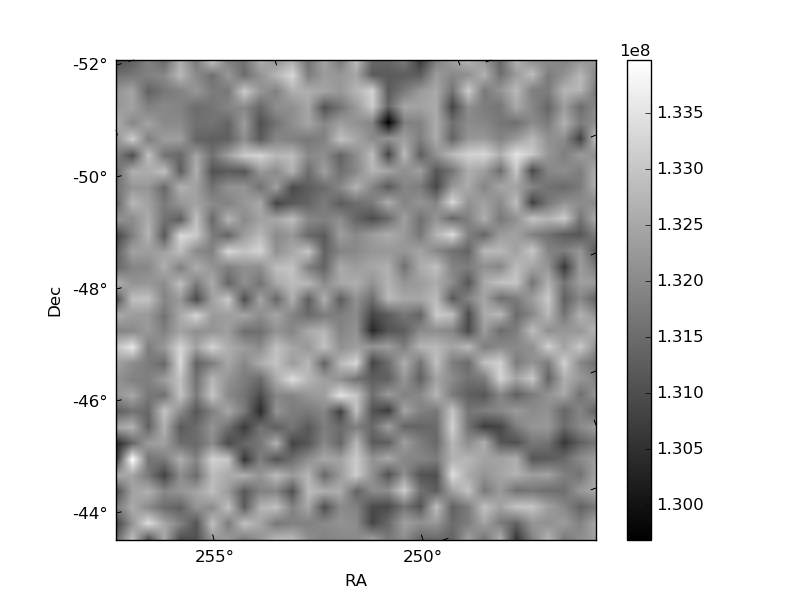
Histogram calculated using DETX and DETY for each event in the final _common_clean file
| Quadrant A | 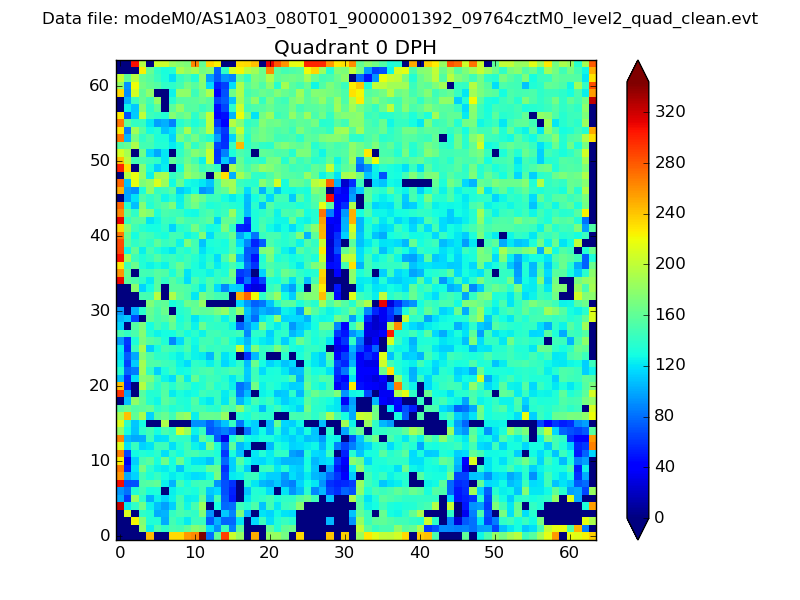 |
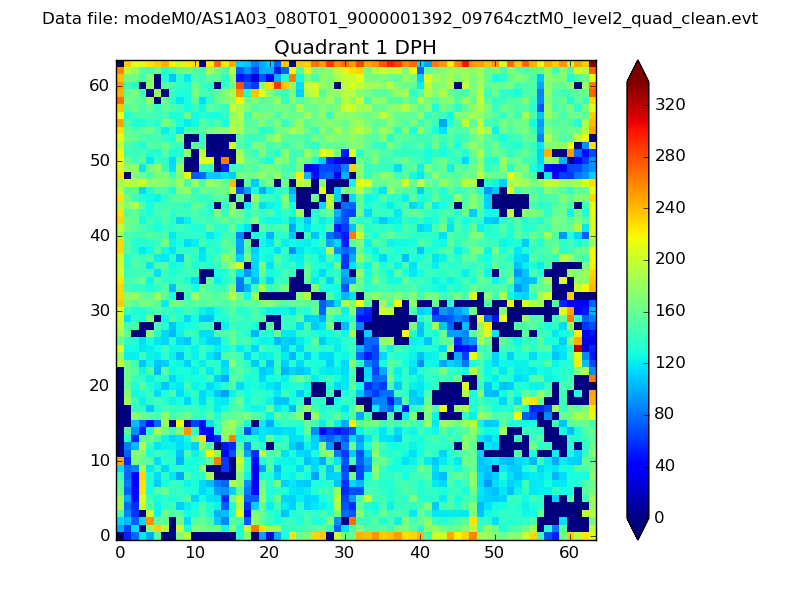 |
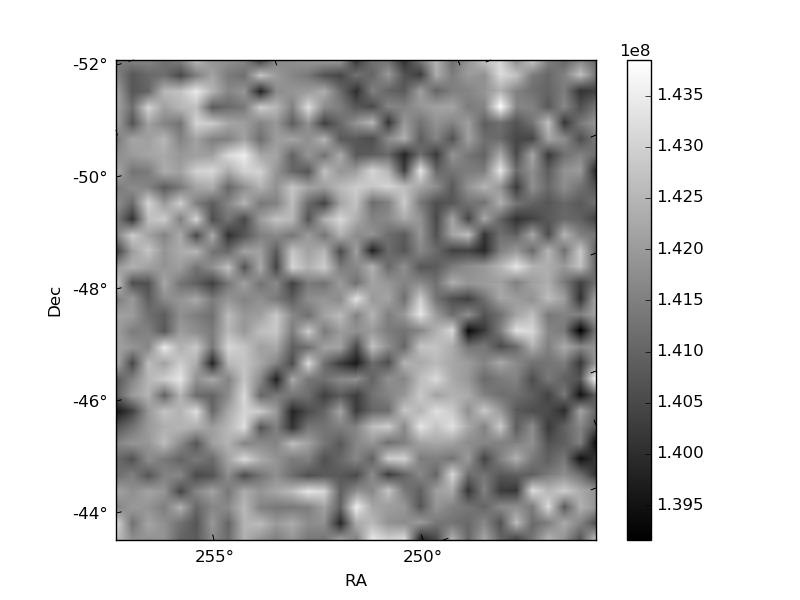
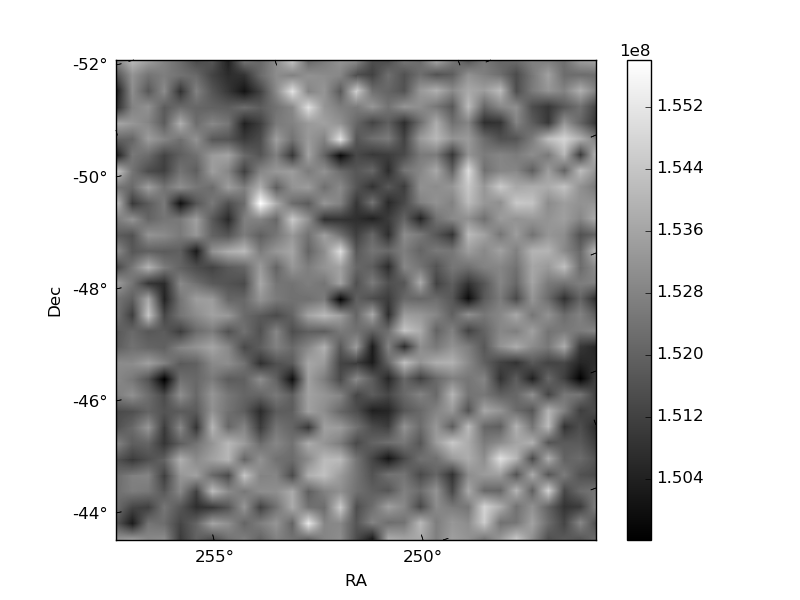
Quadrant B |
|---|---|---|---|
| Quadrant D | 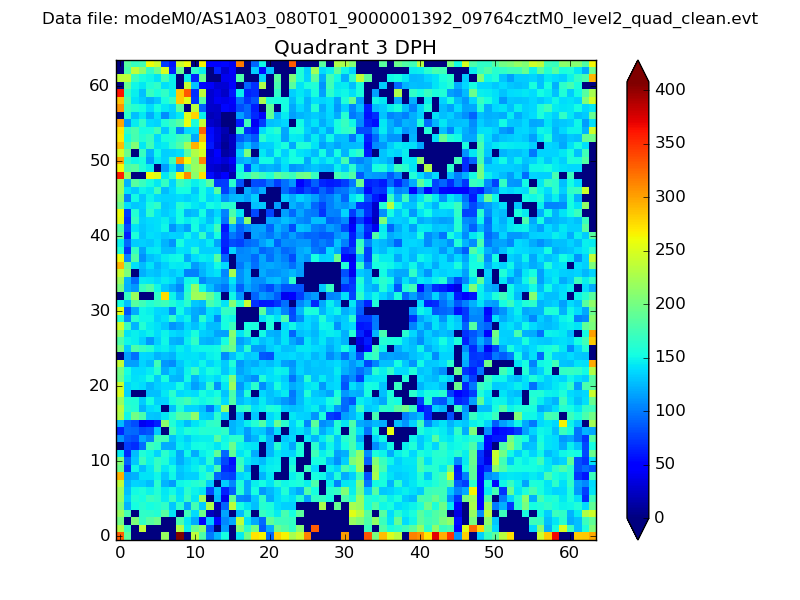 |
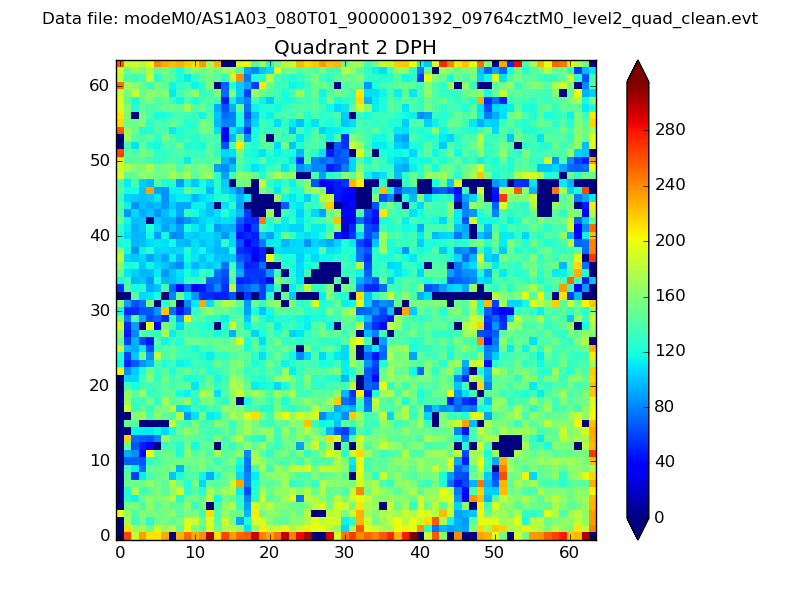 |
Quadrant C |
| Plot type | Count rate plots | Images |
|---|---|---|
| Comparison with Poisson distribution Blue bars denote a histogram of data divided into 1 sec bins. Red curve is a Poisson curve with rate = median count rate of data. |
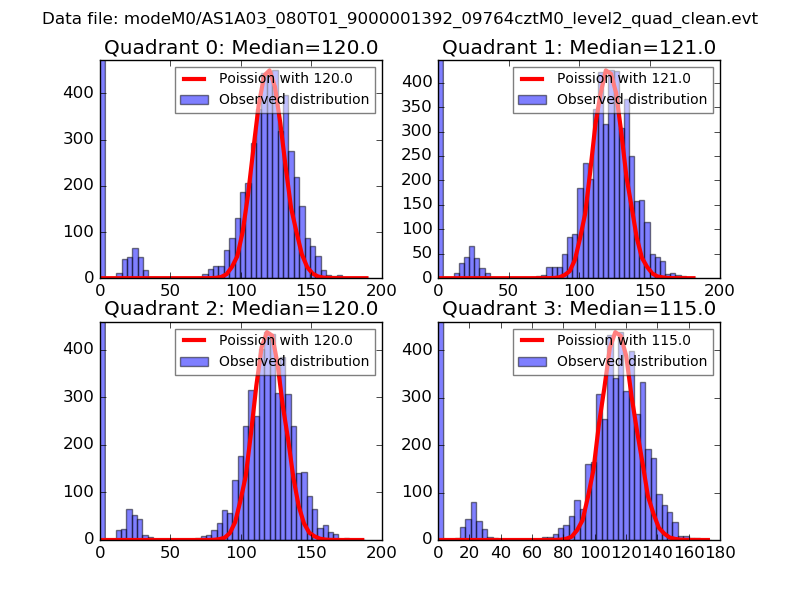 |
 |
| Quadrant-wise count rates Data is divided into 100 sec bins |
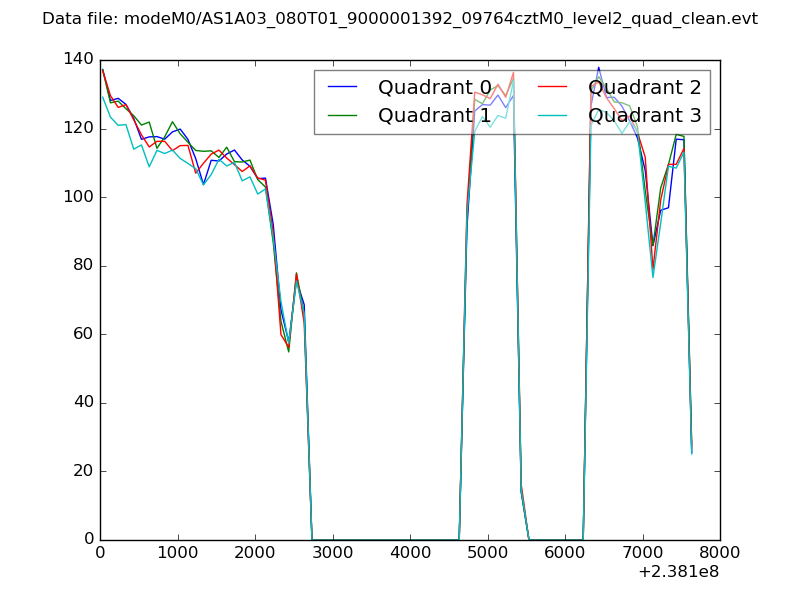 |
|
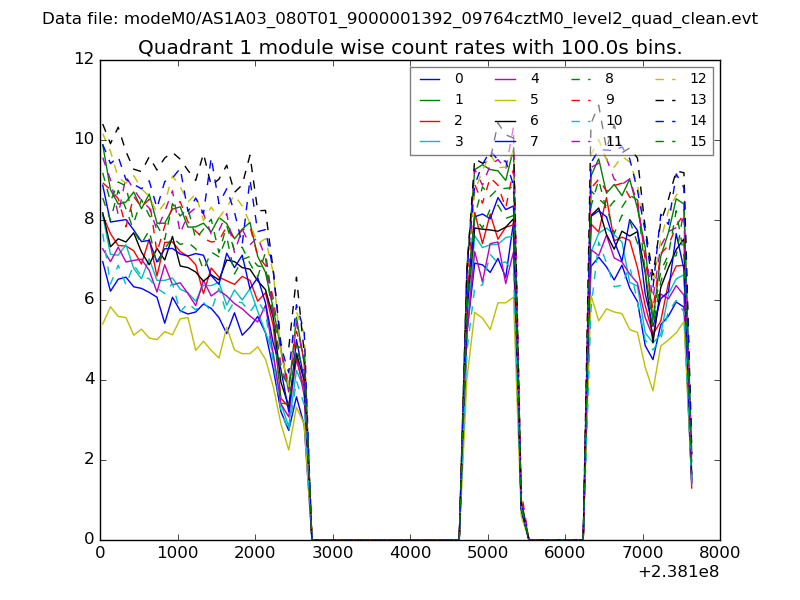
| Module-wise count rates for Quadrant A Data is divided into 100 sec bins |
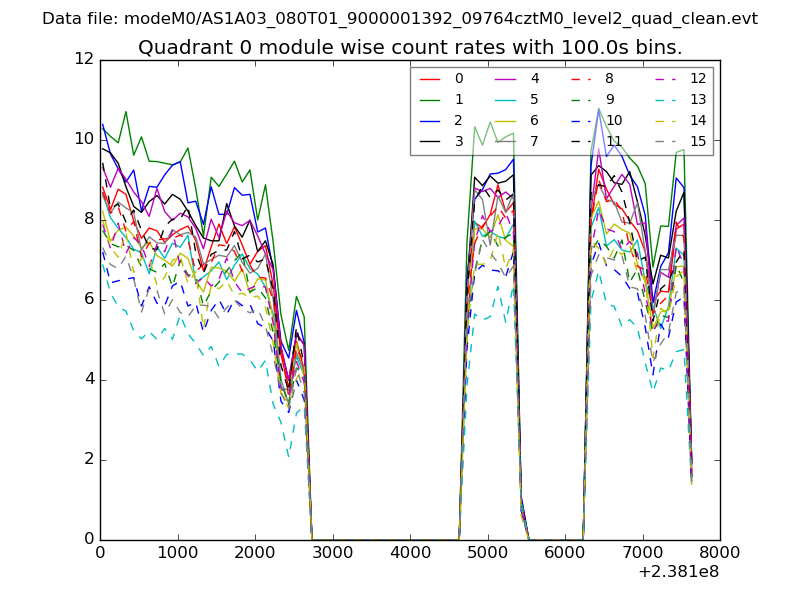 |
 |
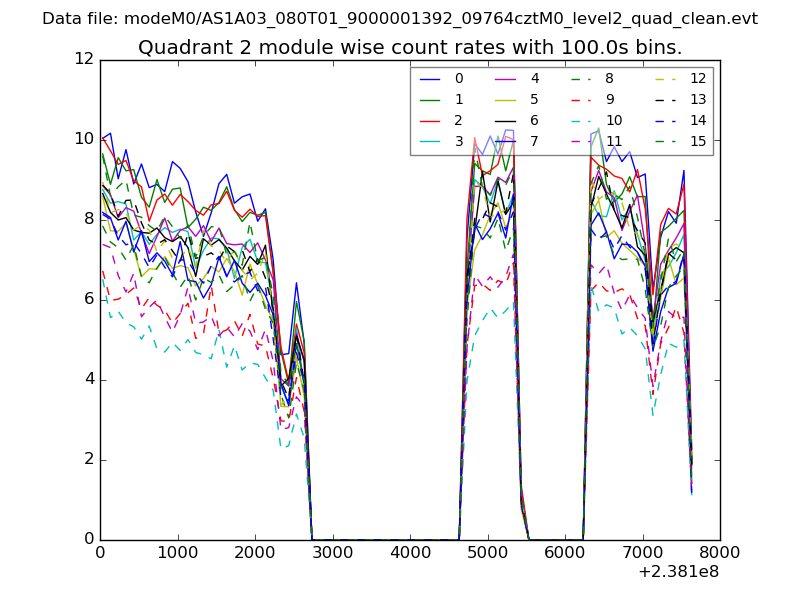
| Module-wise count rates for Quadrant B Data is divided into 100 sec bins |
 |
 |
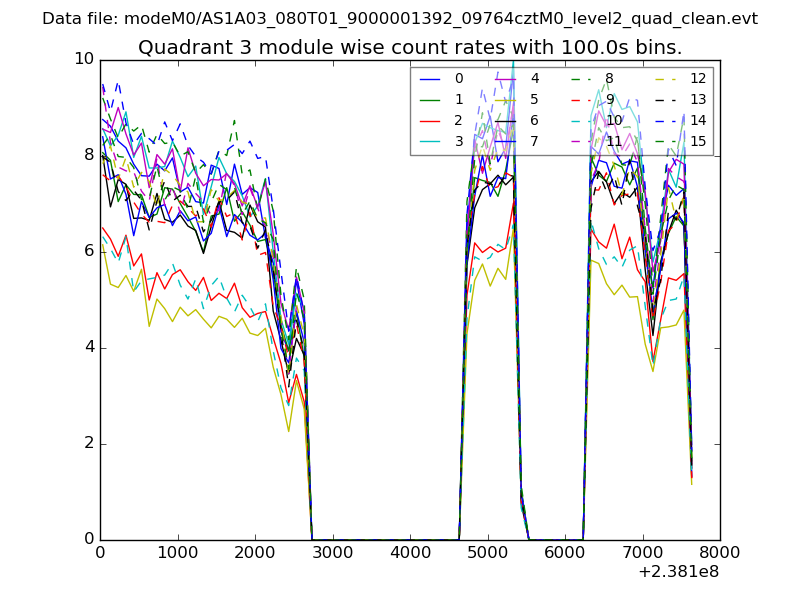
| Module-wise count rates for Quadrant C Data is divided into 100 sec bins |
 |
 |
| Module-wise count rates for Quadrant D Data is divided into 100 sec bins |
 |
 |
| Parameter | Plot |
|---|---|
| CZT HV Monitor | 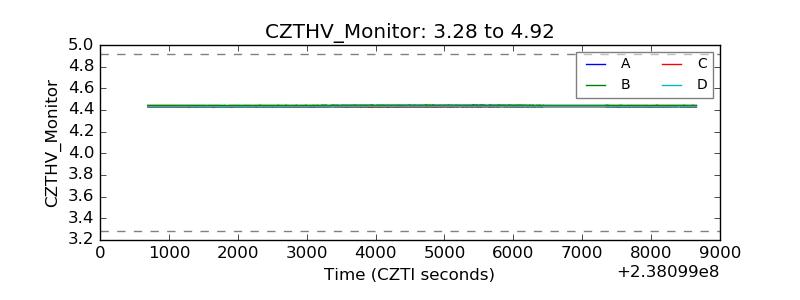 |
| D_VDD | 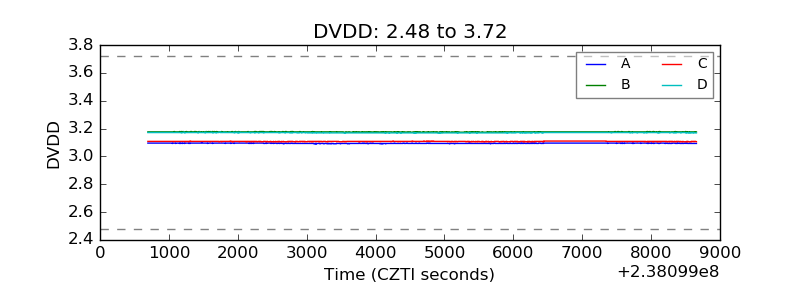 |
| Temperature 1 | 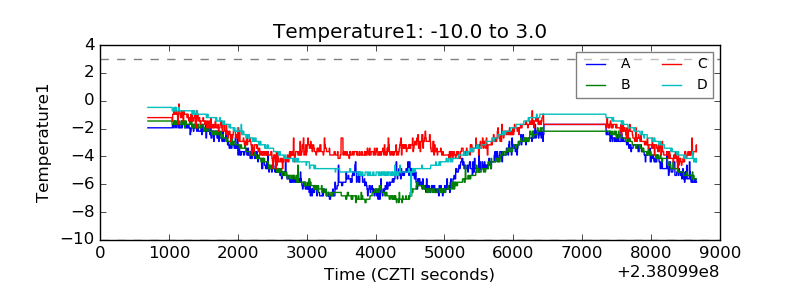 |
| Veto HV Monitor | 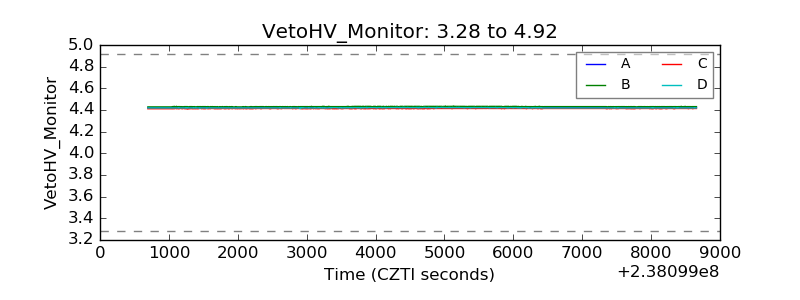 |
| Veto LLD | 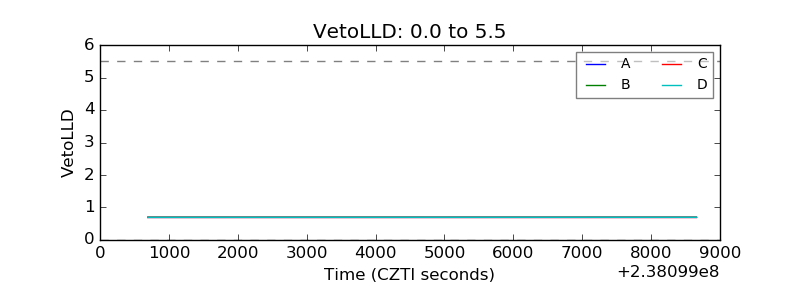 |
| Alpha Counter | 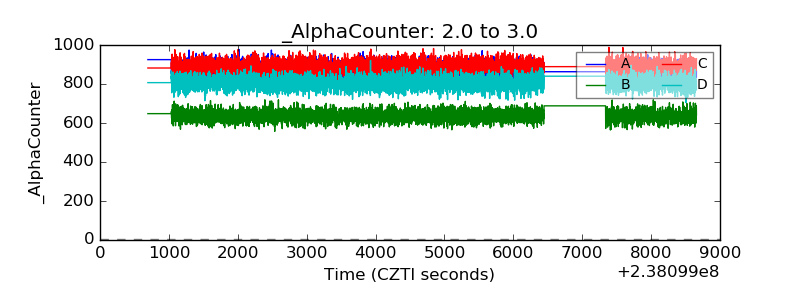 |
| _CPM_Rate | 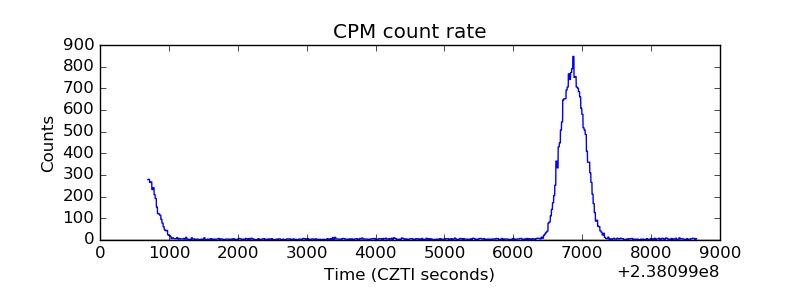 |
| CZT Counter | 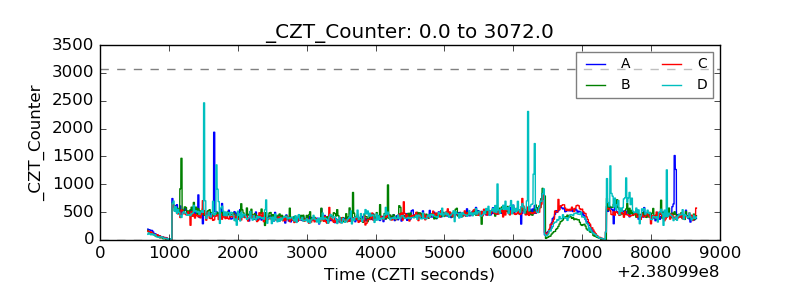 |
| +2.5 Volts monitor |  |
| +5 Volts monitor |  |
| _ROLL_ROT | 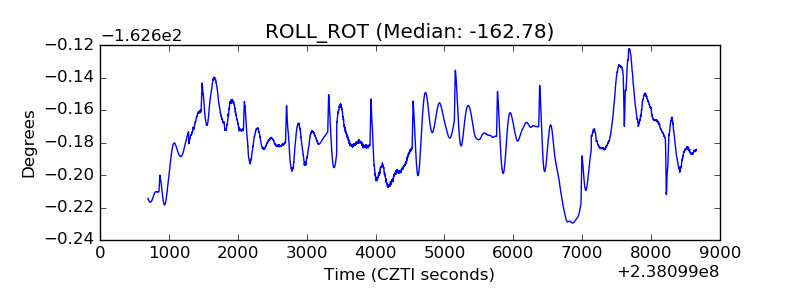 |
| _Roll_DEC | 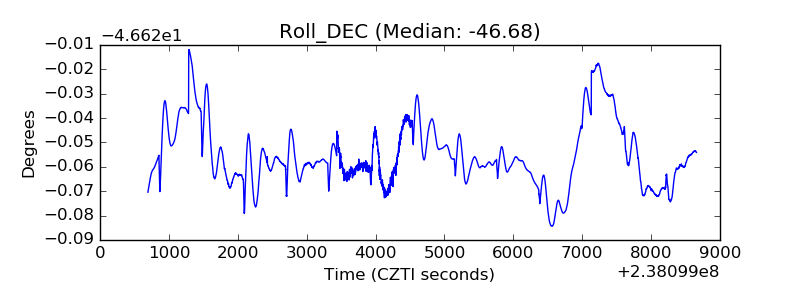 |
| _Roll_RA | 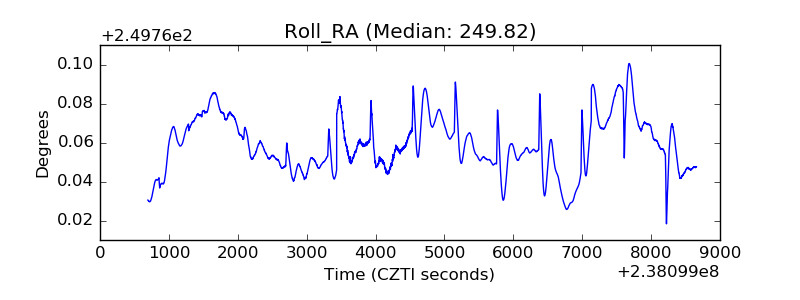 |
| Veto Counter | 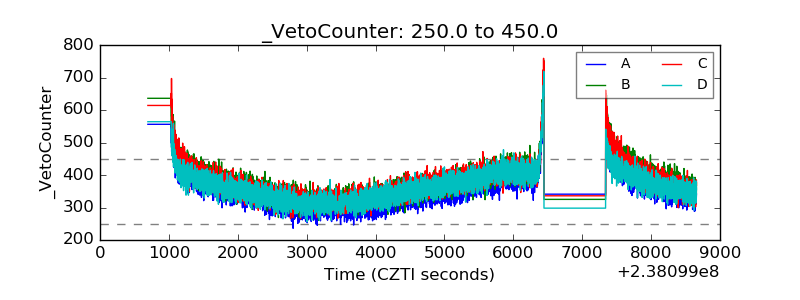 |