| Param | Original file | Final file |
|---|---|---|
| Filename | modeM0/AS1A03_080T01_9000001392_09765cztM0_level2.evt | modeM0/AS1A03_080T01_9000001392_09765cztM0_level2_quad_clean.evt |
| Size (bytes) | 434,566,080 | 92,344,320 |
| Size | 414.4 MB | 88.1 MB |
| Events in quadrant A | 3,107,007 | 586,281 |
| Events in quadrant B | 3,355,268 | 590,127 |
| Events in quadrant C | 2,972,842 | 586,877 |
| Events in quadrant D | 3,269,645 | 565,873 |
| Mode M0 | |||
|---|---|---|---|
| Quadrant | BADHDUFLAG | Total packets | Discarded packets |
| A | 0 | 13926 | 65 |
| B | 0 | 14668 | 75 |
| C | 0 | 13685 | 71 |
| D | 0 | 14495 | 73 |
| Mode M9 | |||
|---|---|---|---|
| Quadrant | BADHDUFLAG | Total packets | Discarded packets |
| A | 0 | 20 | 0 |
| B | 0 | 20 | 0 |
| C | 0 | 20 | 0 |
| D | 0 | 20 | 0 |
| Mode SS | |||
|---|---|---|---|
| Quadrant | BADHDUFLAG | Total packets | Discarded packets |
| A | 0 | 138 | 2 |
| B | 0 | 138 | 0 |
| C | 0 | 138 | 2 |
| D | 0 | 138 | 0 |
| Quadrant | Total seconds | Saturated seconds | Saturation percentage |
|---|---|---|---|
| A | 6712 | 41 | 0.610846% |
| B | 6708 | 83 | 1.237329% |
| C | 6709 | 14 | 0.208675% |
| D | 6714 | 26 | 0.387251% |
Noise dominated data is calculated using 1-second bins in cleaned event files. If a bin has >2000 counts, and if more than 50% of those come from <1% of pixels, then it is considered to be noise-dominated and hence unusable.
| Quadrant | # 1 sec bins | Bins with >0 counts | Bins with >2000 counts | High rate bins dominated by noise | Noise dominated (total time) | Noise dominated (detector-on time) | Marked lightcurve |
|---|---|---|---|---|---|---|---|
| A | 8682 | 6742 | 6 | 6 | 0.07% | 0.09% | 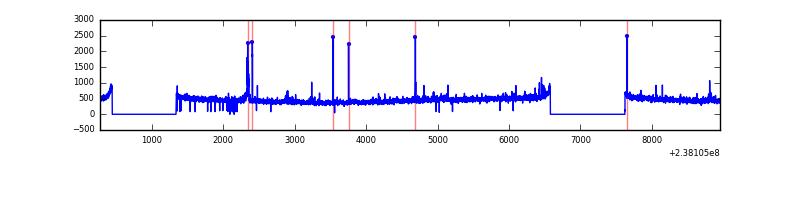 |
| B | 8682 | 6738 | 17 | 17 | 0.20% | 0.25% | 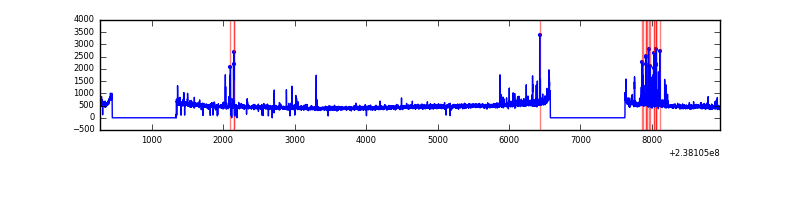 |
| C | 8682 | 6744 | 1 | 1 | 0.01% | 0.01% | 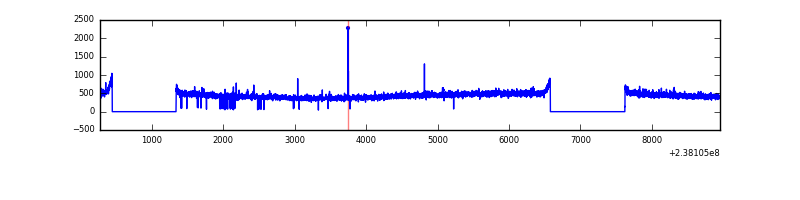 |
| D | 8682 | 6742 | 10 | 10 | 0.12% | 0.15% | 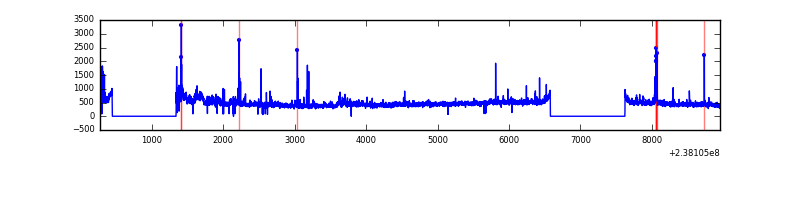 |
Top three noisy pixels from each quadrant. If the there are fewer than three noisy pixels in the level2.evt file, extra rows are filled as -1
| Pixel properties | Quadrant properties | ||||||
|---|---|---|---|---|---|---|---|
| Quadrant | DetID | PixID | Counts | Sigma | Mean | Median | Sigma |
| A | 15 | 174 | 40650 | 250.37 | 781 | 764 | 159.3 |
| A | 13 | 248 | 39579 | 243.64 | 781 | 764 | 159.3 |
| A | 8 | 15 | 16990 | 101.85 | 781 | 764 | 159.3 |
| B | 4 | 239 | 131004 | 859.71 | 787 | 768 | 151.5 |
| B | 0 | 214 | 64670 | 421.83 | 787 | 768 | 151.5 |
| B | 10 | 245 | 56817 | 369.99 | 787 | 768 | 151.5 |
| C | 13 | 61 | 5736 | 28.28 | 758 | 761 | 175.9 |
| C | 14 | 234 | 4699 | 22.39 | 758 | 761 | 175.9 |
| C | 10 | 22 | 3522 | 15.7 | 758 | 761 | 175.9 |
| D | 7 | 46 | 154881 | 822.94 | 750 | 729 | 187.3 |
| D | 1 | 52 | 133303 | 707.74 | 750 | 729 | 187.3 |
| D | 2 | 152 | 37409 | 195.81 | 750 | 729 | 187.3 |
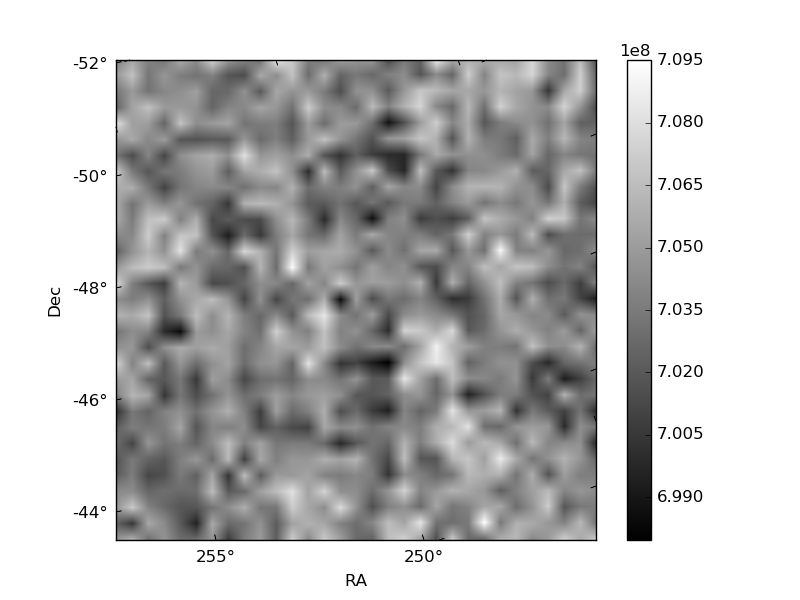
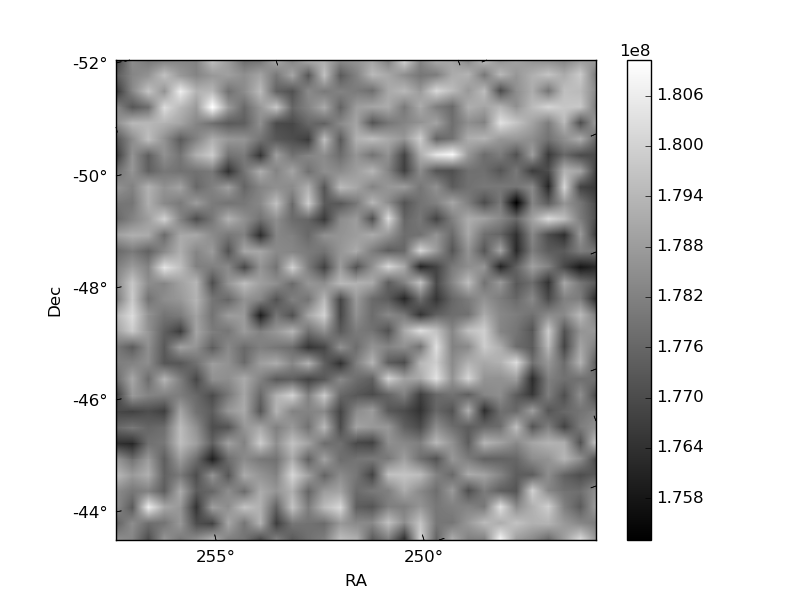
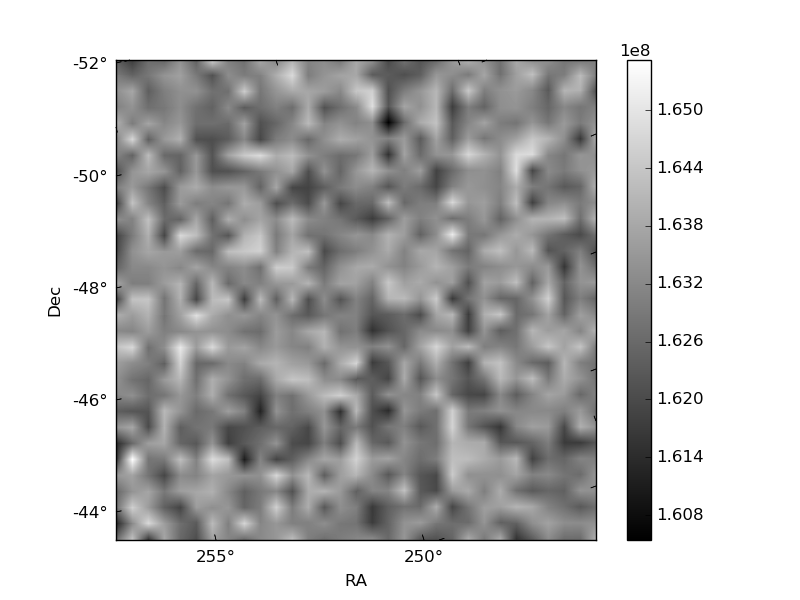
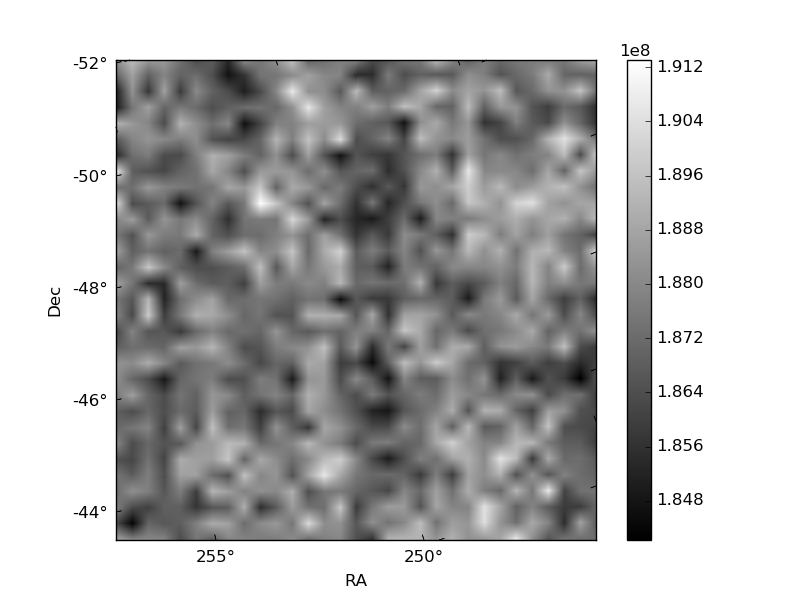
Histogram calculated using DETX and DETY for each event in the final _common_clean file
| Quadrant A |  |
 |
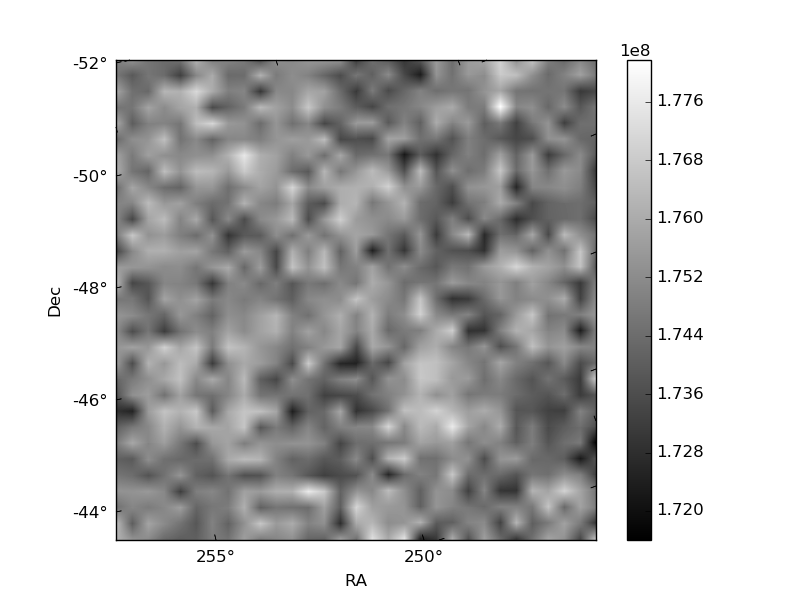
Quadrant B |
|---|---|---|---|
| Quadrant D |  |
 |
Quadrant C |
| Plot type | Count rate plots | Images |
|---|---|---|
| Comparison with Poisson distribution Blue bars denote a histogram of data divided into 1 sec bins. Red curve is a Poisson curve with rate = median count rate of data. |
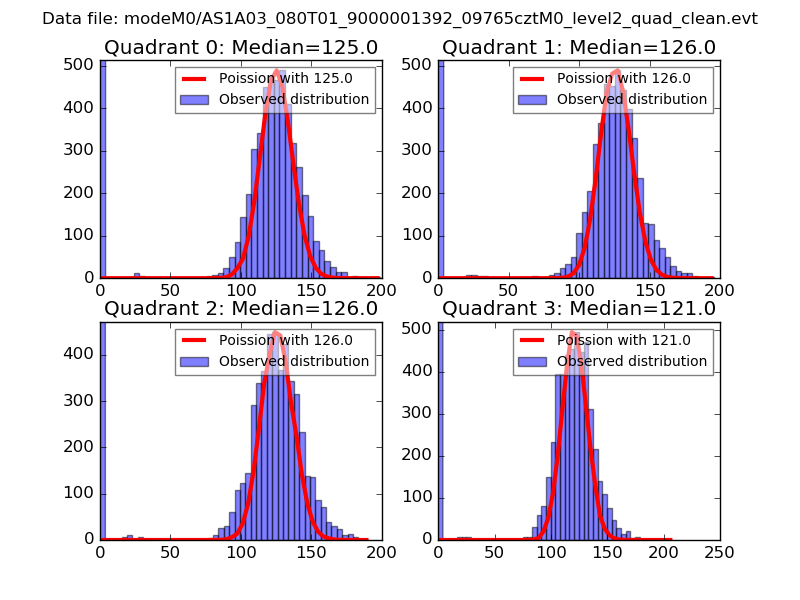 |
 |
| Quadrant-wise count rates Data is divided into 100 sec bins |
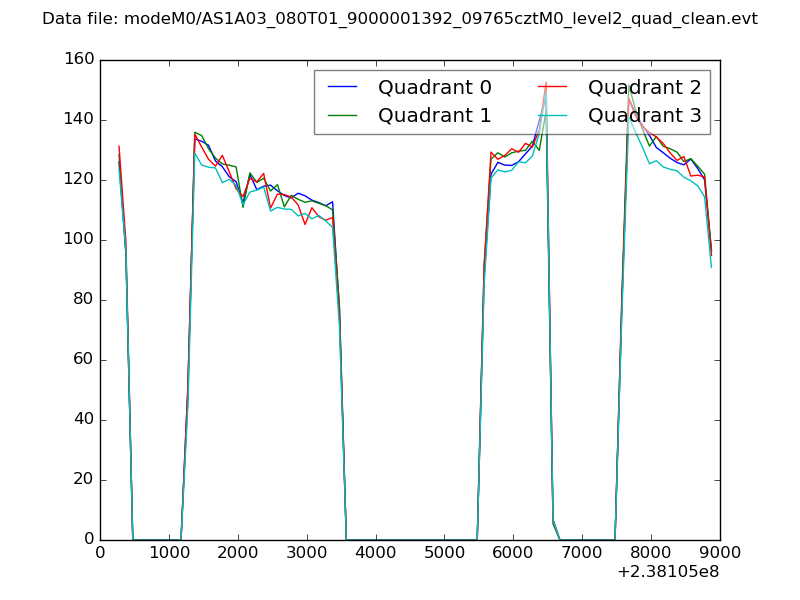 |
|
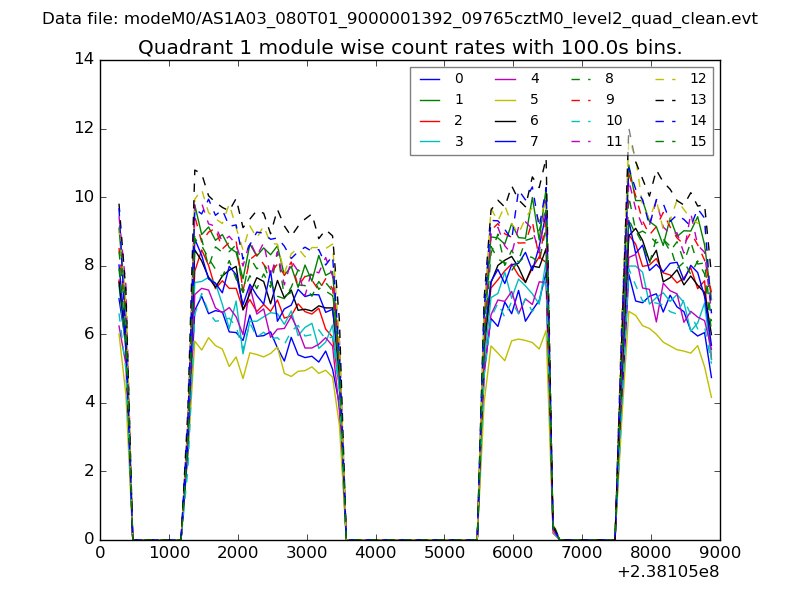
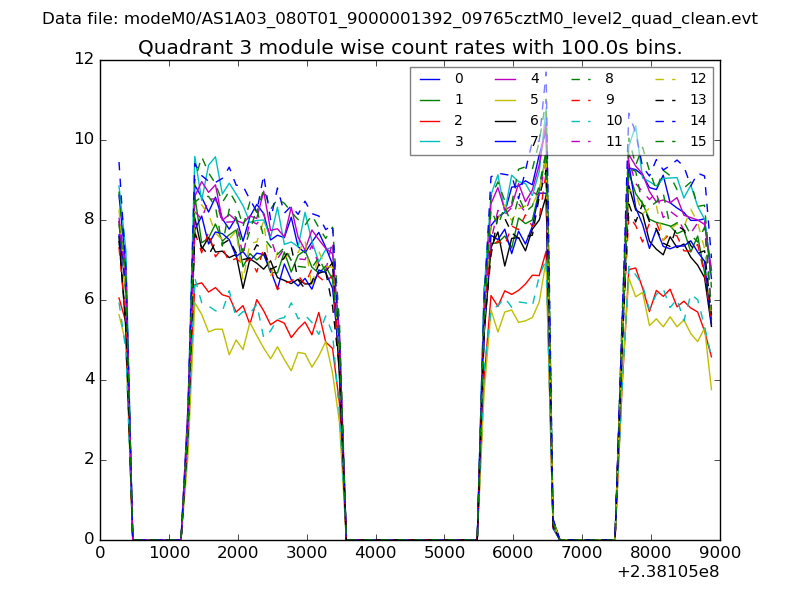
| Module-wise count rates for Quadrant A Data is divided into 100 sec bins |
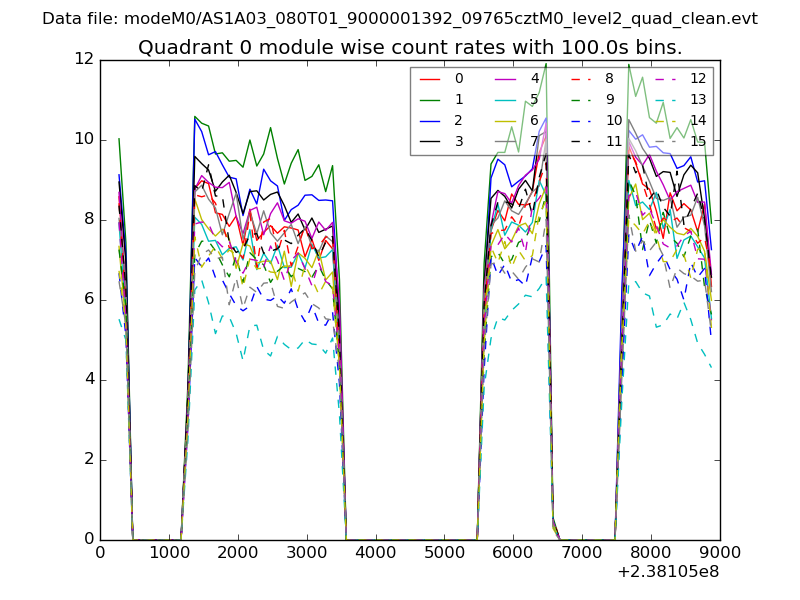 |
 |
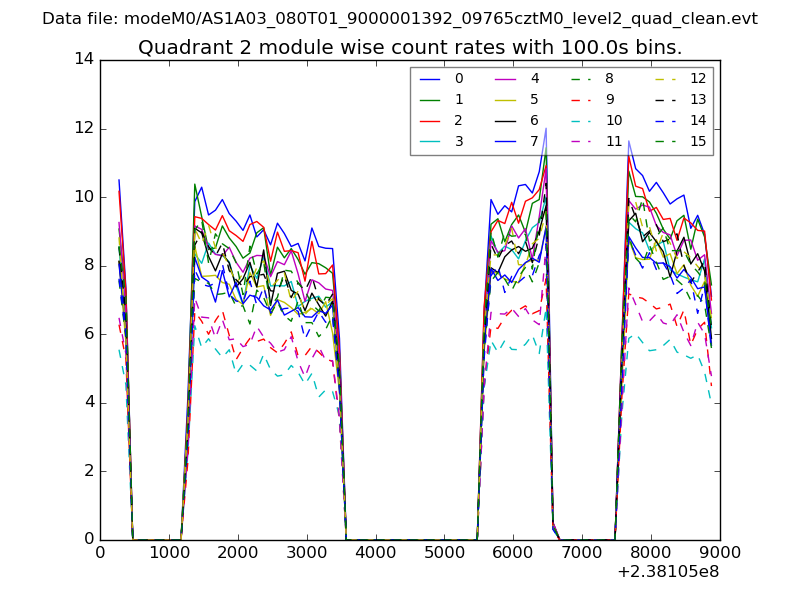
| Module-wise count rates for Quadrant B Data is divided into 100 sec bins |
 |
 |
| Module-wise count rates for Quadrant C Data is divided into 100 sec bins |
 |
 |
| Module-wise count rates for Quadrant D Data is divided into 100 sec bins |
 |
 |
| Parameter | Plot |
|---|---|
| CZT HV Monitor | 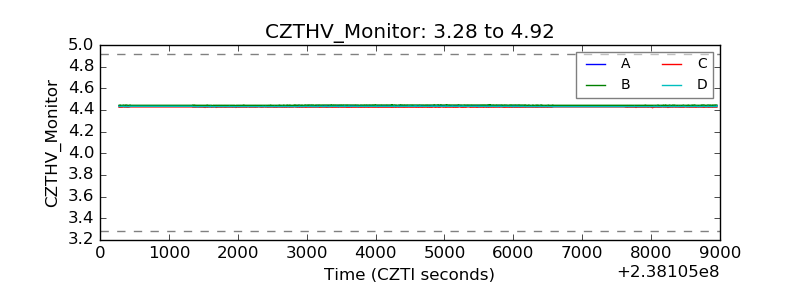 |
| D_VDD | 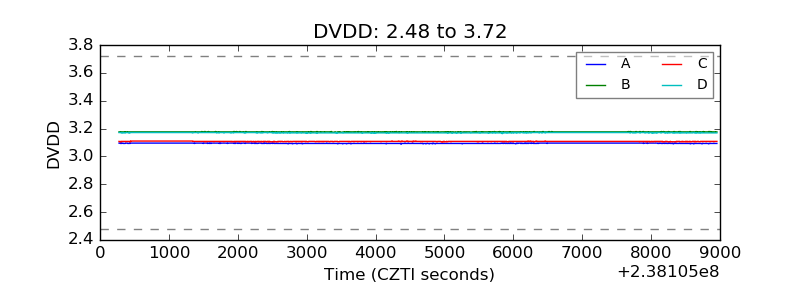 |
| Temperature 1 | 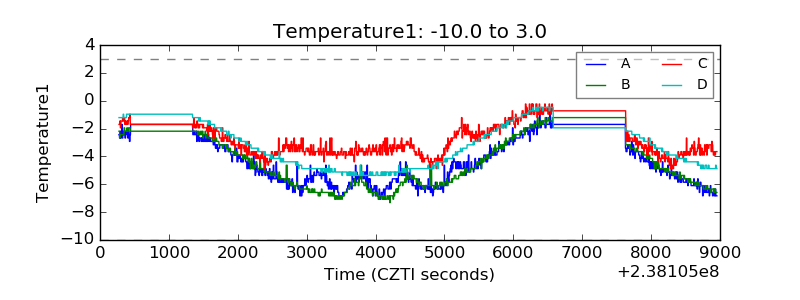 |
| Veto HV Monitor | 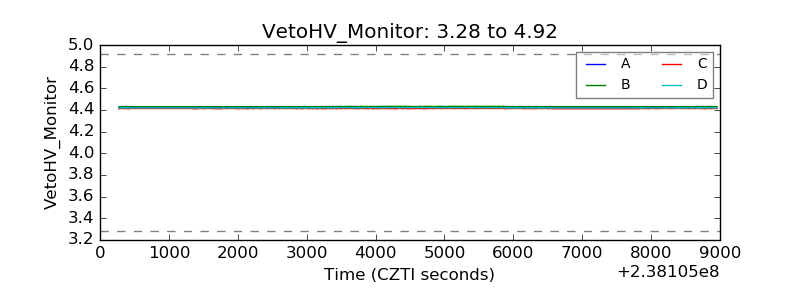 |
| Veto LLD | 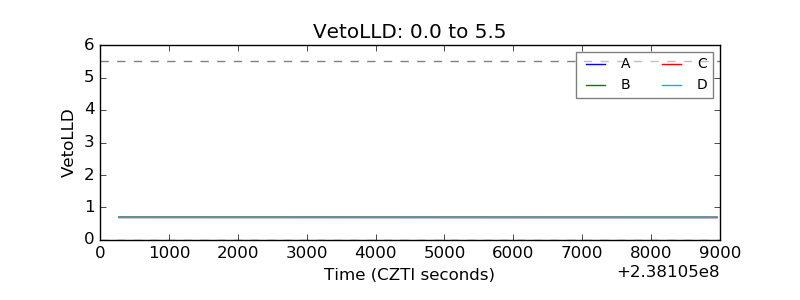 |
| Alpha Counter | 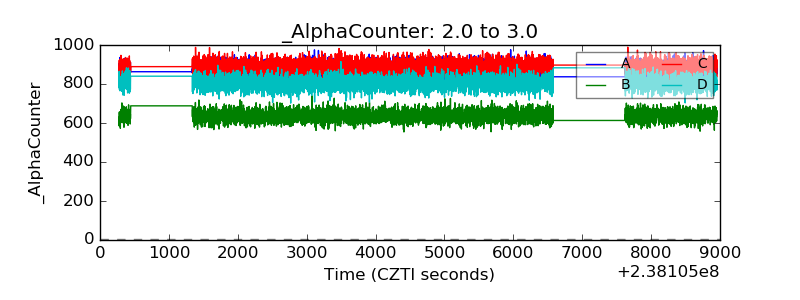 |
| _CPM_Rate | 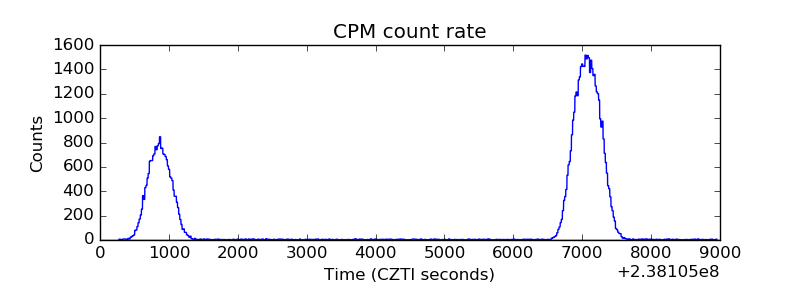 |
| CZT Counter |  |
| +2.5 Volts monitor |  |
| +5 Volts monitor |  |
| _ROLL_ROT | 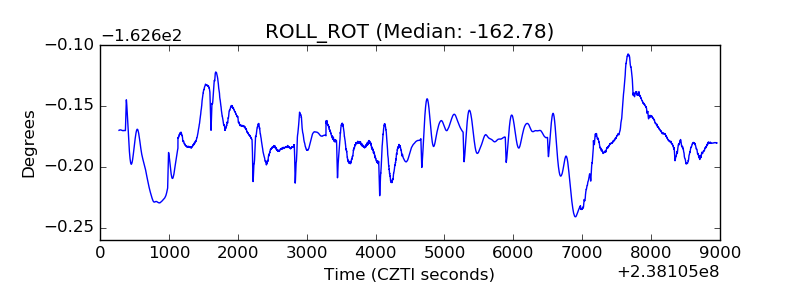 |
| _Roll_DEC | 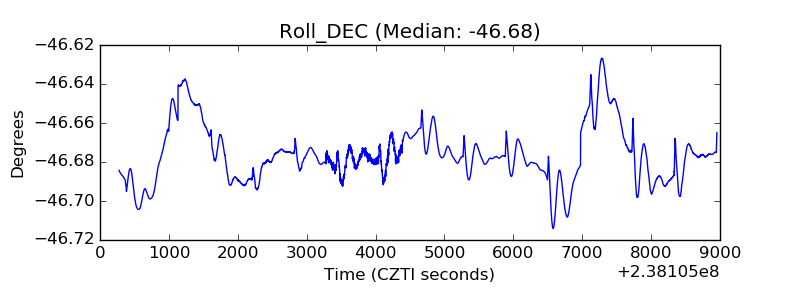 |
| _Roll_RA | 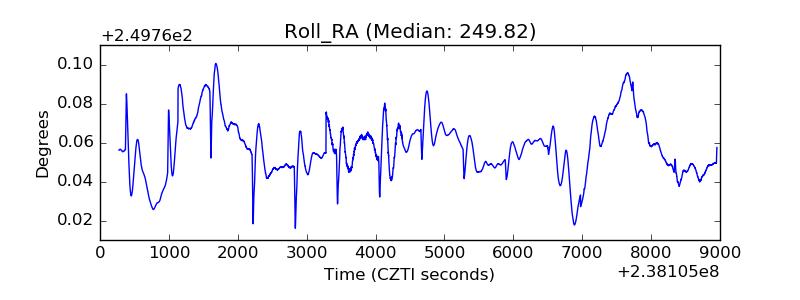 |
| Veto Counter | 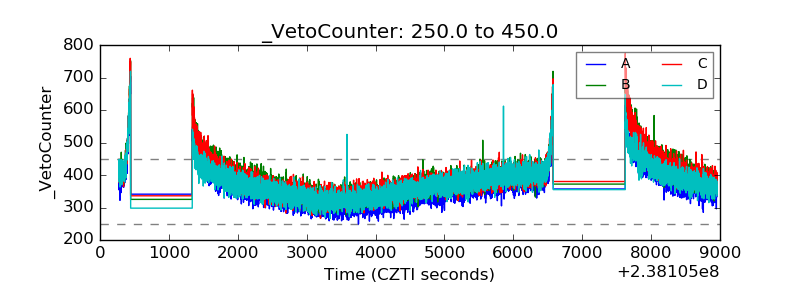 |