| Param | Original file | Final file |
|---|---|---|
| Filename | modeM0/AS1A03_080T01_9000001392_09768cztM0_level2.evt | modeM0/AS1A03_080T01_9000001392_09768cztM0_level2_quad_clean.evt |
| Size (bytes) | 2,550,096,000 | 471,507,840 |
| Size | 2.4 GB | 449.7 MB |
| Events in quadrant A | 17,618,984 | 2,934,442 |
| Events in quadrant B | 18,670,629 | 2,961,980 |
| Events in quadrant C | 16,991,086 | 2,948,118 |
| Events in quadrant D | 21,350,469 | 2,795,096 |
| Mode M0 | |||
|---|---|---|---|
| Quadrant | BADHDUFLAG | Total packets | Discarded packets |
| A | 0 | 79314 | 290 |
| B | 0 | 81815 | 293 |
| C | 0 | 78278 | 236 |
| D | 0 | 90898 | 388 |
| Mode M9 | |||
|---|---|---|---|
| Quadrant | BADHDUFLAG | Total packets | Discarded packets |
| A | 0 | 62 | 0 |
| B | 0 | 62 | 1 |
| C | 0 | 62 | 2 |
| D | 0 | 62 | 0 |
| Mode SS | |||
|---|---|---|---|
| Quadrant | BADHDUFLAG | Total packets | Discarded packets |
| A | 0 | 782 | 0 |
| B | 0 | 782 | 4 |
| C | 0 | 782 | 6 |
| D | 0 | 782 | 2 |
| Quadrant | Total seconds | Saturated seconds | Saturation percentage |
|---|---|---|---|
| A | 38473 | 264 | 0.686196% |
| B | 38482 | 329 | 0.854945% |
| C | 38497 | 108 | 0.280541% |
| D | 38462 | 759 | 1.973376% |
Noise dominated data is calculated using 1-second bins in cleaned event files. If a bin has >2000 counts, and if more than 50% of those come from <1% of pixels, then it is considered to be noise-dominated and hence unusable.
| Quadrant | # 1 sec bins | Bins with >0 counts | Bins with >2000 counts | High rate bins dominated by noise | Noise dominated (total time) | Noise dominated (detector-on time) | Marked lightcurve |
|---|---|---|---|---|---|---|---|
| A | 44585 | 38609 | 37 | 37 | 0.08% | 0.10% | 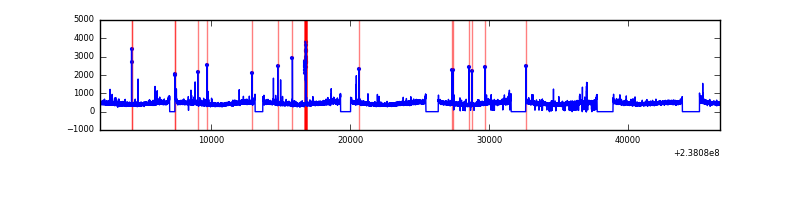 |
| B | 44585 | 38602 | 43 | 43 | 0.10% | 0.11% |  |
| C | 44585 | 38608 | 1 | 1 | 0.00% | 0.00% |  |
| D | 44585 | 38606 | 470 | 470 | 1.05% | 1.22% | 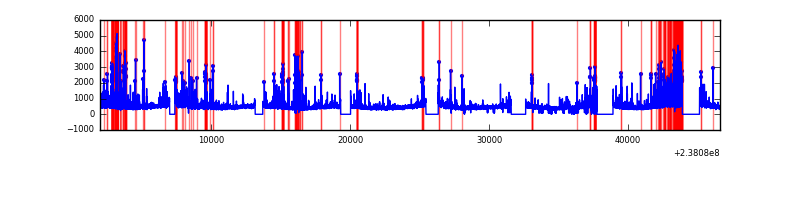 |
Top three noisy pixels from each quadrant. If the there are fewer than three noisy pixels in the level2.evt file, extra rows are filled as -1
| Pixel properties | Quadrant properties | ||||||
|---|---|---|---|---|---|---|---|
| Quadrant | DetID | PixID | Counts | Sigma | Mean | Median | Sigma |
| A | 8 | 15 | 123194 | 132.82 | 4456 | 4366 | 894.6 |
| A | 15 | 239 | 118292 | 127.34 | 4456 | 4366 | 894.6 |
| A | 15 | 174 | 102397 | 109.58 | 4456 | 4366 | 894.6 |
| B | 0 | 214 | 355242 | 414.65 | 4491 | 4381 | 846.2 |
| B | 10 | 245 | 299393 | 348.64 | 4491 | 4381 | 846.2 |
| B | 4 | 239 | 236726 | 274.58 | 4491 | 4381 | 846.2 |
| C | 13 | 61 | 32625 | 28.25 | 4346 | 4365 | 1000.4 |
| C | 8 | 222 | 20283 | 15.91 | 4346 | 4365 | 1000.4 |
| C | 14 | 128 | 13578 | 9.21 | 4346 | 4365 | 1000.4 |
| D | 1 | 52 | 3672154 | 3513.05 | 4269 | 4171 | 1044.1 |
| D | 8 | 195 | 338098 | 319.82 | 4269 | 4171 | 1044.1 |
| D | 7 | 71 | 318148 | 300.72 | 4269 | 4171 | 1044.1 |
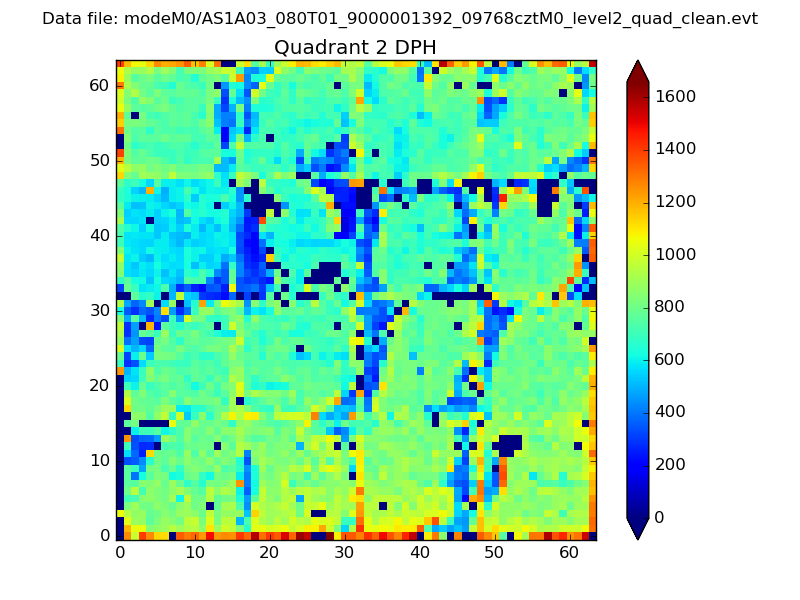
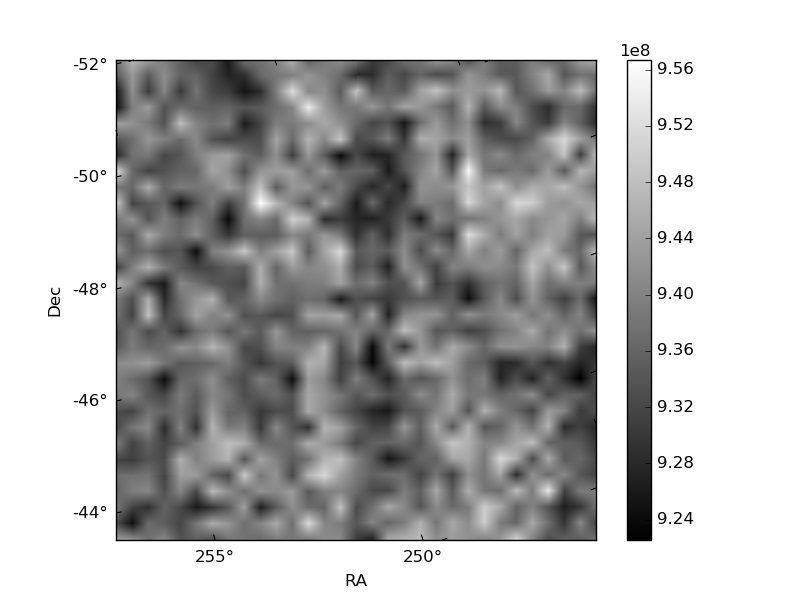
Histogram calculated using DETX and DETY for each event in the final _common_clean file
| Quadrant A | 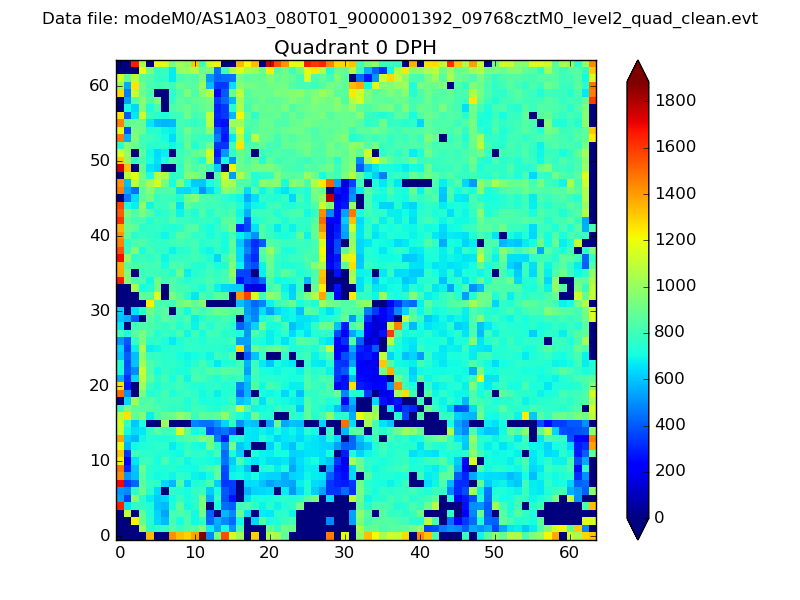 |
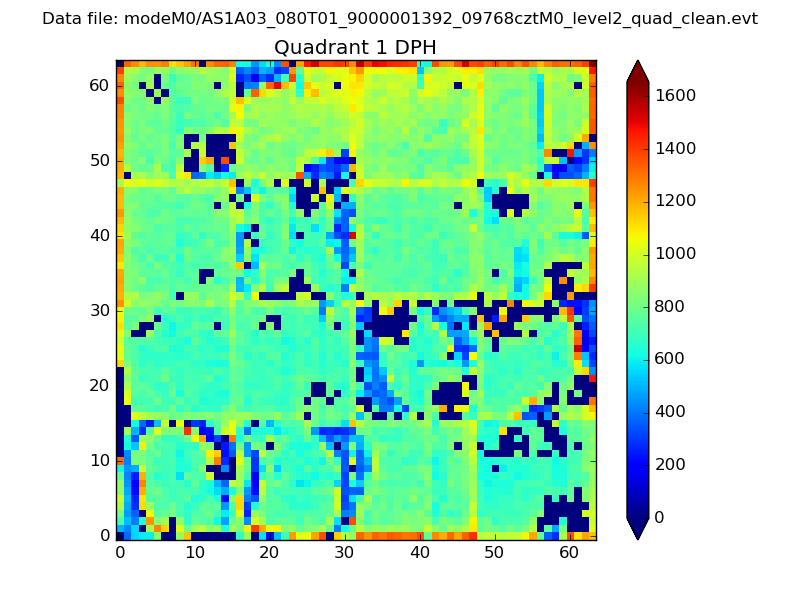 |
Quadrant B |
|---|---|---|---|
| Quadrant D | 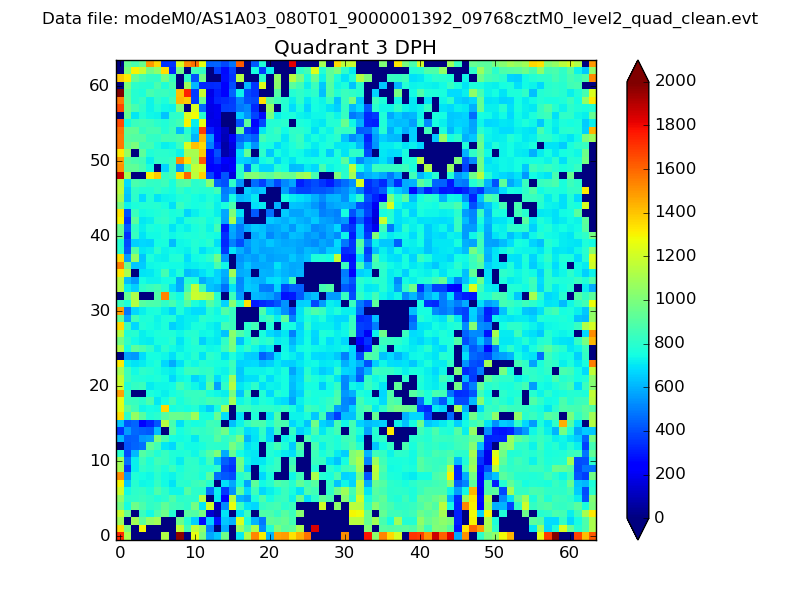 |
 |
Quadrant C |
| Plot type | Count rate plots | Images |
|---|---|---|
| Comparison with Poisson distribution Blue bars denote a histogram of data divided into 1 sec bins. Red curve is a Poisson curve with rate = median count rate of data. |
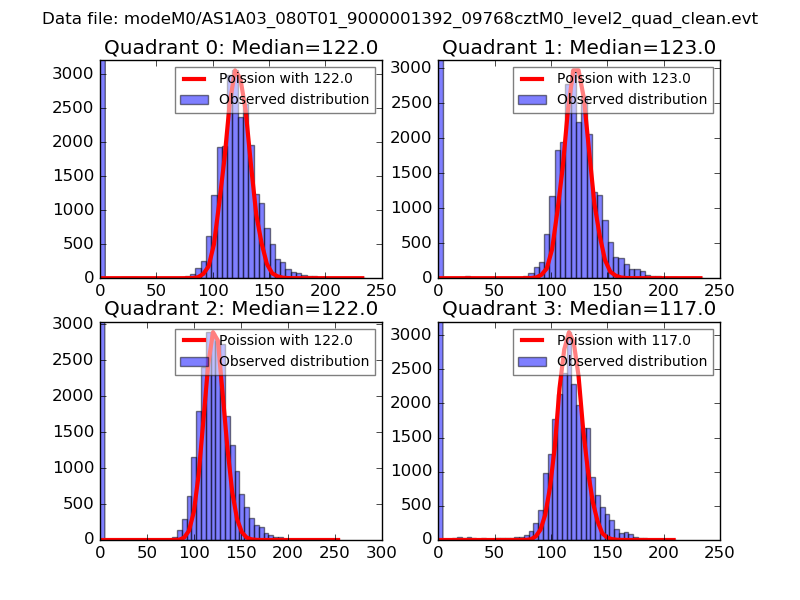 |
 |
| Quadrant-wise count rates Data is divided into 100 sec bins |
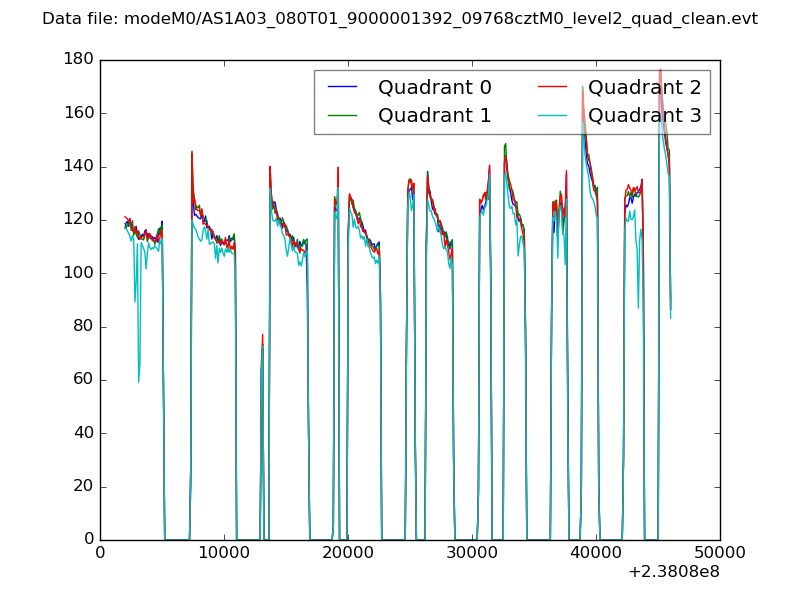 |
|
| Module-wise count rates for Quadrant A Data is divided into 100 sec bins |
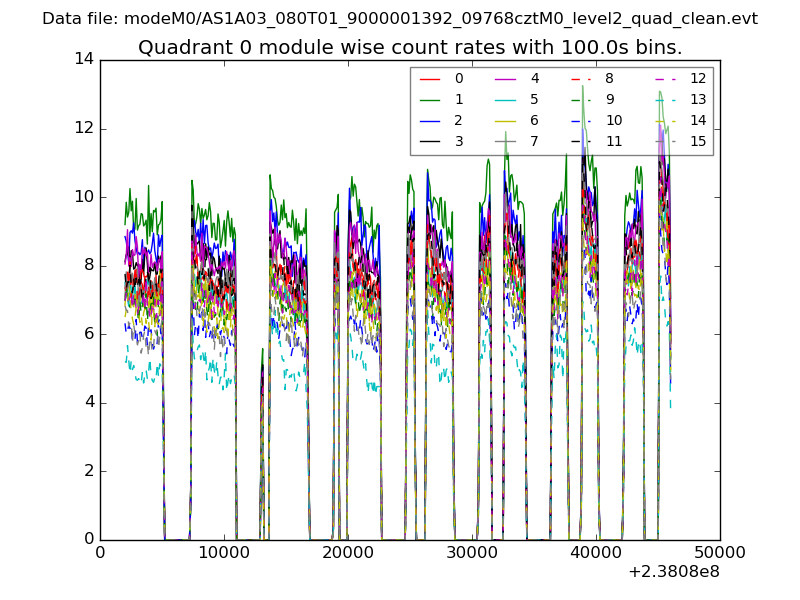 |
 |
| Module-wise count rates for Quadrant B Data is divided into 100 sec bins |
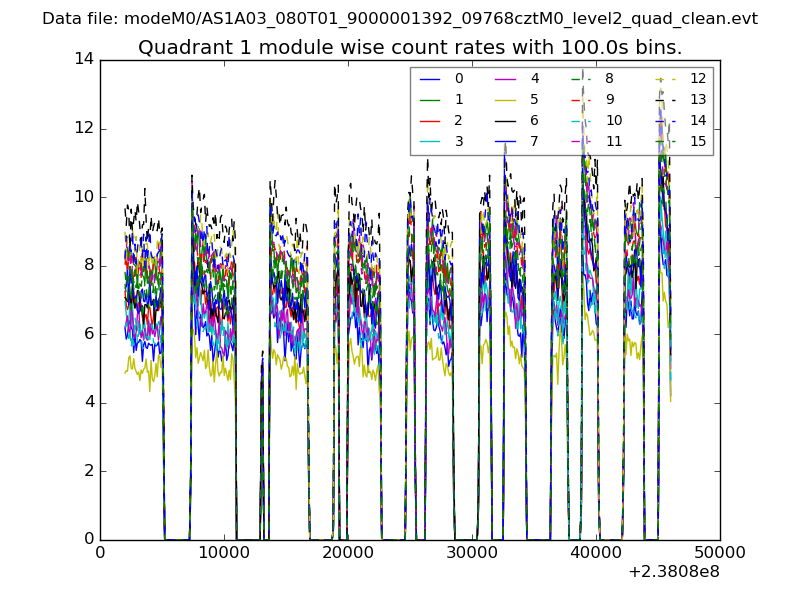 |
 |
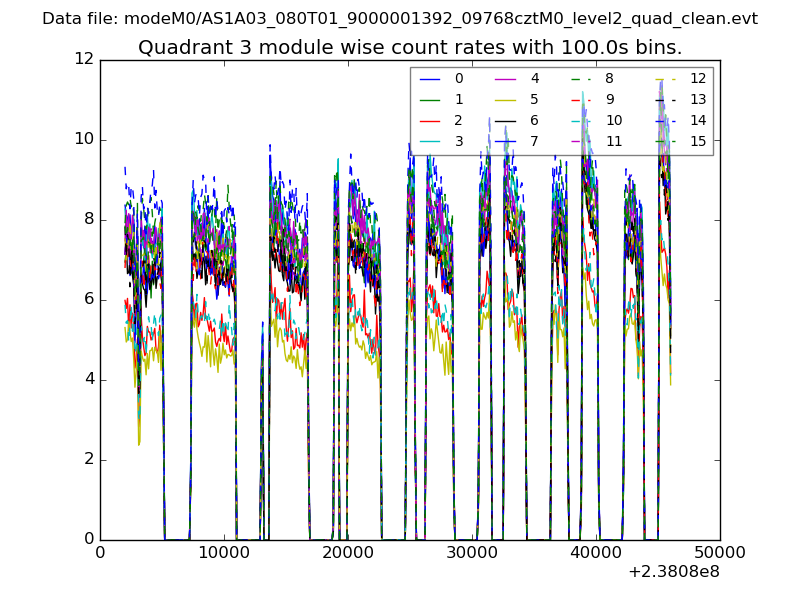
| Module-wise count rates for Quadrant C Data is divided into 100 sec bins |
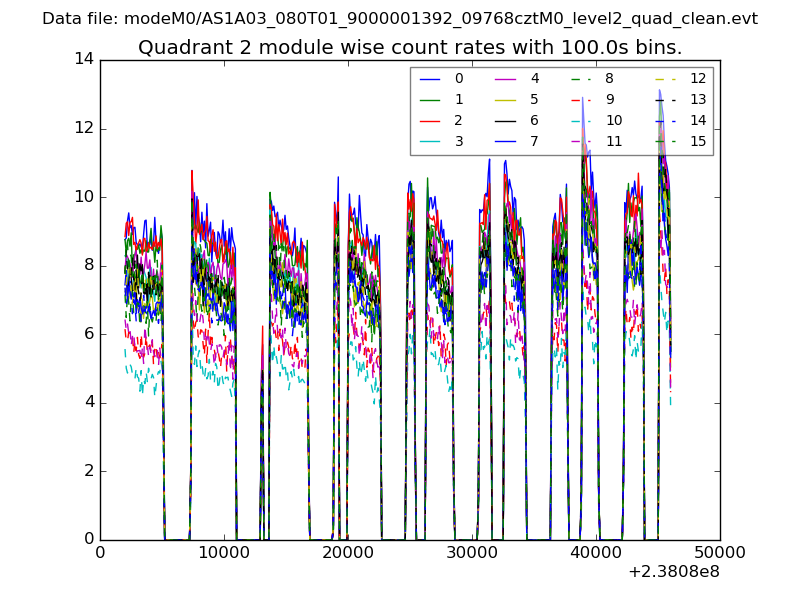 |
 |
| Module-wise count rates for Quadrant D Data is divided into 100 sec bins |
 |
 |
| Parameter | Plot |
|---|---|
| CZT HV Monitor | 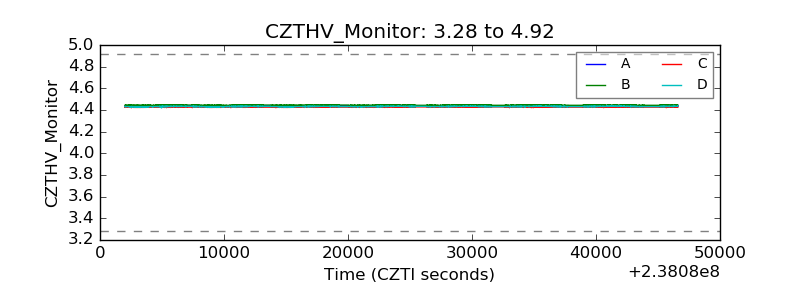 |
| D_VDD | 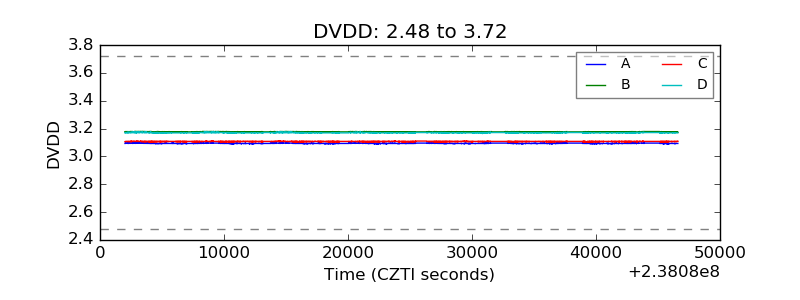 |
| Temperature 1 | 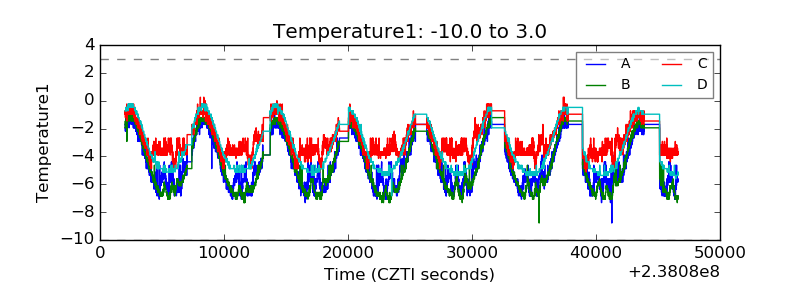 |
| Veto HV Monitor | 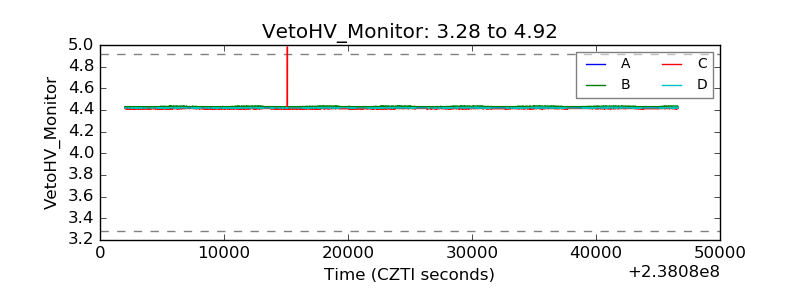 |
| Veto LLD | 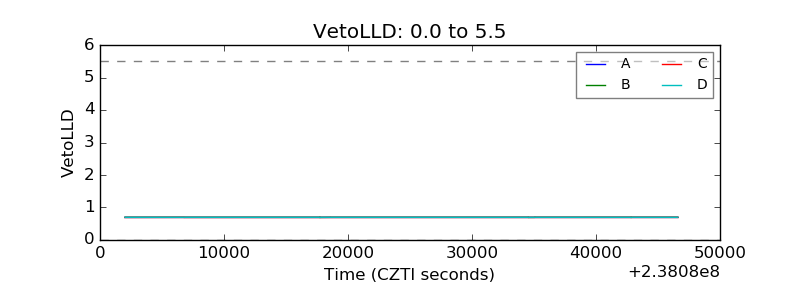 |
| Alpha Counter | 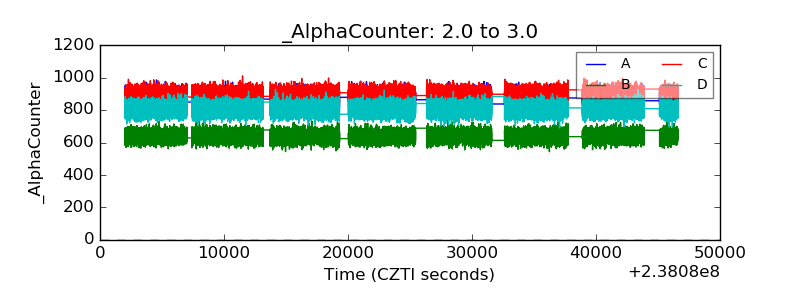 |
| _CPM_Rate | 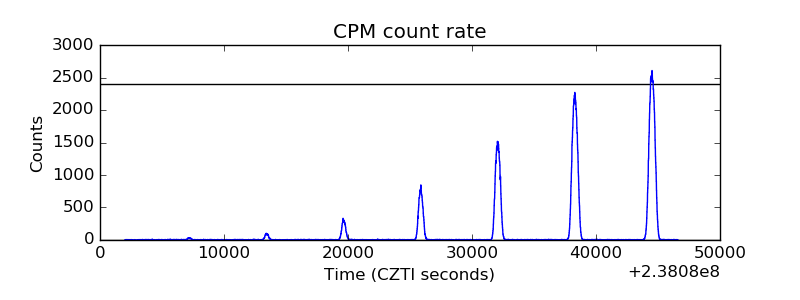 |
| CZT Counter | 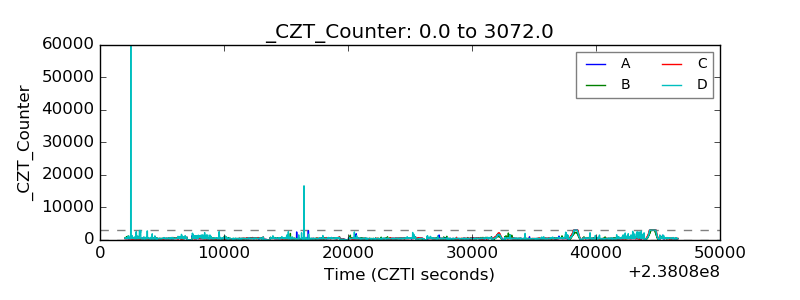 |
| +2.5 Volts monitor |  |
| +5 Volts monitor | 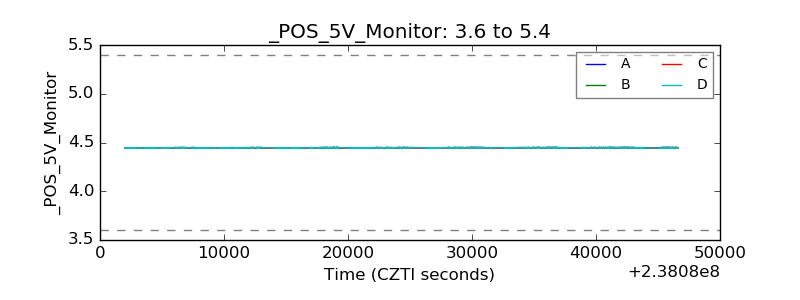 |
| _ROLL_ROT | 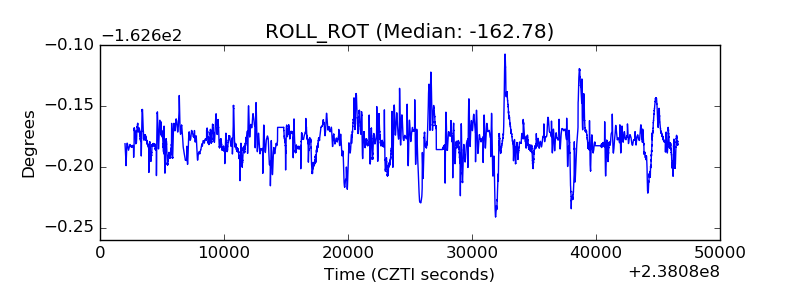 |
| _Roll_DEC | 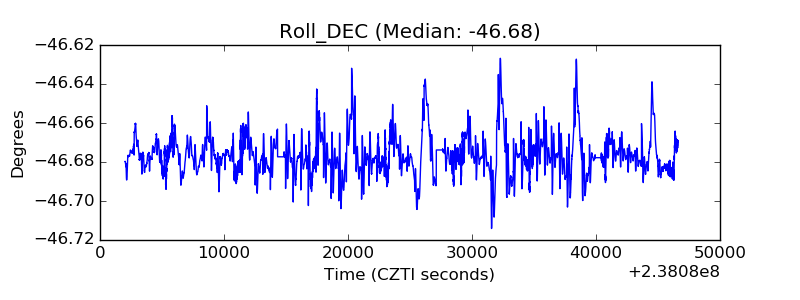 |
| _Roll_RA | 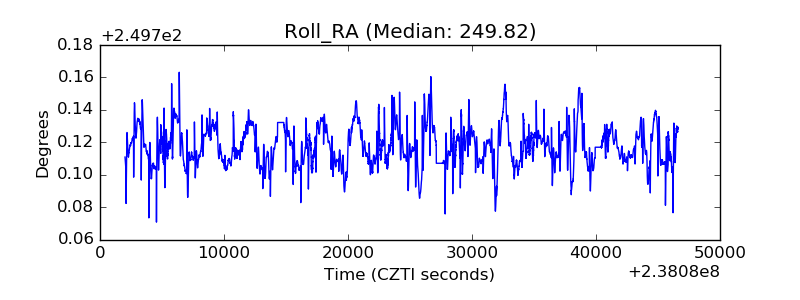 |
| Veto Counter | 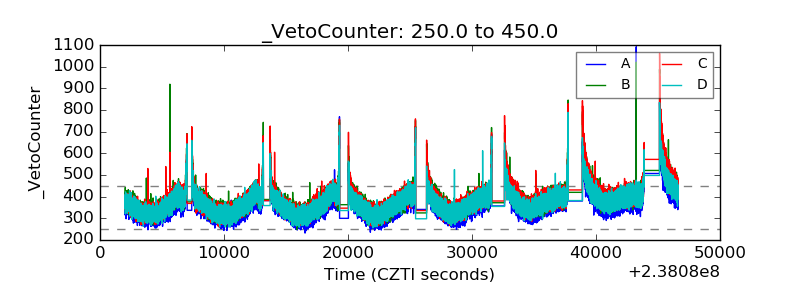 |