| Param | Original file | Final file |
|---|---|---|
| Filename | modeM0/AS1A03_080T01_9000001392_09770cztM0_level2.evt | modeM0/AS1A03_080T01_9000001392_09770cztM0_level2_quad_clean.evt |
| Size (bytes) | 441,823,680 | 69,485,760 |
| Size | 421.4 MB | 66.3 MB |
| Events in quadrant A | 3,037,948 | 415,705 |
| Events in quadrant B | 3,147,361 | 427,838 |
| Events in quadrant C | 3,014,005 | 427,451 |
| Events in quadrant D | 3,758,353 | 398,352 |
| Mode M0 | |||
|---|---|---|---|
| Quadrant | BADHDUFLAG | Total packets | Discarded packets |
| A | 0 | 12859 | 3 |
| B | 0 | 13111 | 2 |
| C | 0 | 12806 | 2 |
| D | 0 | 15207 | 2 |
| Mode M9 | |||
|---|---|---|---|
| Quadrant | BADHDUFLAG | Total packets | Discarded packets |
| A | 0 | 25 | 0 |
| B | 0 | 25 | 0 |
| C | 0 | 25 | 0 |
| D | 0 | 26 | 0 |
| Mode SS | |||
|---|---|---|---|
| Quadrant | BADHDUFLAG | Total packets | Discarded packets |
| A | 0 | 126 | 0 |
| B | 0 | 126 | 0 |
| C | 0 | 126 | 0 |
| D | 0 | 126 | 0 |
| Quadrant | Total seconds | Saturated seconds | Saturation percentage |
|---|---|---|---|
| A | 6226 | 42 | 0.674590% |
| B | 6226 | 65 | 1.044009% |
| C | 6226 | 34 | 0.546097% |
| D | 6226 | 176 | 2.826855% |
Noise dominated data is calculated using 1-second bins in cleaned event files. If a bin has >2000 counts, and if more than 50% of those come from <1% of pixels, then it is considered to be noise-dominated and hence unusable.
| Quadrant | # 1 sec bins | Bins with >0 counts | Bins with >2000 counts | High rate bins dominated by noise | Noise dominated (total time) | Noise dominated (detector-on time) | Marked lightcurve |
|---|---|---|---|---|---|---|---|
| A | 7536 | 6227 | 0 | 0 | 0.00% | 0.00% | 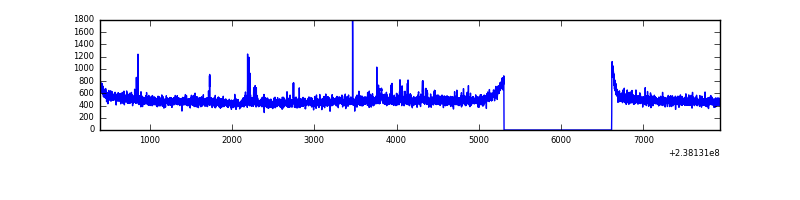 |
| B | 7536 | 6227 | 2 | 2 | 0.03% | 0.03% | 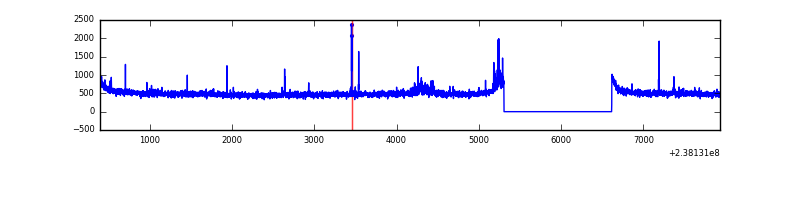 |
| C | 7536 | 6227 | 0 | 0 | 0.00% | 0.00% | 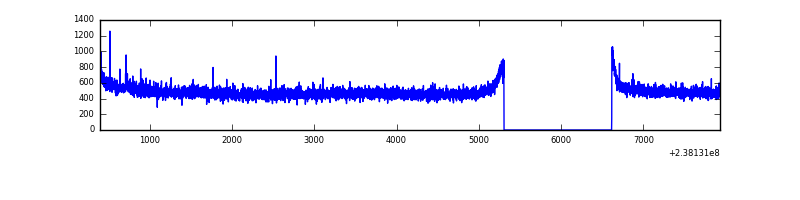 |
| D | 7536 | 6227 | 142 | 142 | 1.88% | 2.28% | 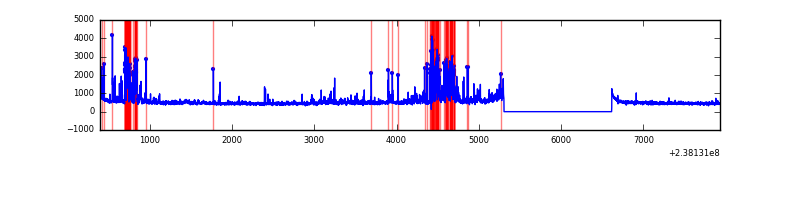 |
Top three noisy pixels from each quadrant. If the there are fewer than three noisy pixels in the level2.evt file, extra rows are filled as -1
| Pixel properties | Quadrant properties | ||||||
|---|---|---|---|---|---|---|---|
| Quadrant | DetID | PixID | Counts | Sigma | Mean | Median | Sigma |
| A | 5 | 112 | 23454 | 146.05 | 775 | 759 | 155.4 |
| A | 8 | 15 | 17501 | 107.74 | 775 | 759 | 155.4 |
| A | 0 | 226 | 7037 | 40.4 | 775 | 759 | 155.4 |
| B | 0 | 214 | 36491 | 242.83 | 786 | 769 | 147.1 |
| B | 4 | 48 | 27710 | 183.14 | 786 | 769 | 147.1 |
| B | 0 | 219 | 16086 | 104.12 | 786 | 769 | 147.1 |
| C | 12 | 4 | 8485 | 43.67 | 770 | 774 | 176.6 |
| C | 13 | 61 | 5771 | 28.3 | 770 | 774 | 176.6 |
| C | 14 | 67 | 2353 | 8.94 | 770 | 774 | 176.6 |
| D | 12 | 233 | 610869 | 3370.47 | 753 | 734 | 181.0 |
| D | 1 | 52 | 158218 | 869.96 | 753 | 734 | 181.0 |
| D | 2 | 152 | 58390 | 318.5 | 753 | 734 | 181.0 |
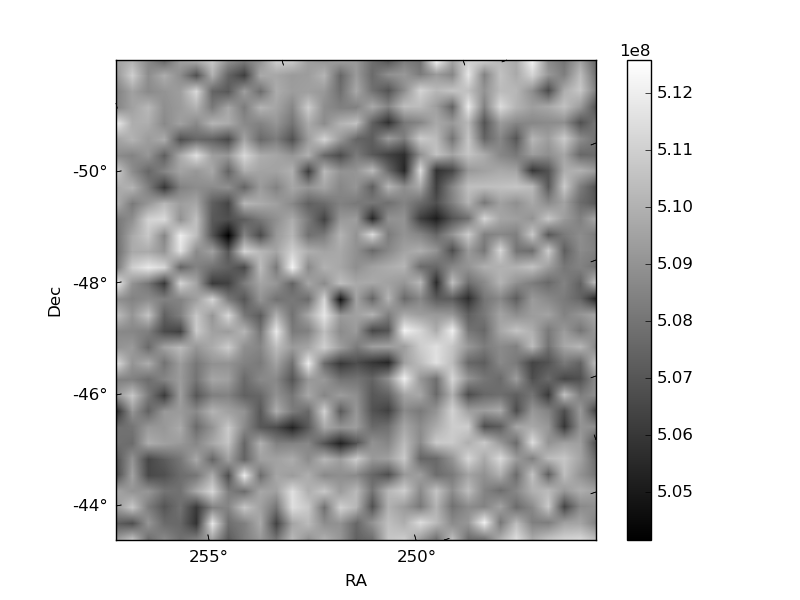
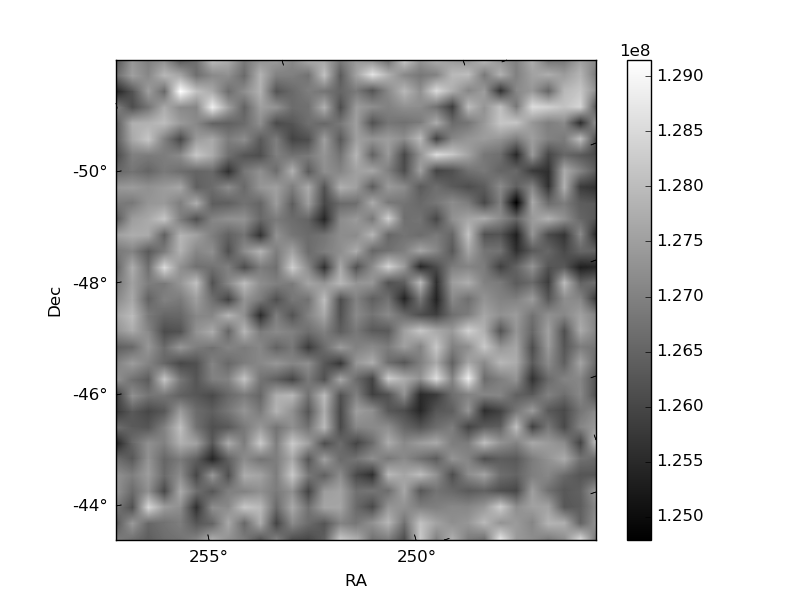
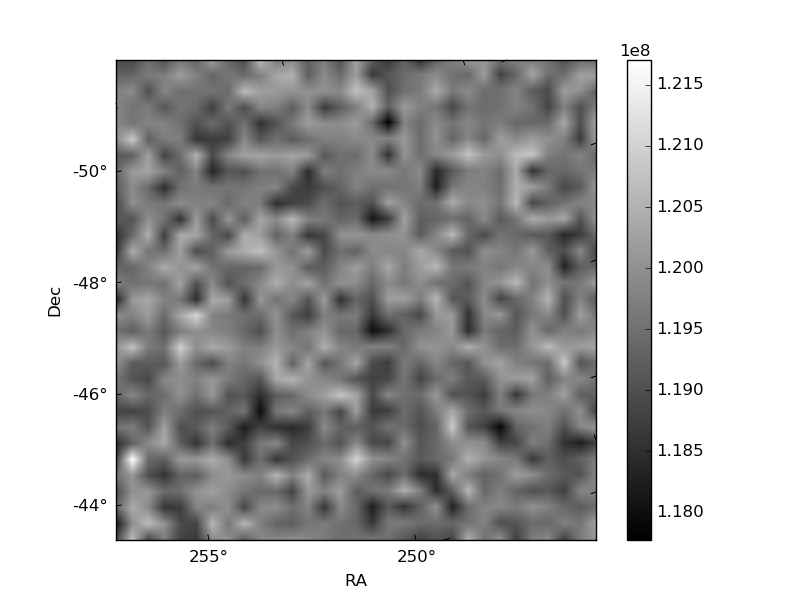
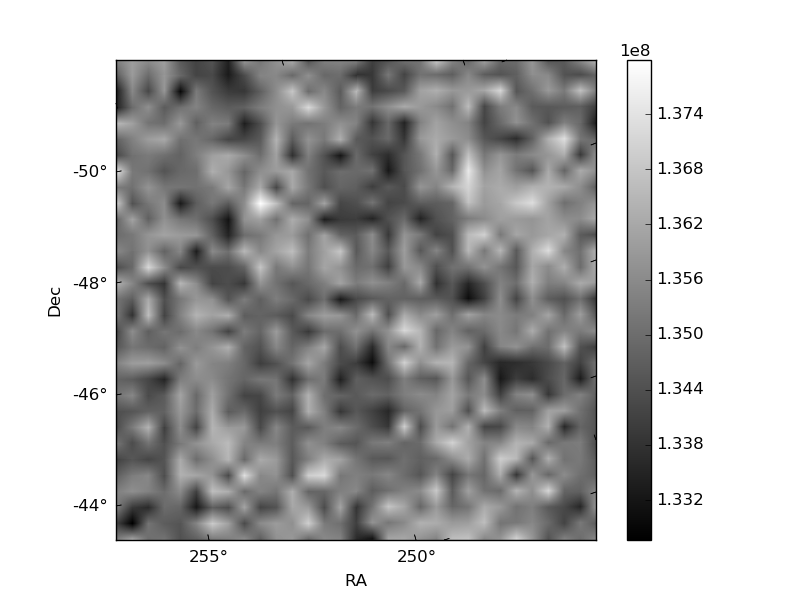
Histogram calculated using DETX and DETY for each event in the final _common_clean file
| Quadrant A | 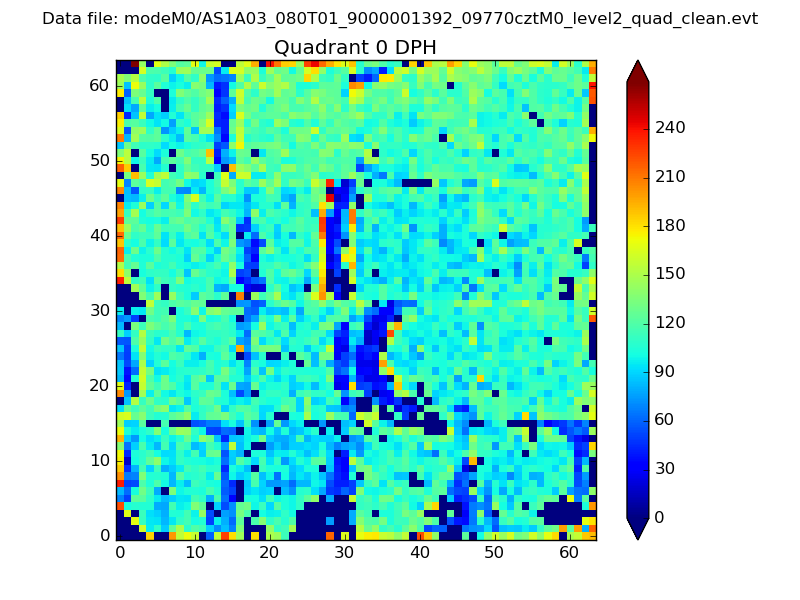 |
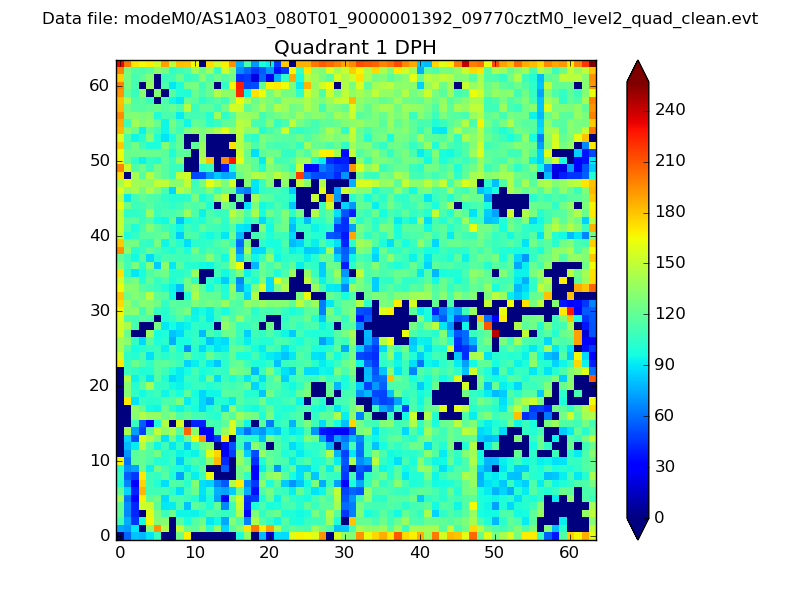 |
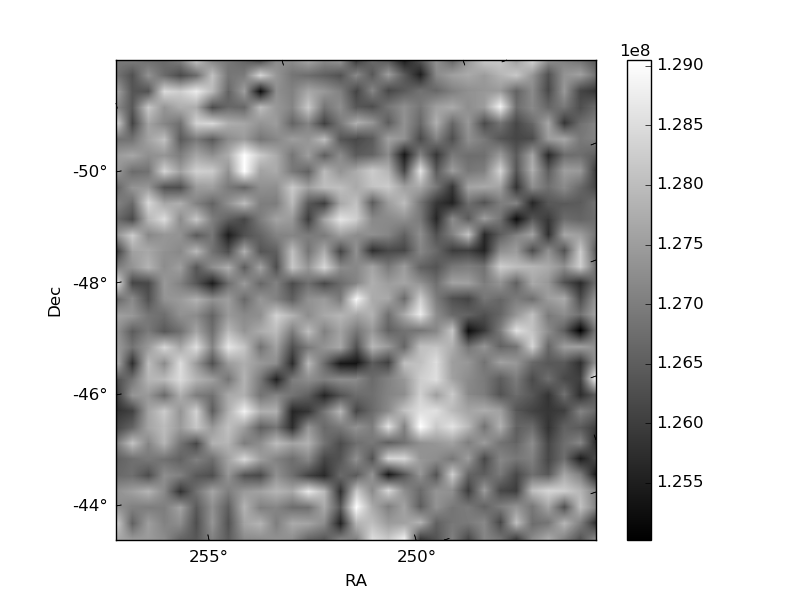
Quadrant B |
|---|---|---|---|
| Quadrant D | 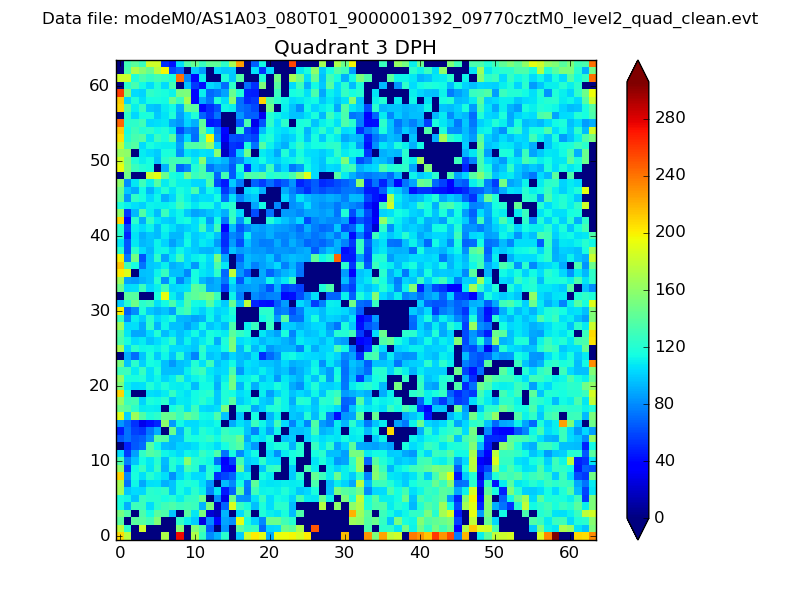 |
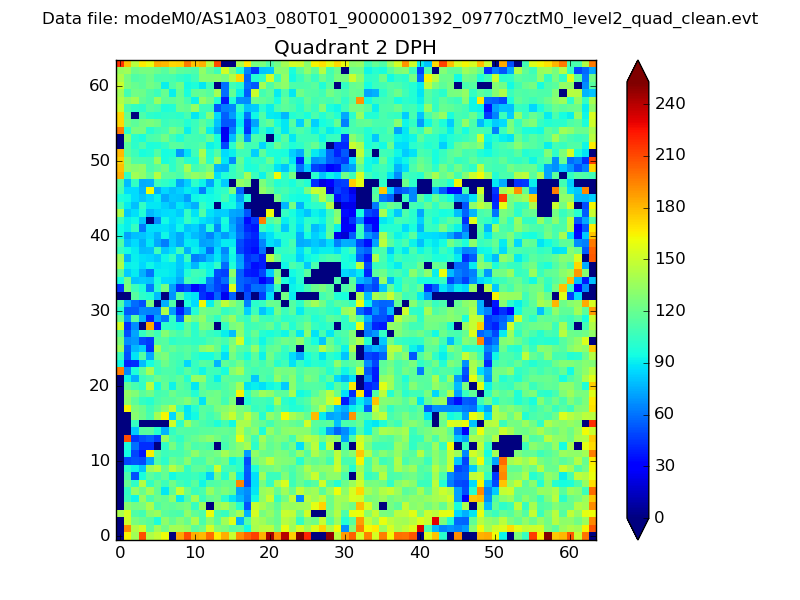 |
Quadrant C |
| Plot type | Count rate plots | Images |
|---|---|---|
| Comparison with Poisson distribution Blue bars denote a histogram of data divided into 1 sec bins. Red curve is a Poisson curve with rate = median count rate of data. |
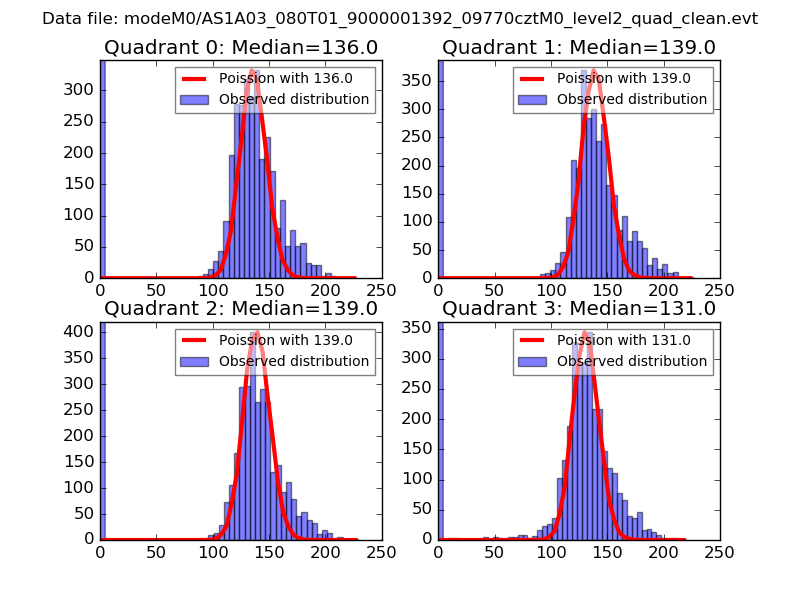 |
 |
| Quadrant-wise count rates Data is divided into 100 sec bins |
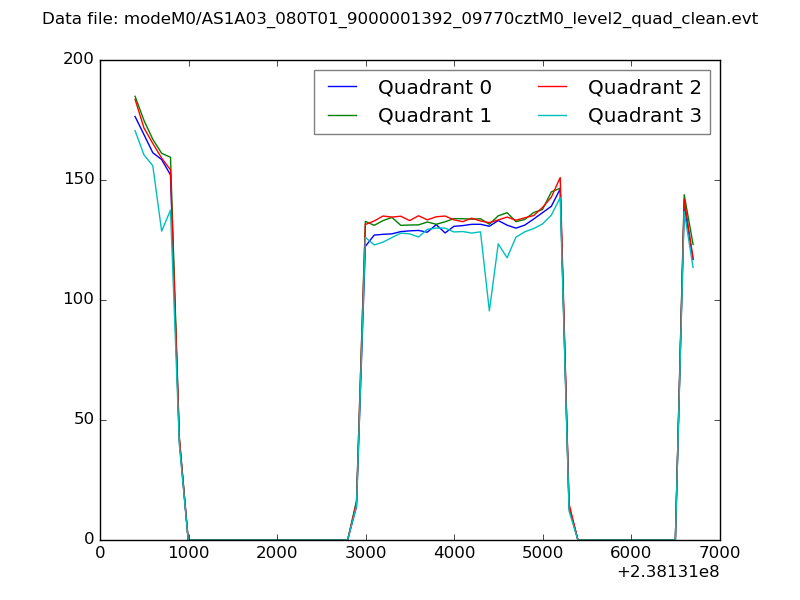 |
|
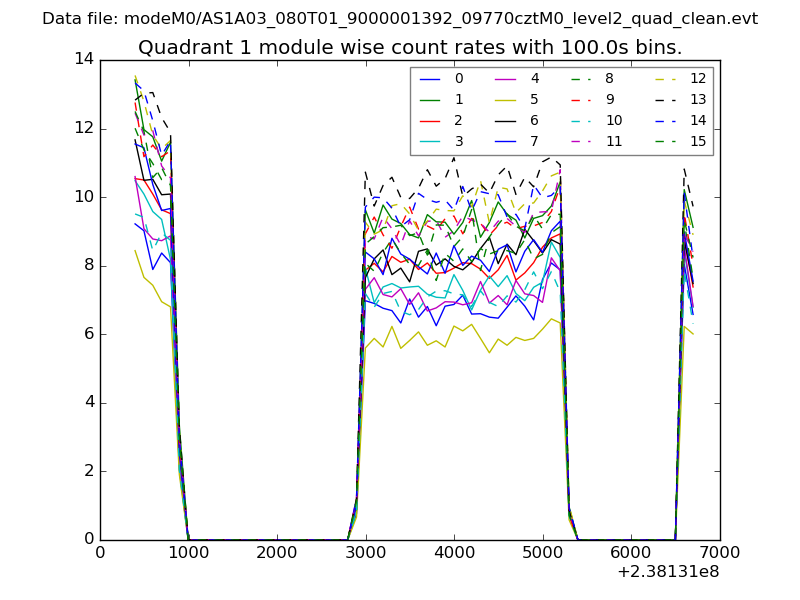
| Module-wise count rates for Quadrant A Data is divided into 100 sec bins |
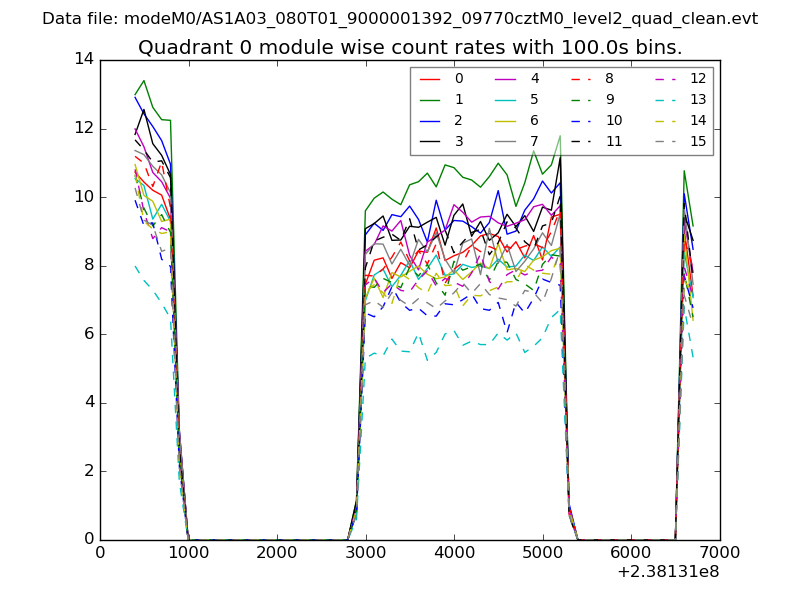 |
 |
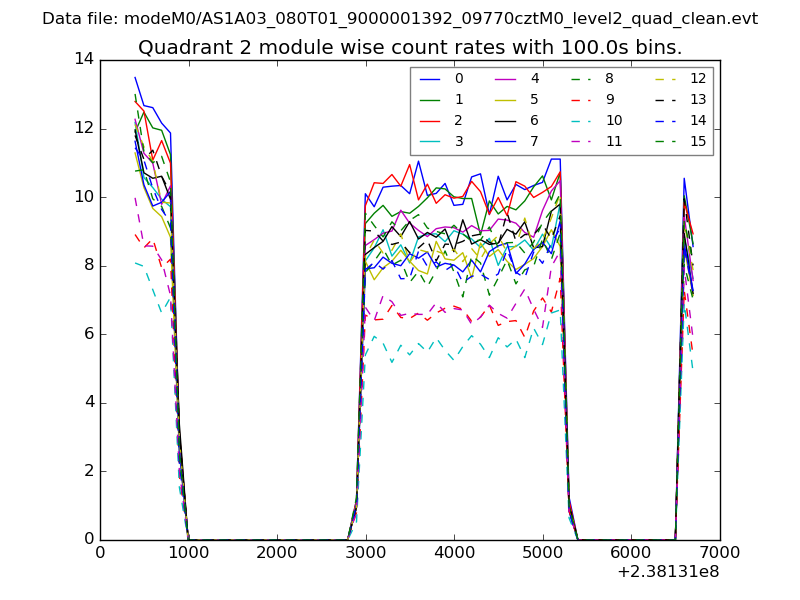
| Module-wise count rates for Quadrant B Data is divided into 100 sec bins |
 |
 |
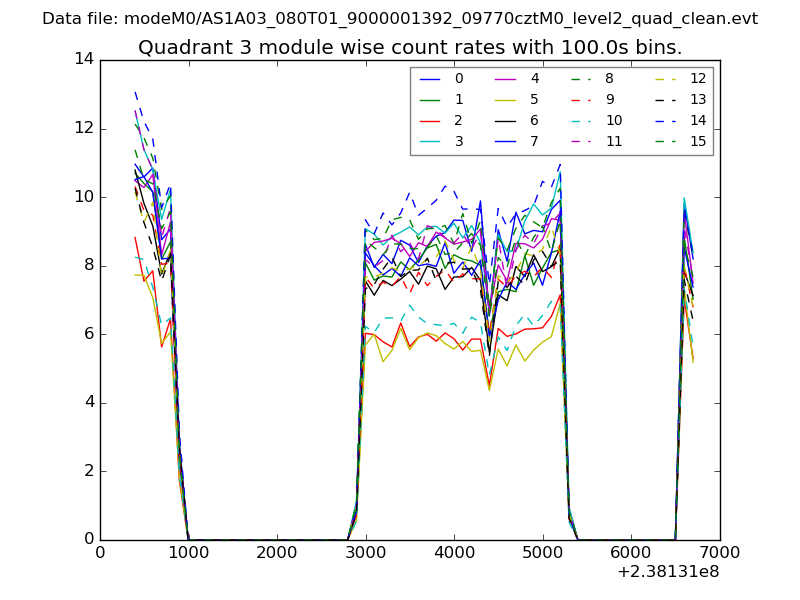
| Module-wise count rates for Quadrant C Data is divided into 100 sec bins |
 |
 |
| Module-wise count rates for Quadrant D Data is divided into 100 sec bins |
 |
 |
| Parameter | Plot |
|---|---|
| CZT HV Monitor | 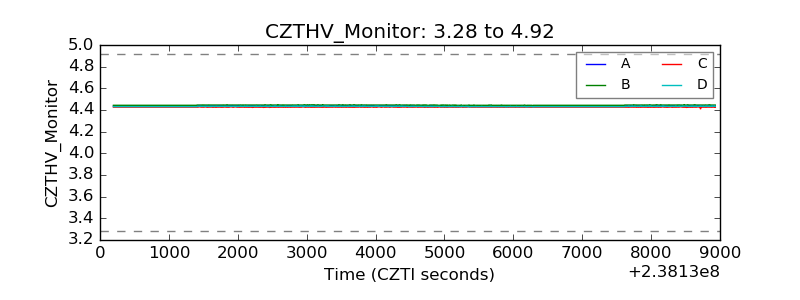 |
| D_VDD | 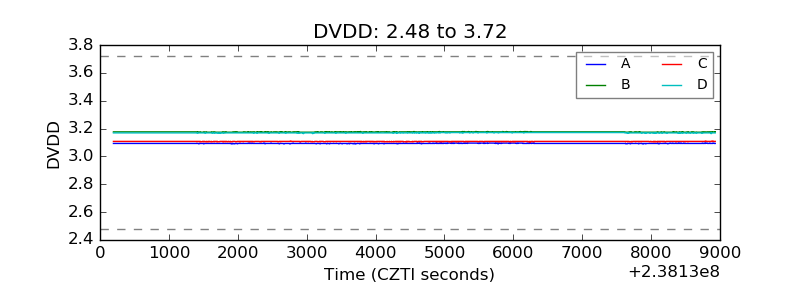 |
| Temperature 1 | 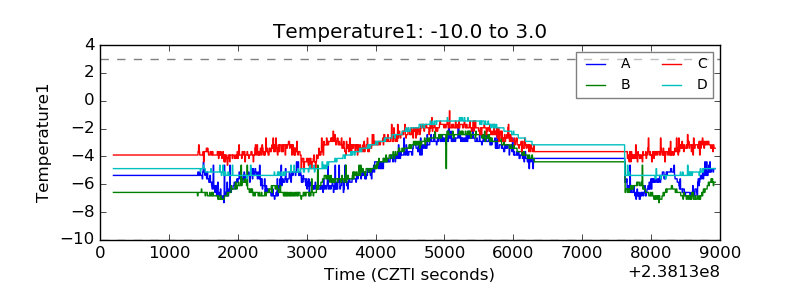 |
| Veto HV Monitor |  |
| Veto LLD | 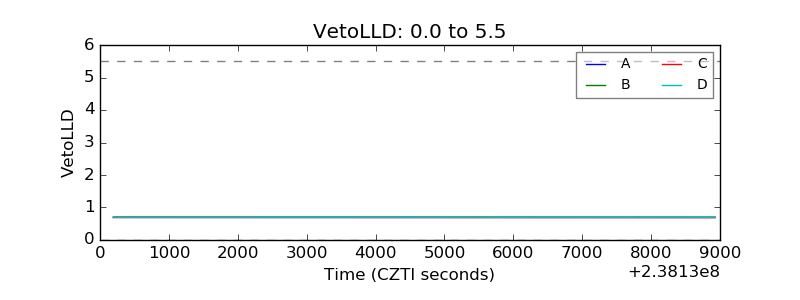 |
| Alpha Counter | 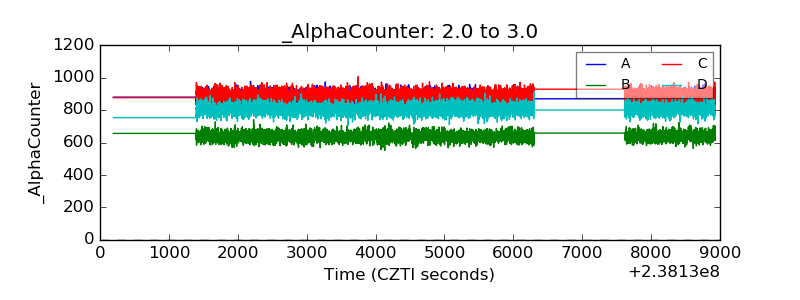 |
| _CPM_Rate | 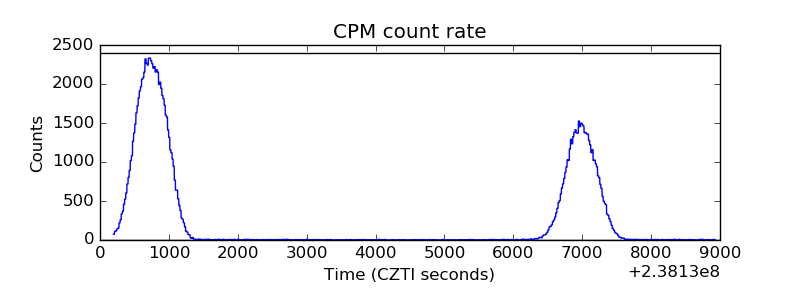 |
| CZT Counter | 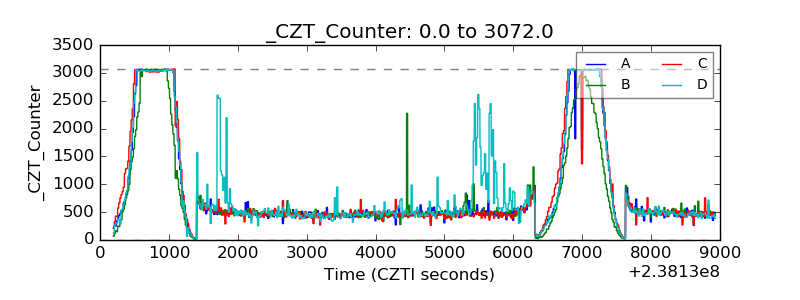 |
| +2.5 Volts monitor |  |
| +5 Volts monitor |  |
| _ROLL_ROT | 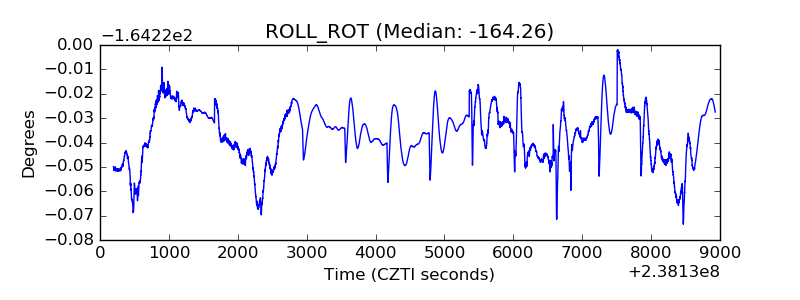 |
| _Roll_DEC | 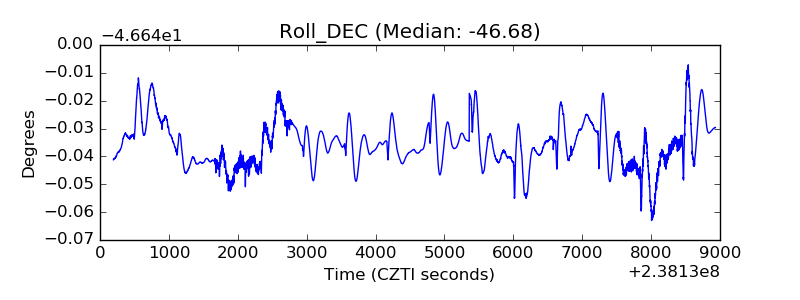 |
| _Roll_RA | 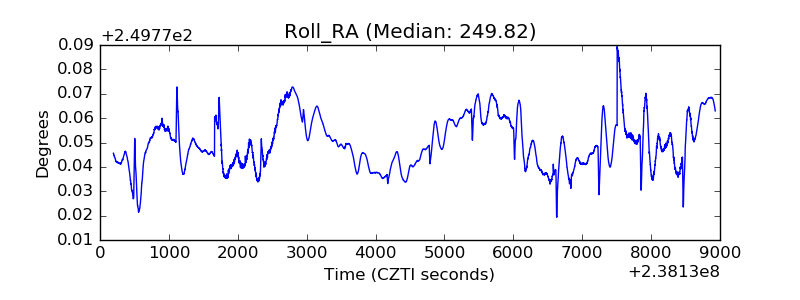 |
| Veto Counter | 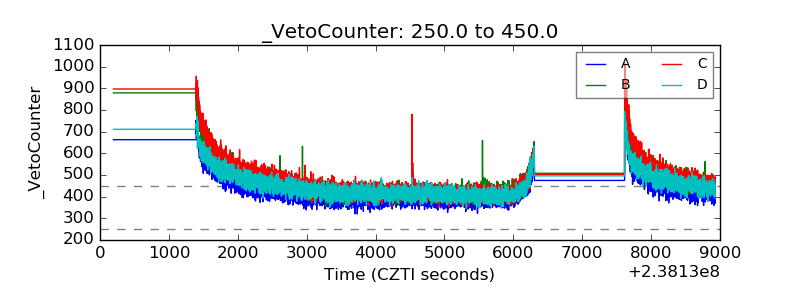 |