| Param | Original file | Final file |
|---|---|---|
| Filename | modeM0/AS1A03_080T01_9000001392_09771cztM0_level2.evt | modeM0/AS1A03_080T01_9000001392_09771cztM0_level2_quad_clean.evt |
| Size (bytes) | 427,357,440 | 66,686,400 |
| Size | 407.6 MB | 63.6 MB |
| Events in quadrant A | 3,023,367 | 393,200 |
| Events in quadrant B | 3,241,560 | 400,284 |
| Events in quadrant C | 3,022,354 | 401,501 |
| Events in quadrant D | 3,227,734 | 385,242 |
| Mode M0 | |||
|---|---|---|---|
| Quadrant | BADHDUFLAG | Total packets | Discarded packets |
| A | 0 | 12989 | 3 |
| B | 0 | 13517 | 2 |
| C | 0 | 13006 | 2 |
| D | 0 | 13589 | 2 |
| Mode M9 | |||
|---|---|---|---|
| Quadrant | BADHDUFLAG | Total packets | Discarded packets |
| A | 0 | 18 | 0 |
| B | 0 | 18 | 0 |
| C | 0 | 18 | 0 |
| D | 0 | 19 | 0 |
| Mode SS | |||
|---|---|---|---|
| Quadrant | BADHDUFLAG | Total packets | Discarded packets |
| A | 0 | 126 | 0 |
| B | 0 | 126 | 0 |
| C | 0 | 126 | 0 |
| D | 0 | 126 | 0 |
| Quadrant | Total seconds | Saturated seconds | Saturation percentage |
|---|---|---|---|
| A | 6294 | 81 | 1.286940% |
| B | 6294 | 116 | 1.843025% |
| C | 6294 | 84 | 1.334604% |
| D | 6294 | 101 | 1.604703% |
Noise dominated data is calculated using 1-second bins in cleaned event files. If a bin has >2000 counts, and if more than 50% of those come from <1% of pixels, then it is considered to be noise-dominated and hence unusable.
| Quadrant | # 1 sec bins | Bins with >0 counts | Bins with >2000 counts | High rate bins dominated by noise | Noise dominated (total time) | Noise dominated (detector-on time) | Marked lightcurve |
|---|---|---|---|---|---|---|---|
| A | 7469 | 6295 | 0 | 0 | 0.00% | 0.00% | 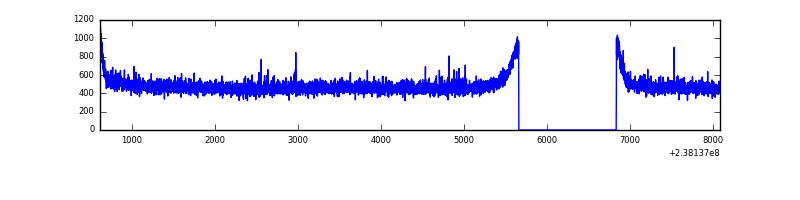 |
| B | 7469 | 6295 | 2 | 2 | 0.03% | 0.03% | 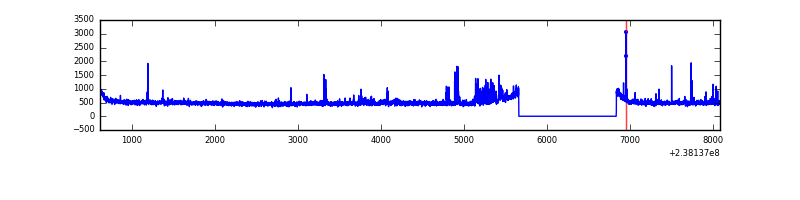 |
| C | 7469 | 6295 | 0 | 0 | 0.00% | 0.00% | 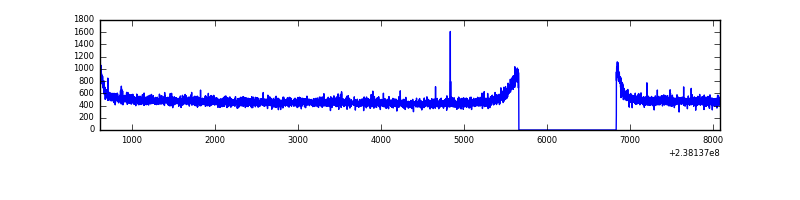 |
| D | 7469 | 6295 | 16 | 16 | 0.21% | 0.25% | 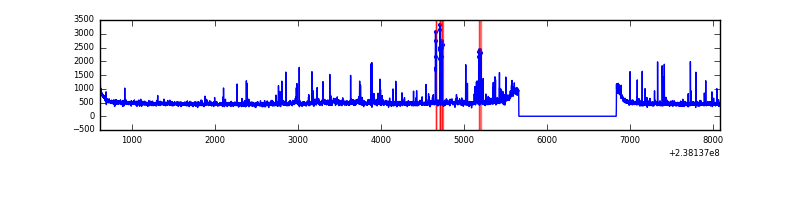 |
Top three noisy pixels from each quadrant. If the there are fewer than three noisy pixels in the level2.evt file, extra rows are filled as -1
| Pixel properties | Quadrant properties | ||||||
|---|---|---|---|---|---|---|---|
| Quadrant | DetID | PixID | Counts | Sigma | Mean | Median | Sigma |
| A | 8 | 15 | 12780 | 75.91 | 782 | 766 | 158.3 |
| A | 0 | 226 | 7061 | 39.77 | 782 | 766 | 158.3 |
| A | 12 | 194 | 6294 | 34.93 | 782 | 766 | 158.3 |
| B | 4 | 48 | 89557 | 597.75 | 787 | 768 | 148.5 |
| B | 10 | 245 | 40871 | 269.98 | 787 | 768 | 148.5 |
| B | 0 | 214 | 29162 | 191.16 | 787 | 768 | 148.5 |
| C | 13 | 61 | 5841 | 28.59 | 773 | 775 | 177.2 |
| C | 12 | 4 | 3757 | 16.83 | 773 | 775 | 177.2 |
| C | 8 | 222 | 2944 | 12.24 | 773 | 775 | 177.2 |
| D | 1 | 52 | 145267 | 785.06 | 763 | 744 | 184.1 |
| D | 8 | 195 | 42744 | 228.15 | 763 | 744 | 184.1 |
| D | 7 | 46 | 35156 | 186.93 | 763 | 744 | 184.1 |
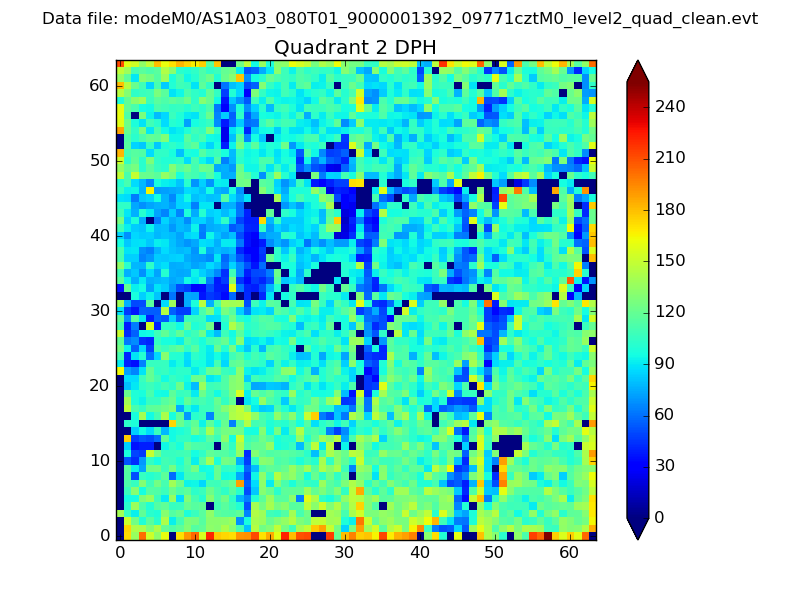
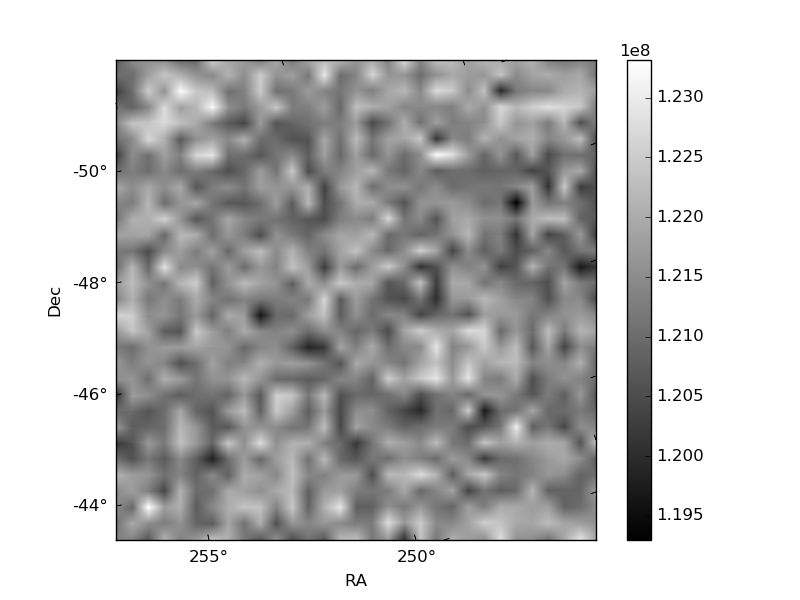
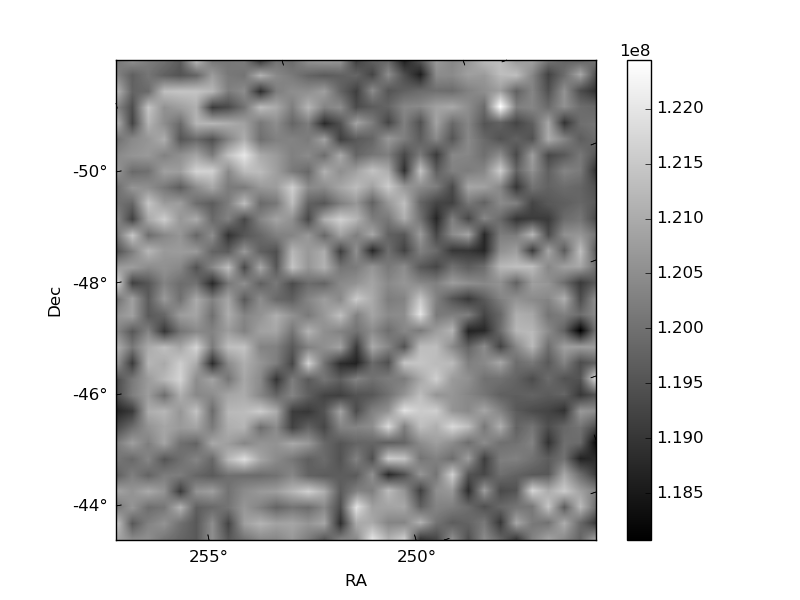
Histogram calculated using DETX and DETY for each event in the final _common_clean file
| Quadrant A | 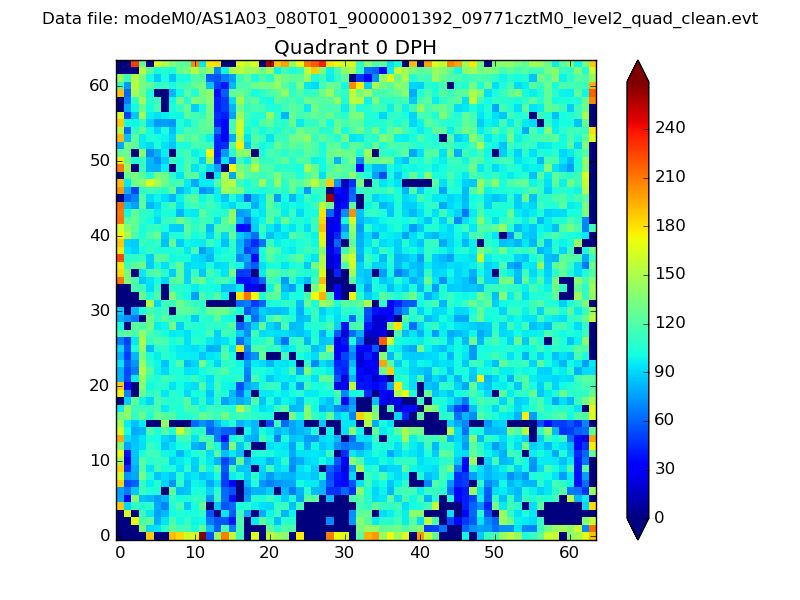 |
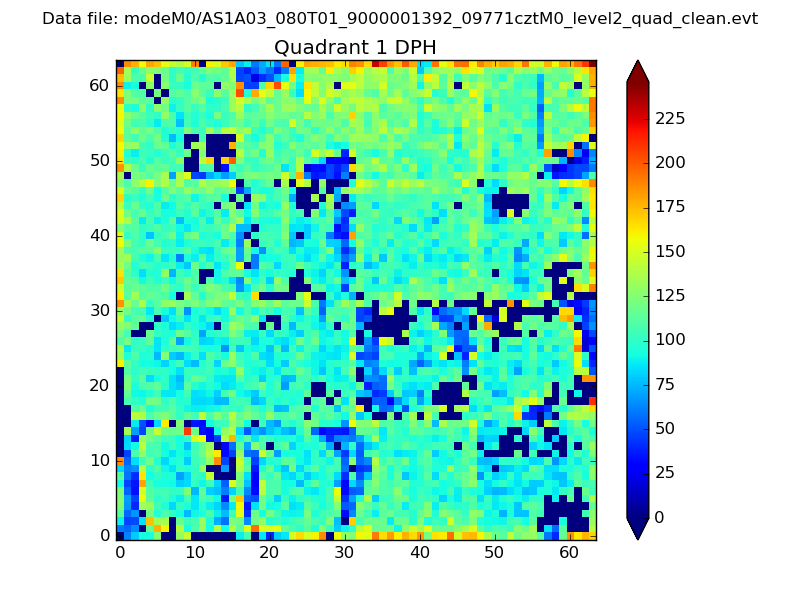 |
Quadrant B |
|---|---|---|---|
| Quadrant D | 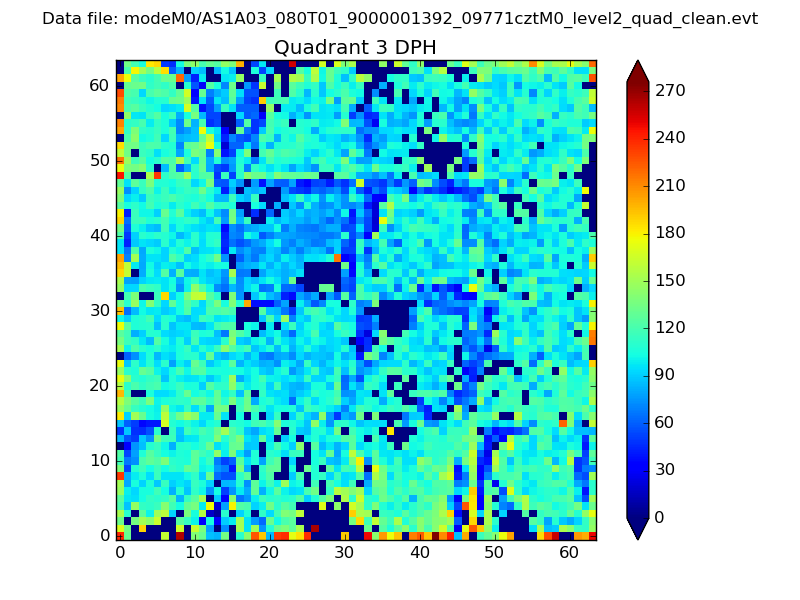 |
 |
Quadrant C |
| Plot type | Count rate plots | Images |
|---|---|---|
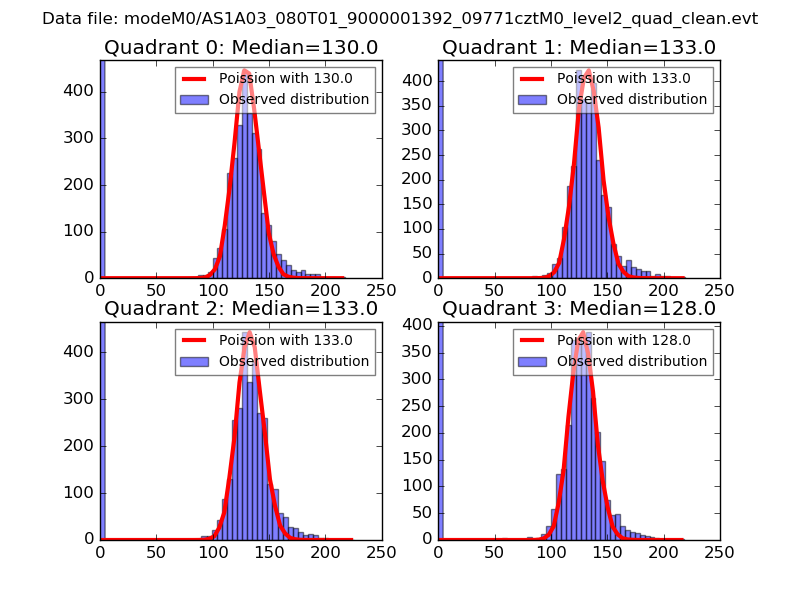
| Comparison with Poisson distribution Blue bars denote a histogram of data divided into 1 sec bins. Red curve is a Poisson curve with rate = median count rate of data. |
 |
 |
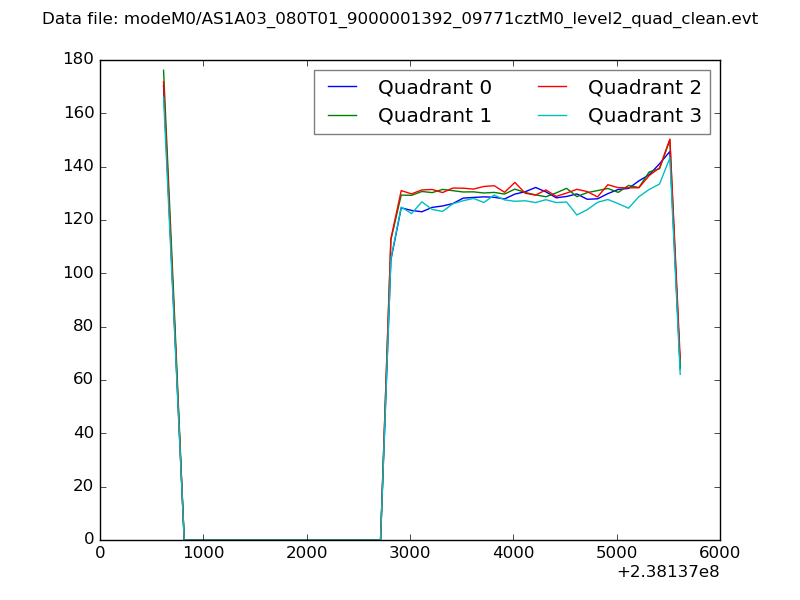
| Quadrant-wise count rates Data is divided into 100 sec bins |
 |
|
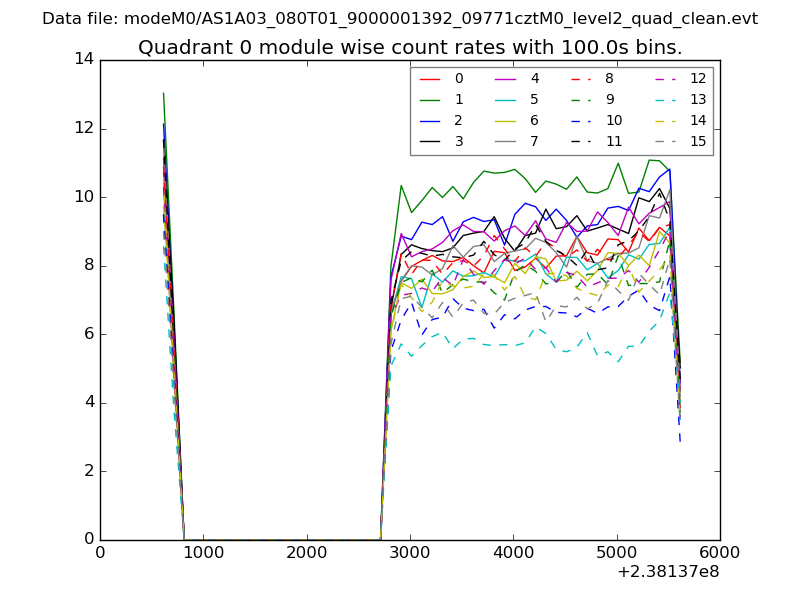
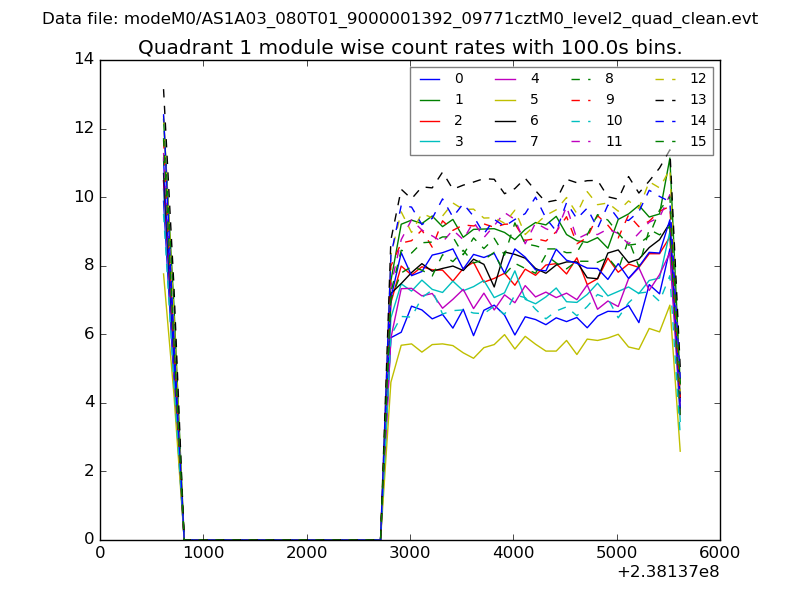
| Module-wise count rates for Quadrant A Data is divided into 100 sec bins |
 |
 |
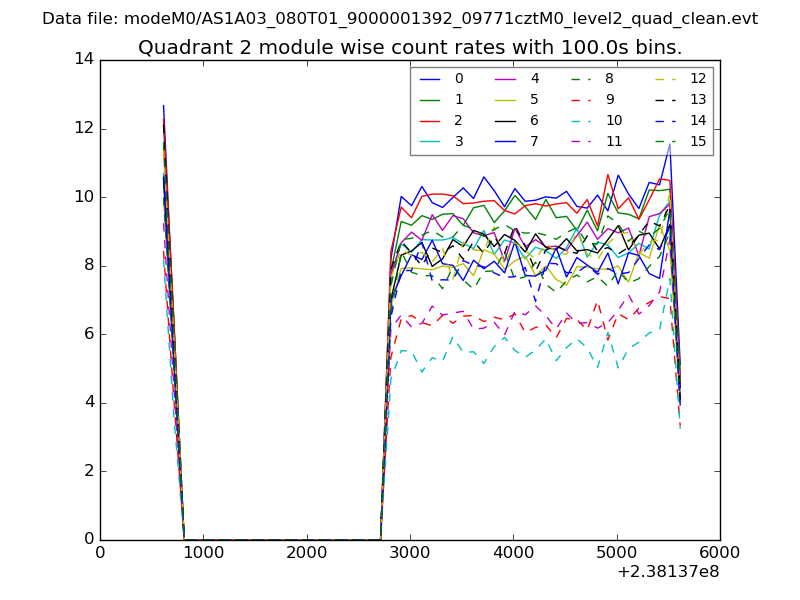
| Module-wise count rates for Quadrant B Data is divided into 100 sec bins |
 |
 |
| Module-wise count rates for Quadrant C Data is divided into 100 sec bins |
 |
 |
| Module-wise count rates for Quadrant D Data is divided into 100 sec bins |
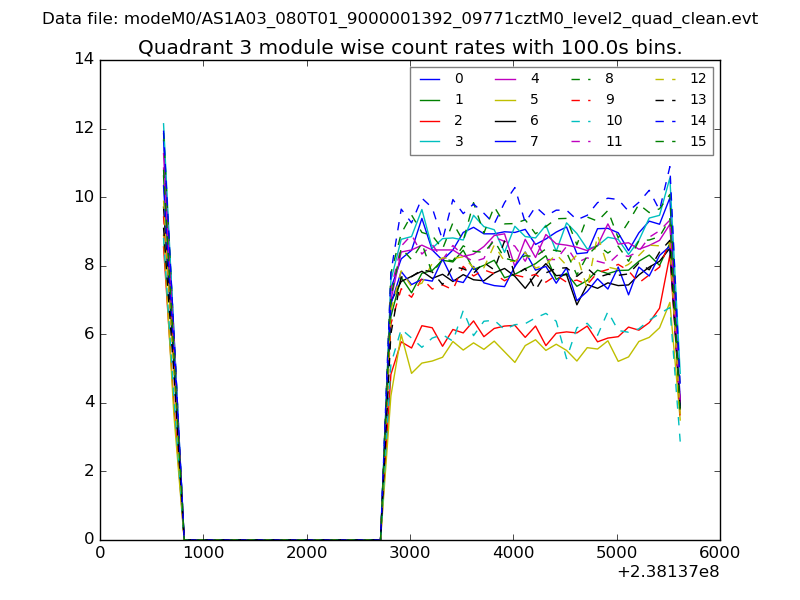 |
 |
| Parameter | Plot |
|---|---|
| CZT HV Monitor | 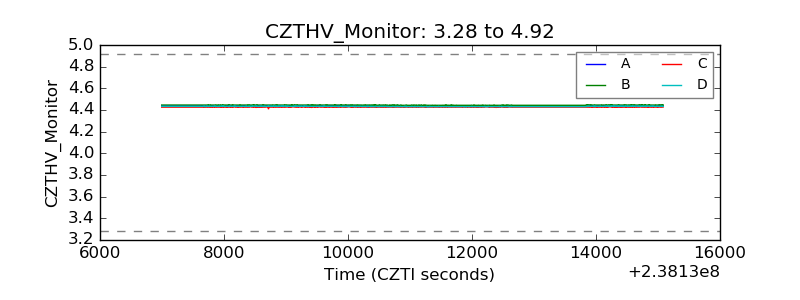 |
| D_VDD | 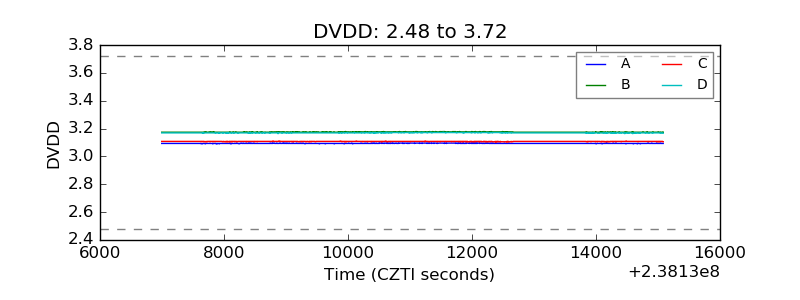 |
| Temperature 1 | 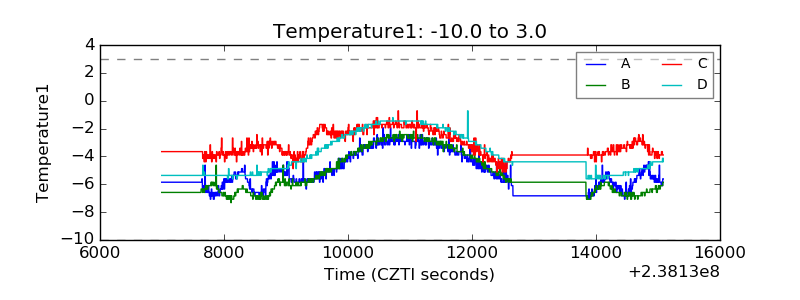 |
| Veto HV Monitor | 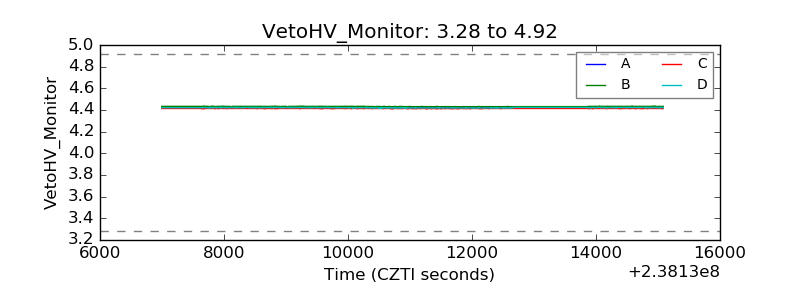 |
| Veto LLD | 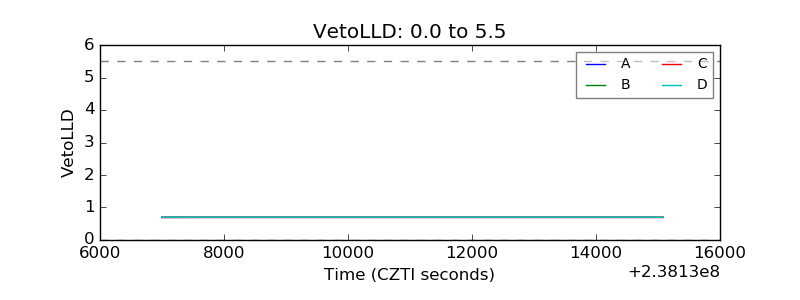 |
| Alpha Counter | 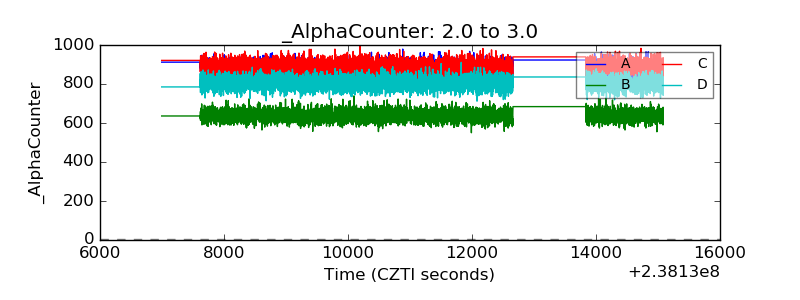 |
| _CPM_Rate | 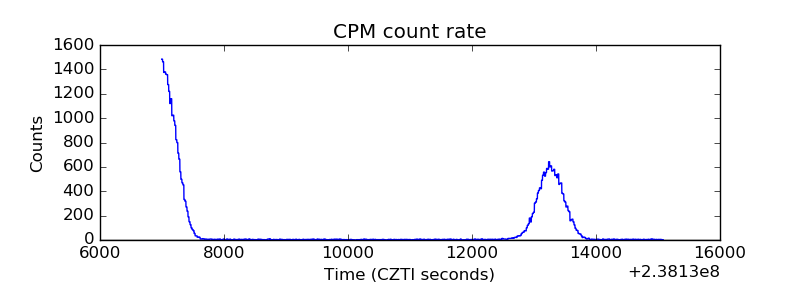 |
| CZT Counter | 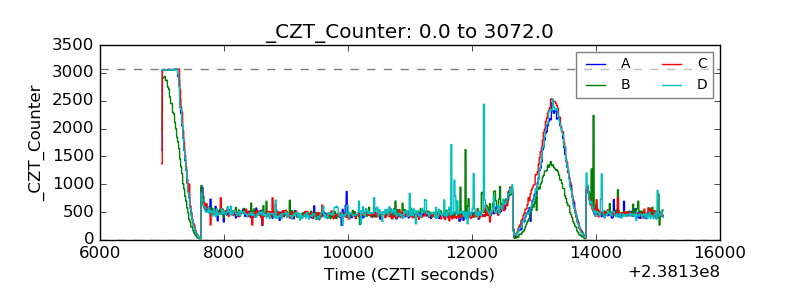 |
| +2.5 Volts monitor |  |
| +5 Volts monitor |  |
| _ROLL_ROT | 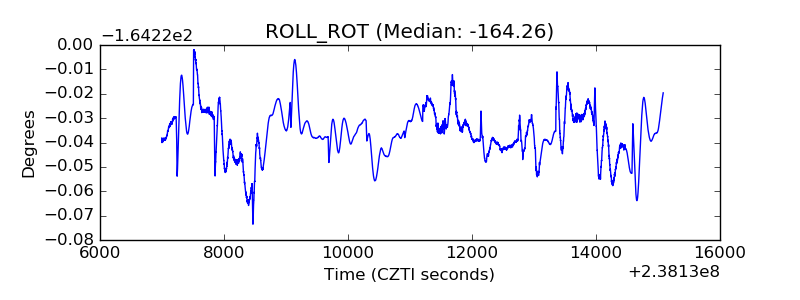 |
| _Roll_DEC | 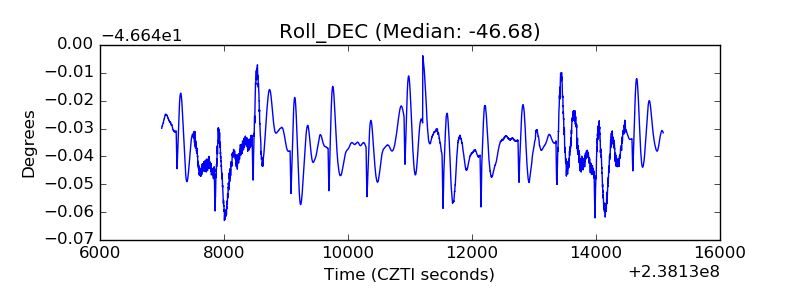 |
| _Roll_RA | 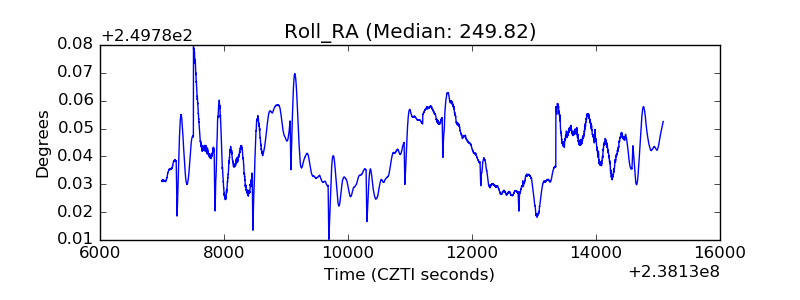 |
| Veto Counter | 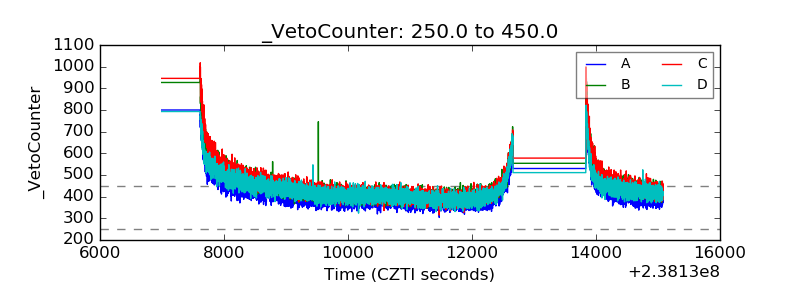 |