| Param | Original file | Final file |
|---|---|---|
| Filename | modeM0/AS1A03_080T01_9000001392_09773cztM0_level2.evt | modeM0/AS1A03_080T01_9000001392_09773cztM0_level2_quad_clean.evt |
| Size (bytes) | 475,416,000 | 83,920,320 |
| Size | 453.4 MB | 80.0 MB |
| Events in quadrant A | 3,315,361 | 508,575 |
| Events in quadrant B | 3,691,960 | 513,631 |
| Events in quadrant C | 3,307,399 | 516,176 |
| Events in quadrant D | 3,591,149 | 499,075 |
| Mode M0 | |||
|---|---|---|---|
| Quadrant | BADHDUFLAG | Total packets | Discarded packets |
| A | 0 | 14844 | 3 |
| B | 0 | 15659 | 2 |
| C | 0 | 14869 | 2 |
| D | 0 | 15408 | 4 |
| Mode M9 | |||
|---|---|---|---|
| Quadrant | BADHDUFLAG | Total packets | Discarded packets |
| A | 0 | 11 | 0 |
| B | 0 | 11 | 0 |
| C | 0 | 11 | 0 |
| D | 0 | 12 | 0 |
| Mode SS | |||
|---|---|---|---|
| Quadrant | BADHDUFLAG | Total packets | Discarded packets |
| A | 0 | 148 | 0 |
| B | 0 | 148 | 0 |
| C | 0 | 148 | 0 |
| D | 0 | 148 | 0 |
| Quadrant | Total seconds | Saturated seconds | Saturation percentage |
|---|---|---|---|
| A | 7231 | 162 | 2.240354% |
| B | 7231 | 226 | 3.125432% |
| C | 7231 | 132 | 1.825474% |
| D | 7230 | 152 | 2.102351% |
Noise dominated data is calculated using 1-second bins in cleaned event files. If a bin has >2000 counts, and if more than 50% of those come from <1% of pixels, then it is considered to be noise-dominated and hence unusable.
| Quadrant | # 1 sec bins | Bins with >0 counts | Bins with >2000 counts | High rate bins dominated by noise | Noise dominated (total time) | Noise dominated (detector-on time) | Marked lightcurve |
|---|---|---|---|---|---|---|---|
| A | 7721 | 7232 | 0 | 0 | 0.00% | 0.00% | 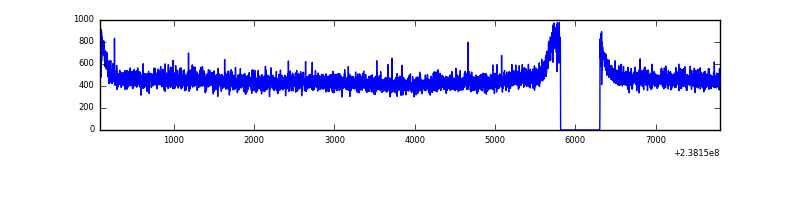 |
| B | 7721 | 7232 | 30 | 30 | 0.39% | 0.41% | 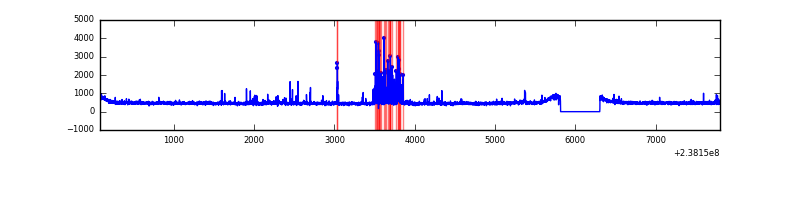 |
| C | 7721 | 7232 | 0 | 0 | 0.00% | 0.00% | 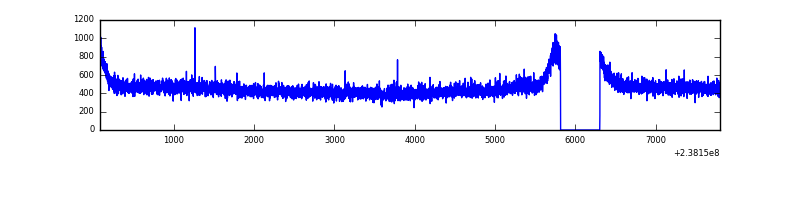 |
| D | 7721 | 7232 | 9 | 9 | 0.12% | 0.12% | 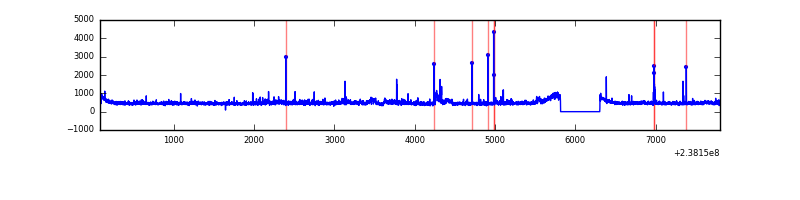 |
Top three noisy pixels from each quadrant. If the there are fewer than three noisy pixels in the level2.evt file, extra rows are filled as -1
| Pixel properties | Quadrant properties | ||||||
|---|---|---|---|---|---|---|---|
| Quadrant | DetID | PixID | Counts | Sigma | Mean | Median | Sigma |
| A | 0 | 226 | 7947 | 40.49 | 860 | 840 | 175.5 |
| A | 12 | 194 | 7051 | 35.38 | 860 | 840 | 175.5 |
| A | 3 | 137 | 3965 | 17.8 | 860 | 840 | 175.5 |
| B | 4 | 239 | 221075 | 1334.03 | 863 | 841 | 165.1 |
| B | 10 | 245 | 39119 | 231.86 | 863 | 841 | 165.1 |
| B | 12 | 111 | 18730 | 108.36 | 863 | 841 | 165.1 |
| C | 13 | 61 | 6268 | 27.5 | 846 | 850 | 197.0 |
| C | 8 | 222 | 3708 | 14.51 | 846 | 850 | 197.0 |
| C | 14 | 67 | 2829 | 10.04 | 846 | 850 | 197.0 |
| D | 8 | 195 | 102707 | 495.75 | 840 | 818 | 205.5 |
| D | 1 | 52 | 95090 | 458.68 | 840 | 818 | 205.5 |
| D | 7 | 46 | 76355 | 367.53 | 840 | 818 | 205.5 |
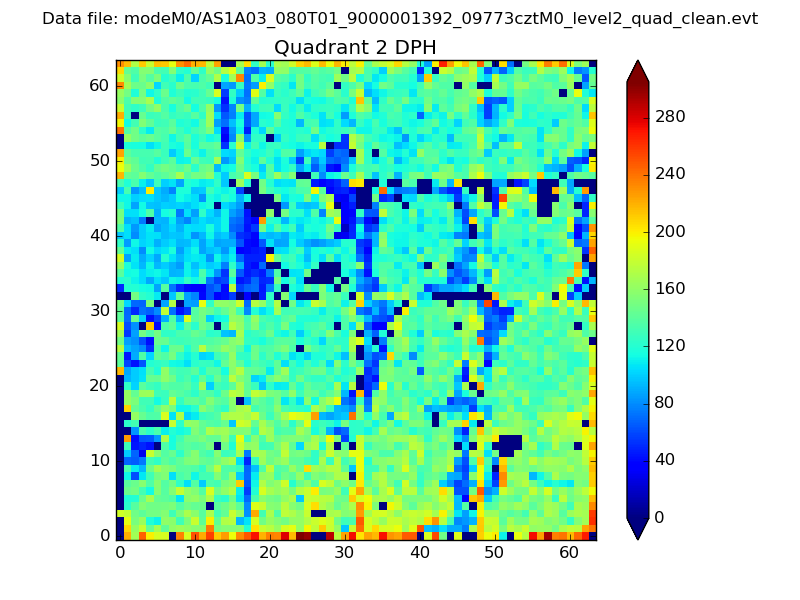
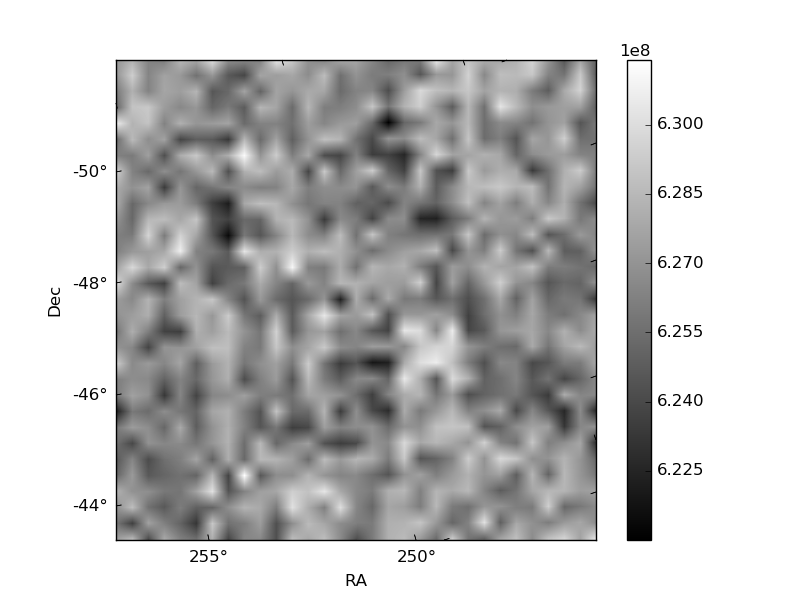
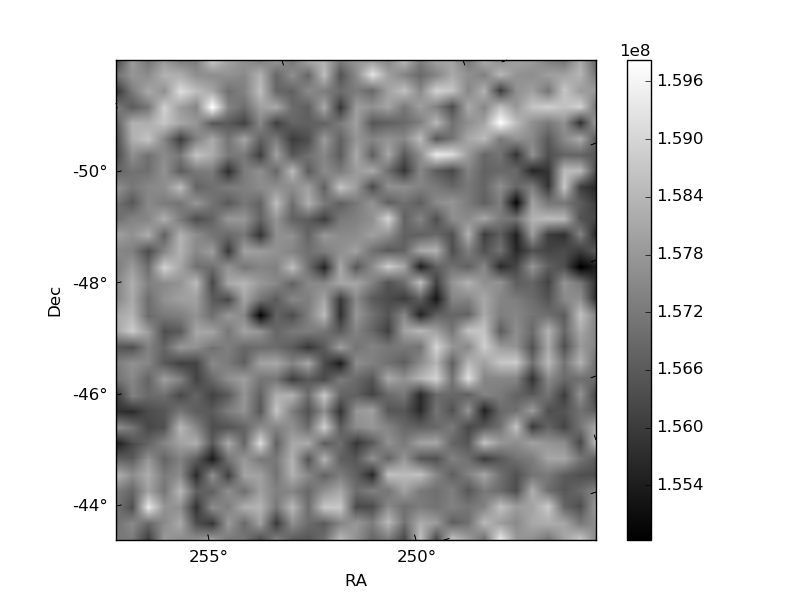
Histogram calculated using DETX and DETY for each event in the final _common_clean file
| Quadrant A | 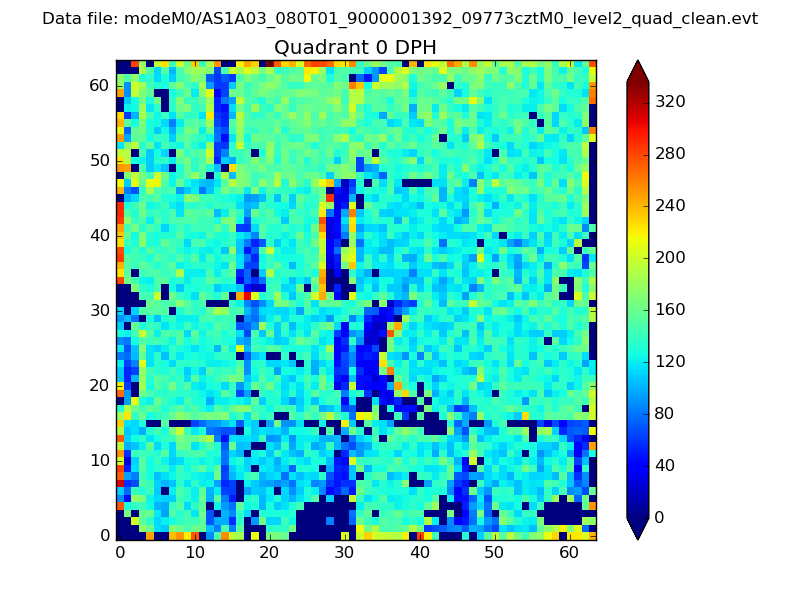 |
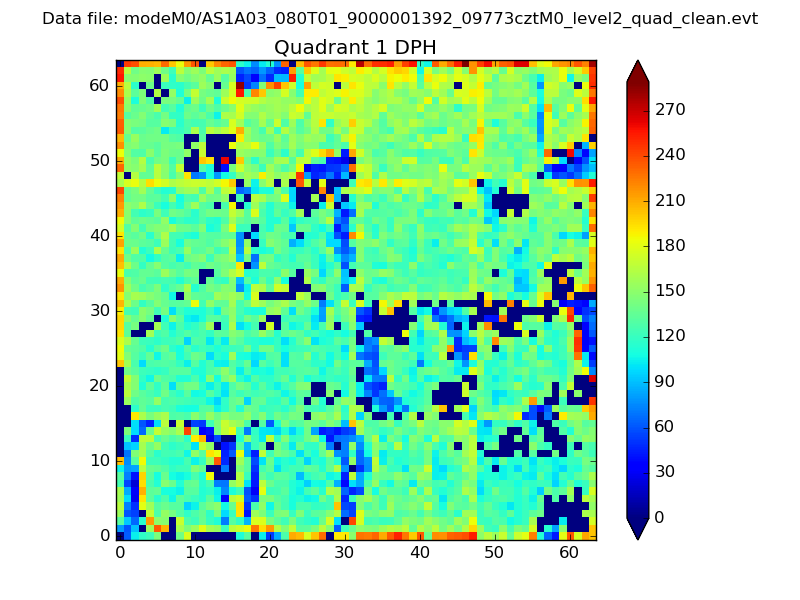 |
Quadrant B |
|---|---|---|---|
| Quadrant D | 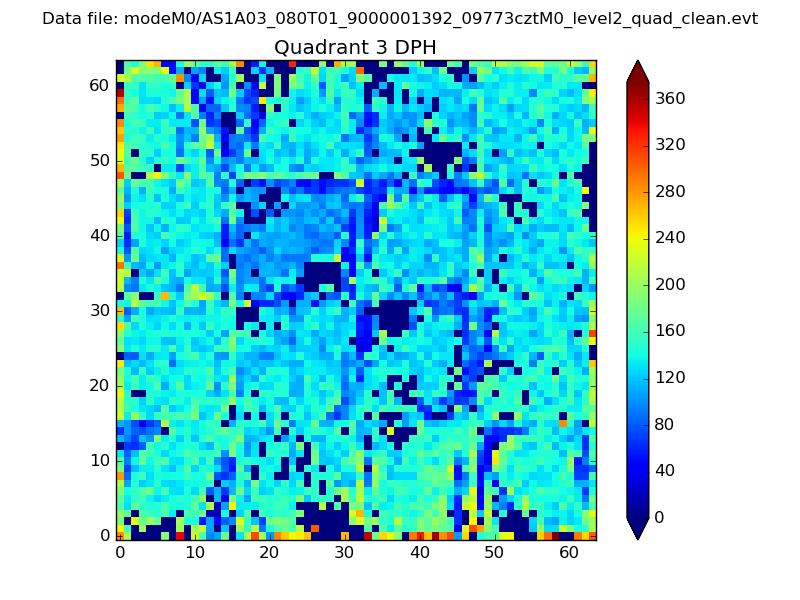 |
 |
Quadrant C |
| Plot type | Count rate plots | Images |
|---|---|---|
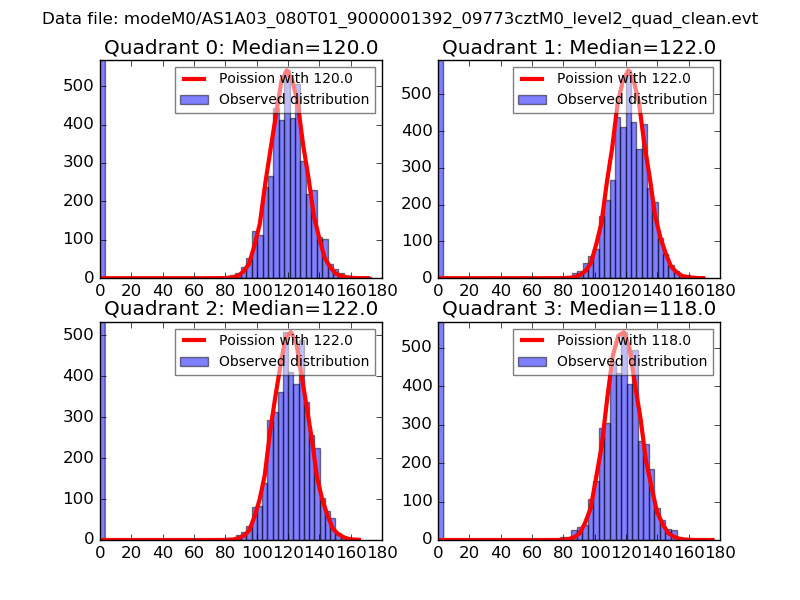
| Comparison with Poisson distribution Blue bars denote a histogram of data divided into 1 sec bins. Red curve is a Poisson curve with rate = median count rate of data. |
 |
 |
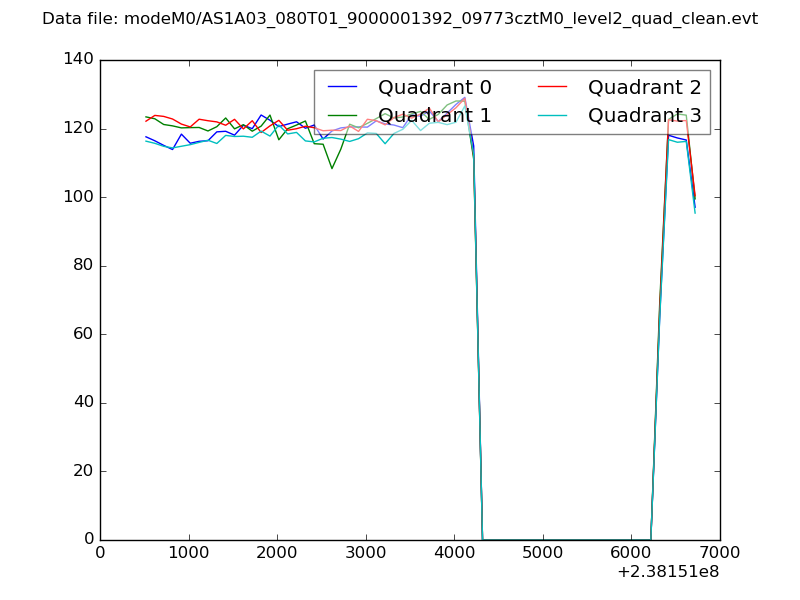
| Quadrant-wise count rates Data is divided into 100 sec bins |
 |
|
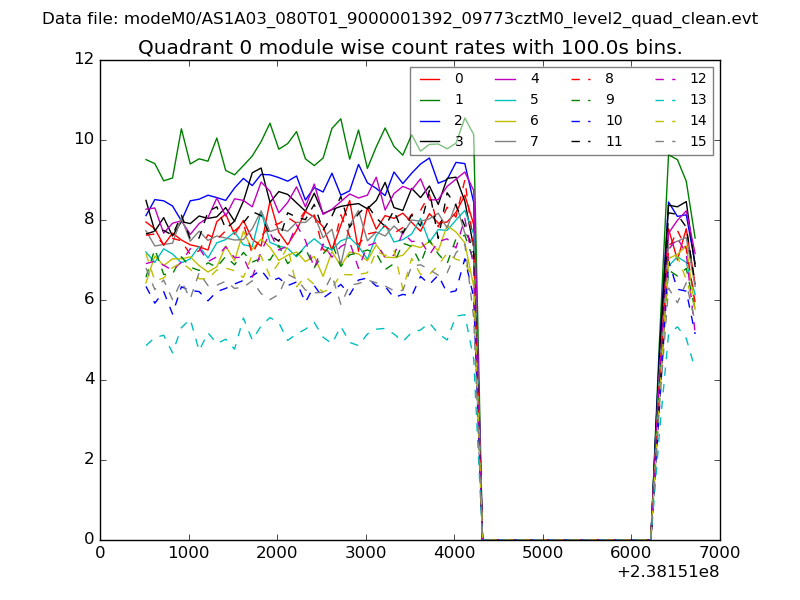
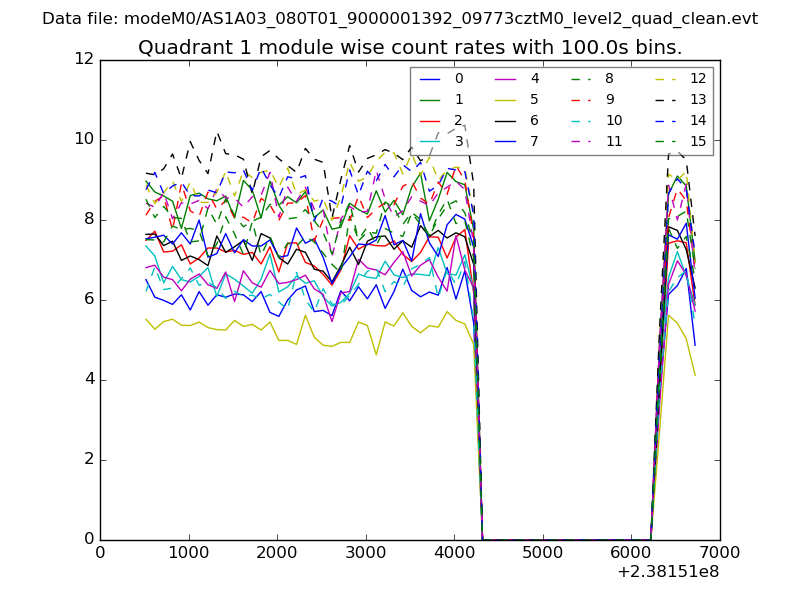
| Module-wise count rates for Quadrant A Data is divided into 100 sec bins |
 |
 |
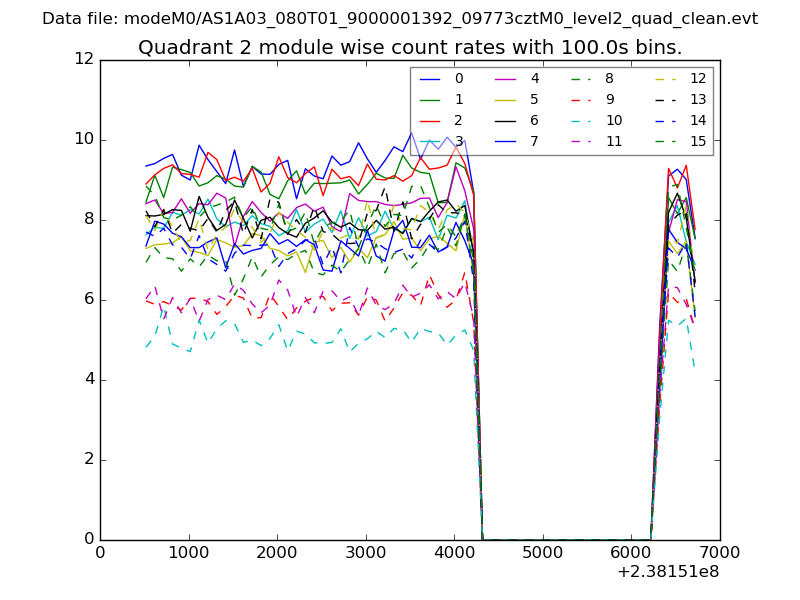
| Module-wise count rates for Quadrant B Data is divided into 100 sec bins |
 |
 |
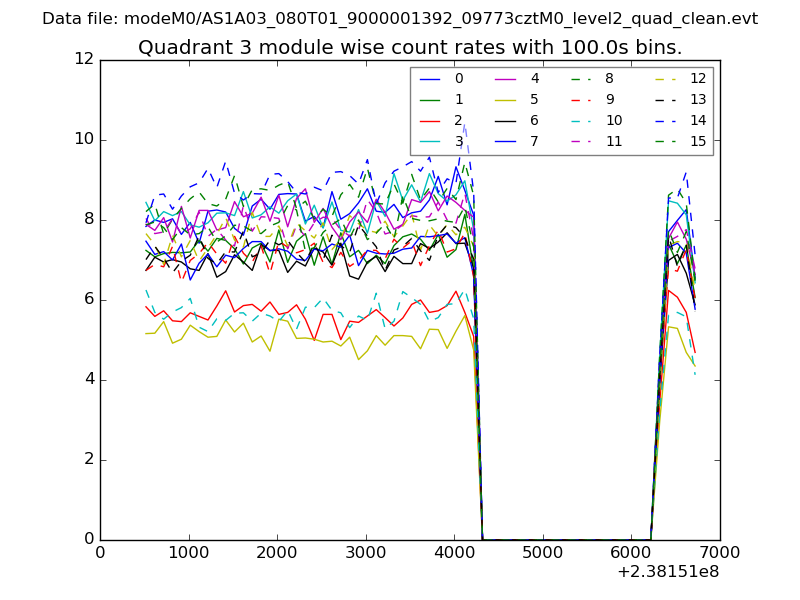
| Module-wise count rates for Quadrant C Data is divided into 100 sec bins |
 |
 |
| Module-wise count rates for Quadrant D Data is divided into 100 sec bins |
 |
 |
| Parameter | Plot |
|---|---|
| CZT HV Monitor | 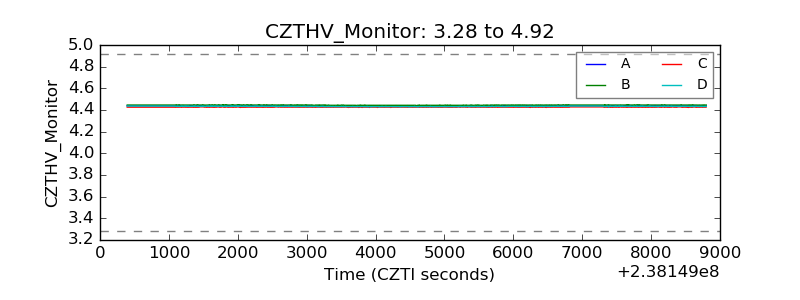 |
| D_VDD | 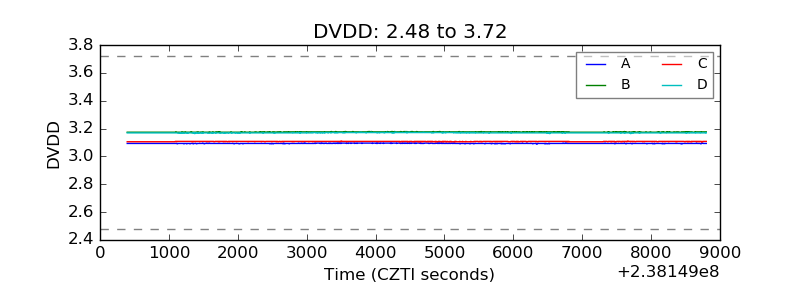 |
| Temperature 1 | 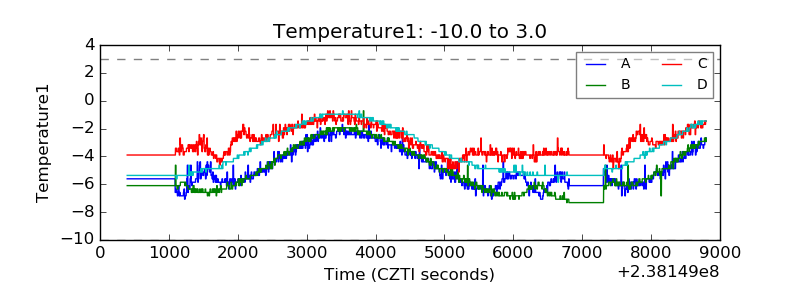 |
| Veto HV Monitor | 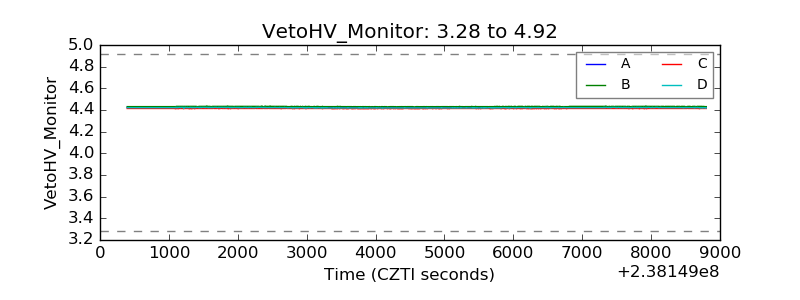 |
| Veto LLD | 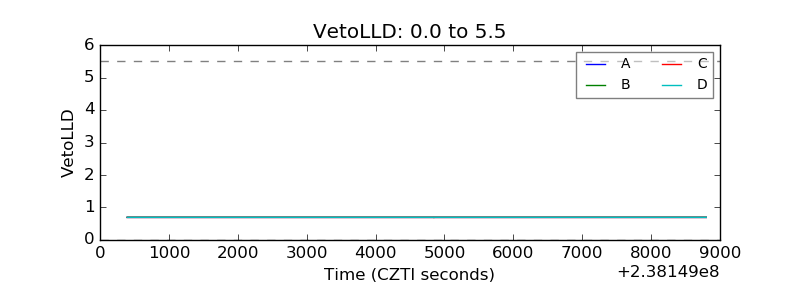 |
| Alpha Counter | 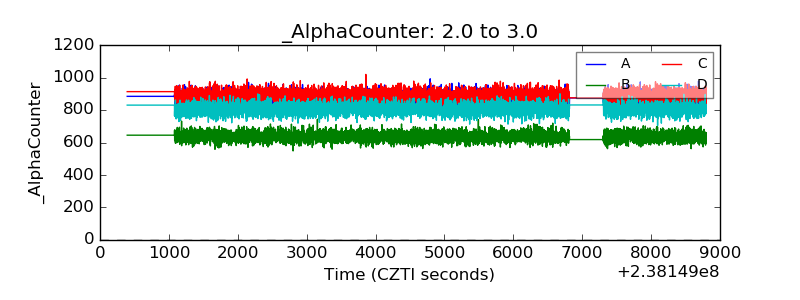 |
| _CPM_Rate | 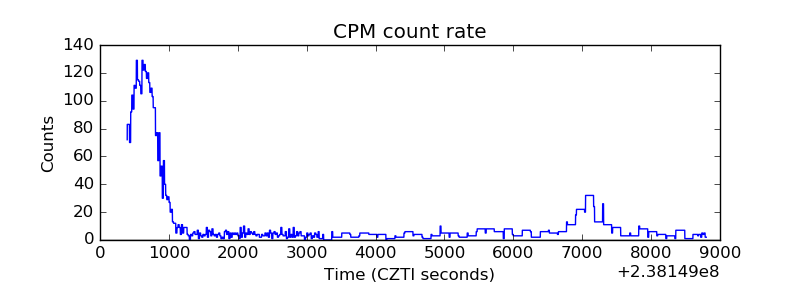 |
| CZT Counter | 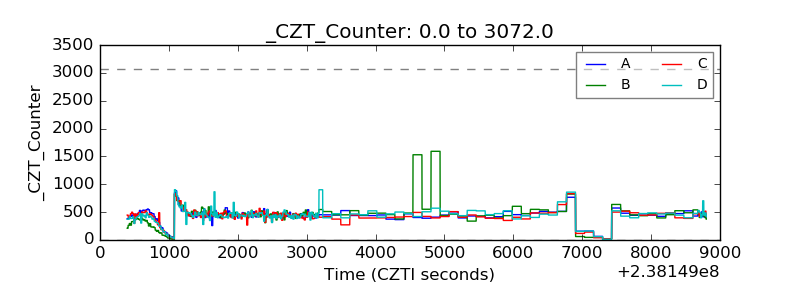 |
| +2.5 Volts monitor |  |
| +5 Volts monitor | 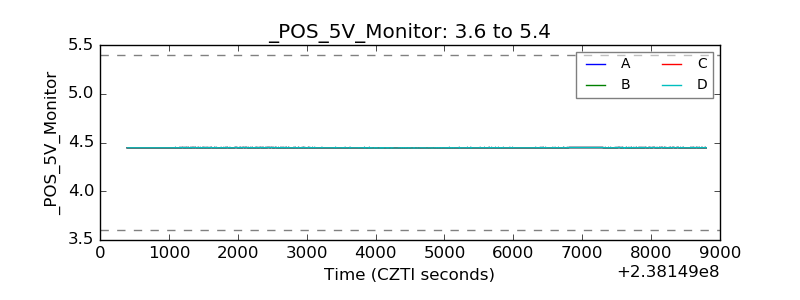 |
| _ROLL_ROT | 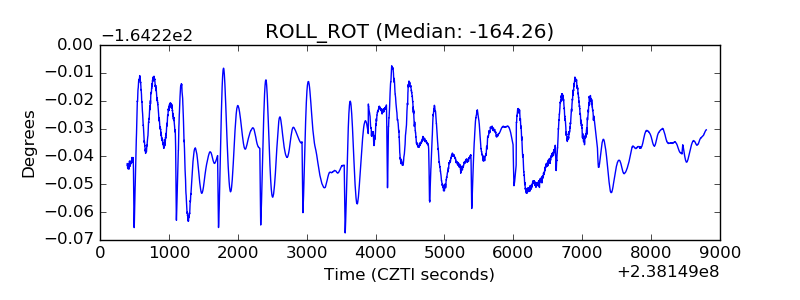 |
| _Roll_DEC | 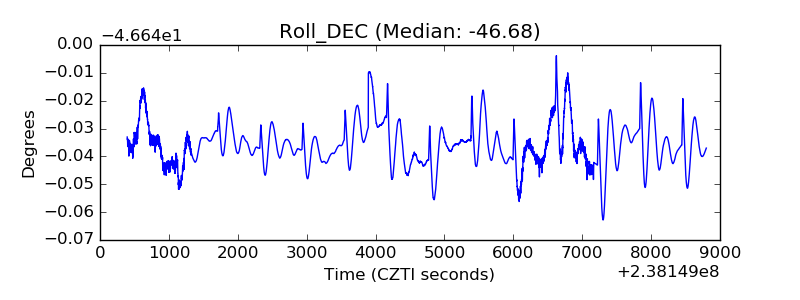 |
| _Roll_RA | 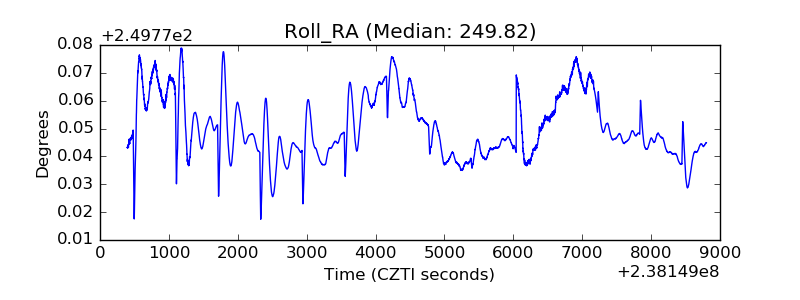 |
| Veto Counter | 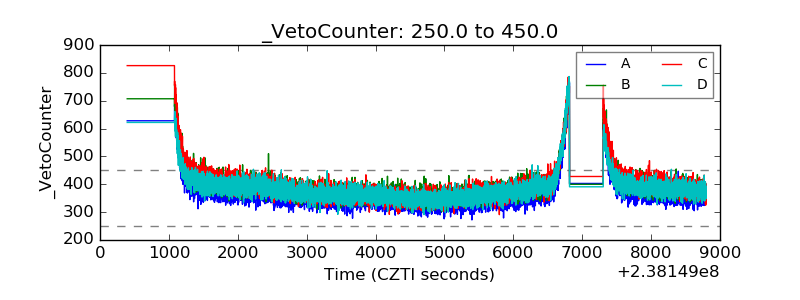 |