| Param | Original file | Final file |
|---|---|---|
| Filename | modeM0/AS1A03_080T01_9000001392_09774cztM0_level2.evt | modeM0/AS1A03_080T01_9000001392_09774cztM0_level2_quad_clean.evt |
| Size (bytes) | 500,927,040 | 90,576,000 |
| Size | 477.7 MB | 86.4 MB |
| Events in quadrant A | 3,502,836 | 554,205 |
| Events in quadrant B | 3,875,326 | 558,693 |
| Events in quadrant C | 3,454,008 | 562,912 |
| Events in quadrant D | 3,823,986 | 540,497 |
| Mode M0 | |||
|---|---|---|---|
| Quadrant | BADHDUFLAG | Total packets | Discarded packets |
| A | 0 | 15702 | 39 |
| B | 0 | 16396 | 11 |
| C | 0 | 15579 | 16 |
| D | 0 | 16478 | 23 |
| Mode M9 | |||
|---|---|---|---|
| Quadrant | BADHDUFLAG | Total packets | Discarded packets |
| A | 0 | 1 | 0 |
| B | 0 | 1 | 0 |
| C | 0 | 1 | 0 |
| D | 0 | 1 | 0 |
| Mode SS | |||
|---|---|---|---|
| Quadrant | BADHDUFLAG | Total packets | Discarded packets |
| A | 0 | 154 | 0 |
| B | 0 | 154 | 0 |
| C | 0 | 154 | 0 |
| D | 0 | 154 | 2 |
| Quadrant | Total seconds | Saturated seconds | Saturation percentage |
|---|---|---|---|
| A | 7561 | 199 | 2.631927% |
| B | 7573 | 261 | 3.446455% |
| C | 7570 | 130 | 1.717305% |
| D | 7567 | 171 | 2.259812% |
Noise dominated data is calculated using 1-second bins in cleaned event files. If a bin has >2000 counts, and if more than 50% of those come from <1% of pixels, then it is considered to be noise-dominated and hence unusable.
| Quadrant | # 1 sec bins | Bins with >0 counts | Bins with >2000 counts | High rate bins dominated by noise | Noise dominated (total time) | Noise dominated (detector-on time) | Marked lightcurve |
|---|---|---|---|---|---|---|---|
| A | 7703 | 7577 | 0 | 0 | 0.00% | 0.00% | 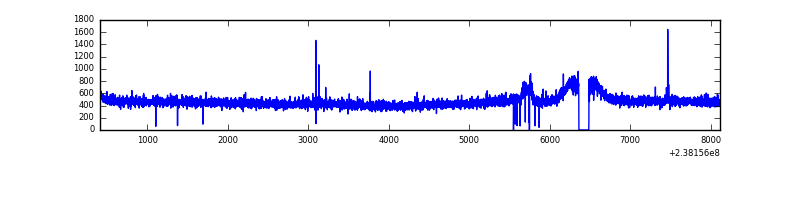 |
| B | 7703 | 7579 | 25 | 25 | 0.32% | 0.33% | 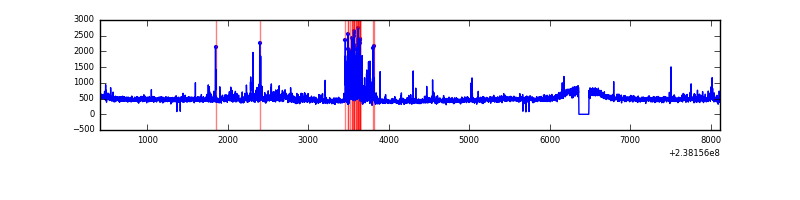 |
| C | 7703 | 7577 | 0 | 0 | 0.00% | 0.00% | 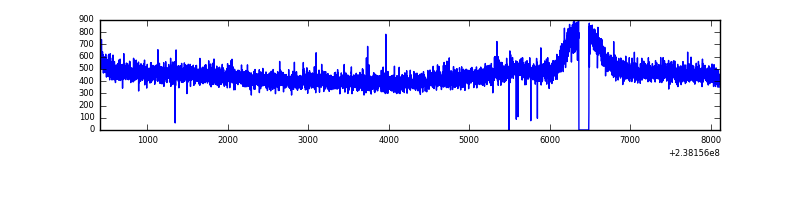 |
| D | 7703 | 7578 | 18 | 18 | 0.23% | 0.24% | 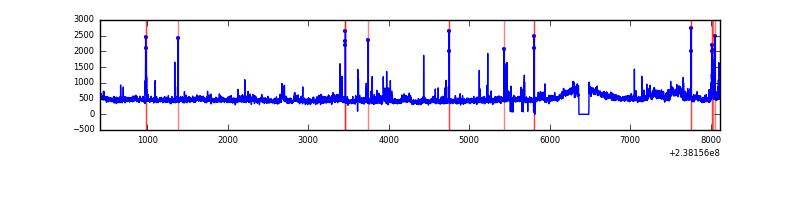 |
Top three noisy pixels from each quadrant. If the there are fewer than three noisy pixels in the level2.evt file, extra rows are filled as -1
| Pixel properties | Quadrant properties | ||||||
|---|---|---|---|---|---|---|---|
| Quadrant | DetID | PixID | Counts | Sigma | Mean | Median | Sigma |
| A | 15 | 239 | 44308 | 236.21 | 897 | 875 | 183.9 |
| A | 0 | 226 | 8343 | 40.61 | 897 | 875 | 183.9 |
| A | 12 | 194 | 7538 | 36.24 | 897 | 875 | 183.9 |
| B | 4 | 239 | 170490 | 974.83 | 904 | 880 | 174.0 |
| B | 0 | 214 | 86208 | 490.42 | 904 | 880 | 174.0 |
| B | 0 | 219 | 39601 | 222.55 | 904 | 880 | 174.0 |
| C | 13 | 61 | 6598 | 28.01 | 882 | 884 | 204.0 |
| C | 8 | 128 | 4860 | 19.49 | 882 | 884 | 204.0 |
| C | 8 | 222 | 4070 | 15.62 | 882 | 884 | 204.0 |
| D | 8 | 195 | 166118 | 788.1 | 874 | 852 | 209.7 |
| D | 1 | 52 | 107581 | 508.96 | 874 | 852 | 209.7 |
| D | 2 | 152 | 65073 | 306.25 | 874 | 852 | 209.7 |
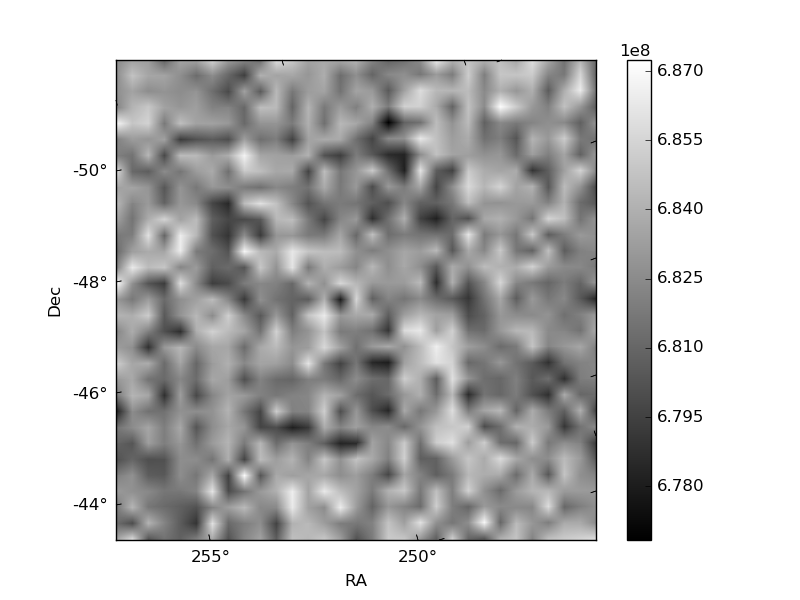
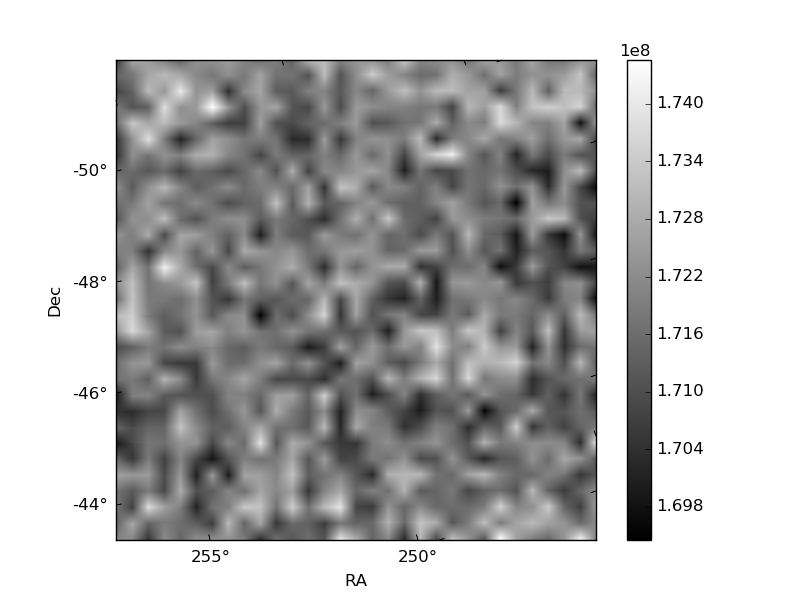
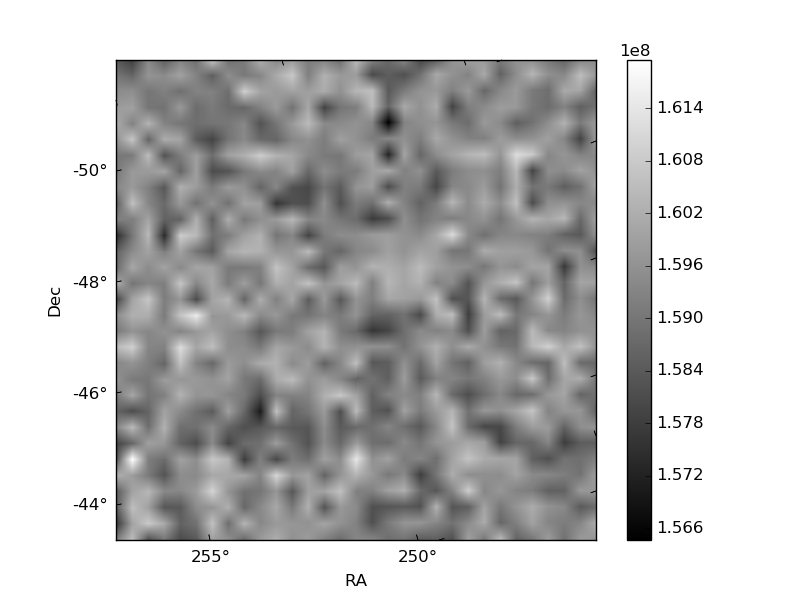
Histogram calculated using DETX and DETY for each event in the final _common_clean file
| Quadrant A | 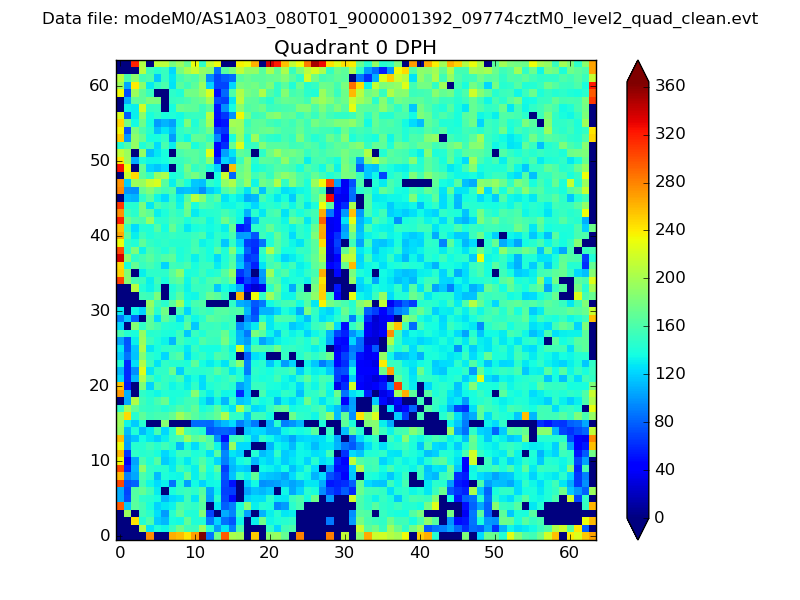 |
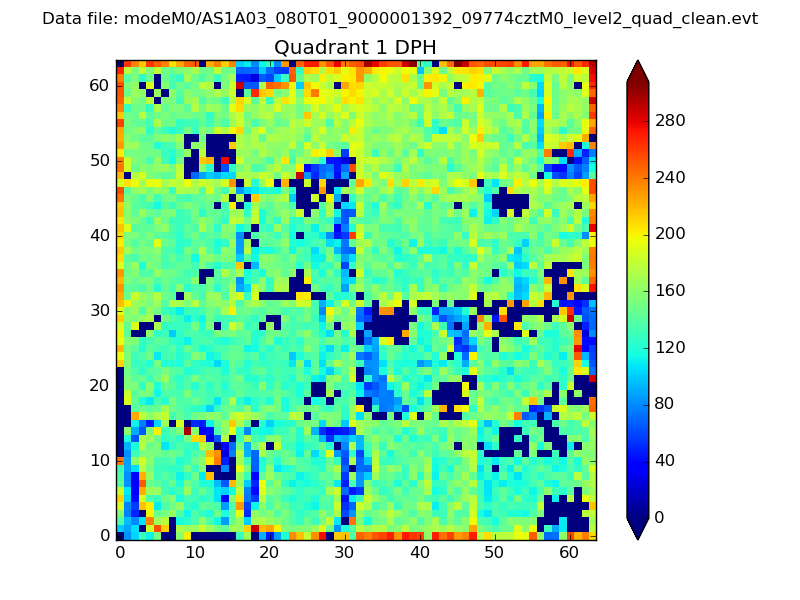 |
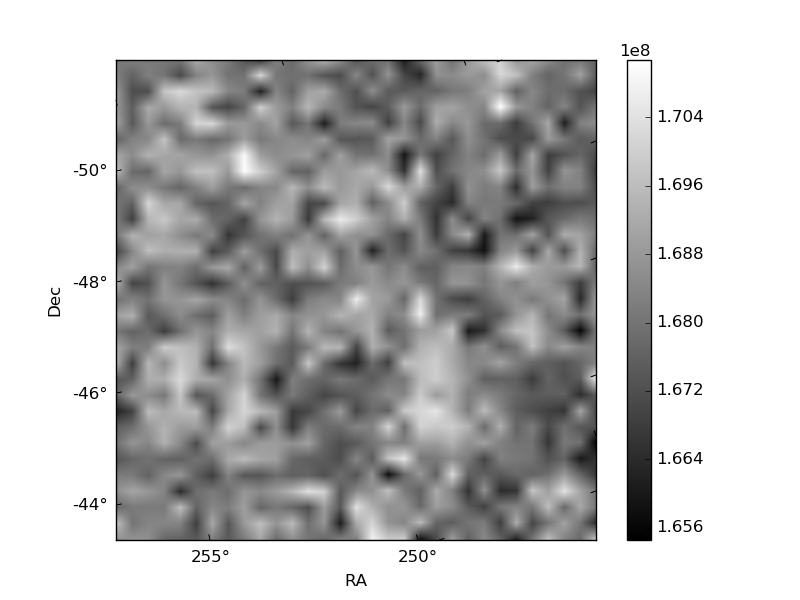
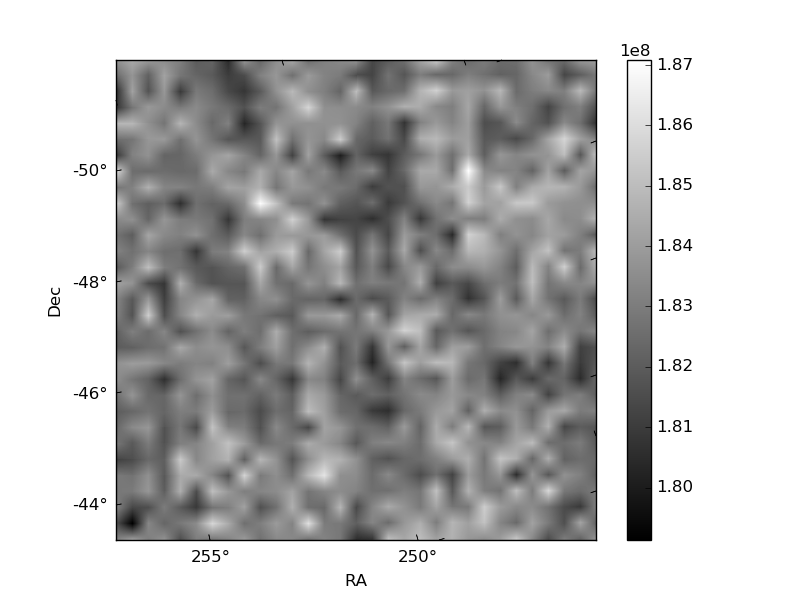
Quadrant B |
|---|---|---|---|
| Quadrant D | 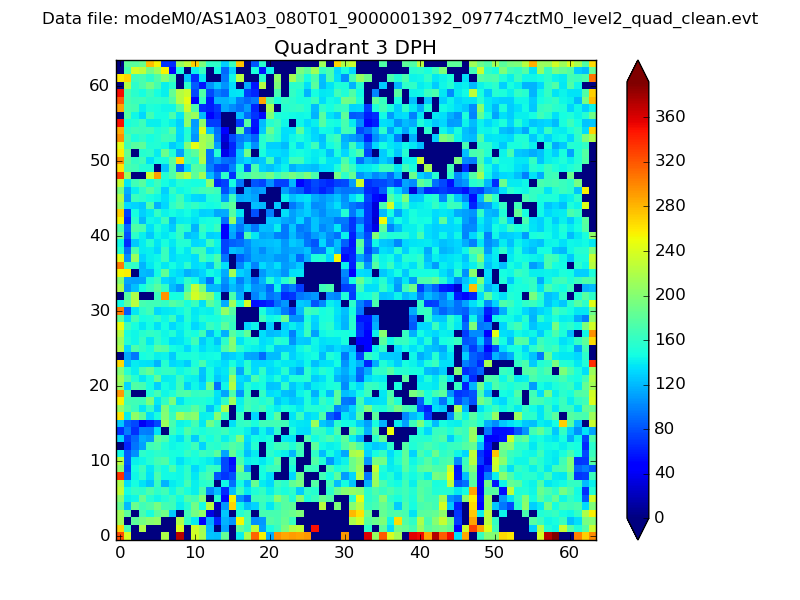 |
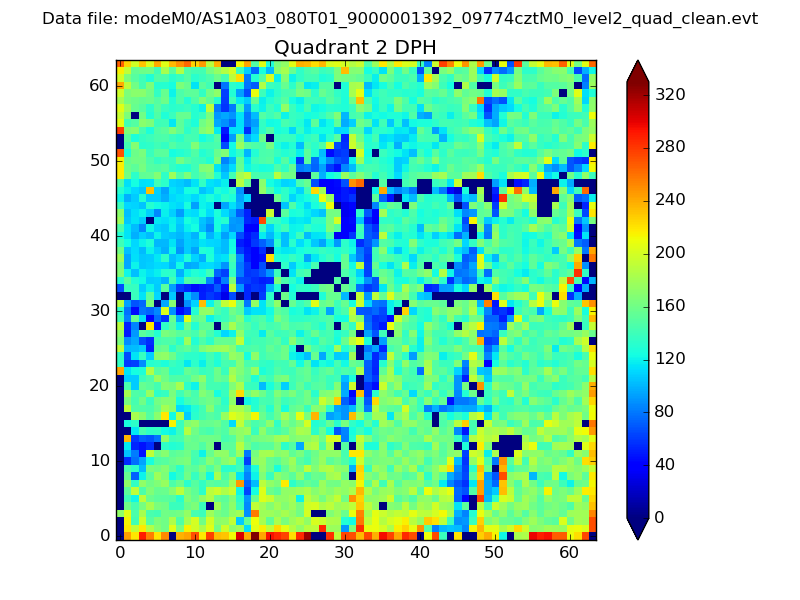 |
Quadrant C |
| Plot type | Count rate plots | Images |
|---|---|---|
| Comparison with Poisson distribution Blue bars denote a histogram of data divided into 1 sec bins. Red curve is a Poisson curve with rate = median count rate of data. |
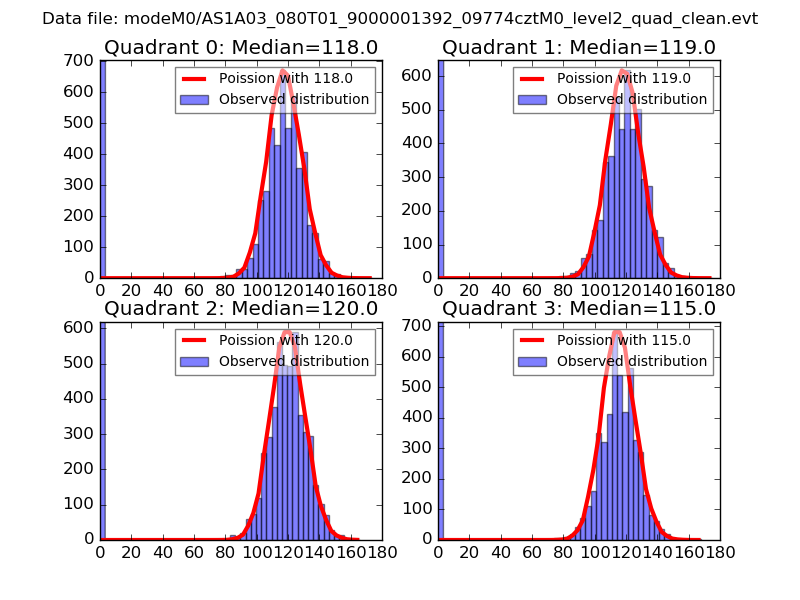 |
 |
| Quadrant-wise count rates Data is divided into 100 sec bins |
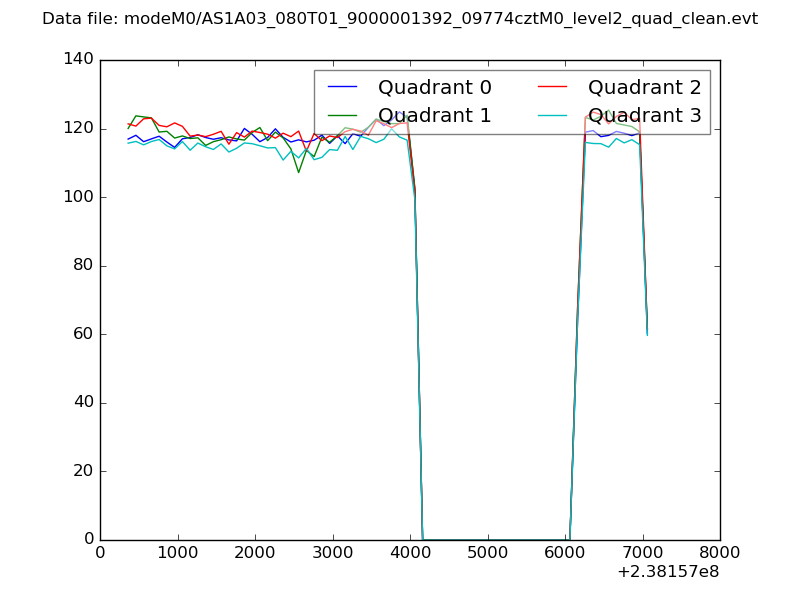 |
|
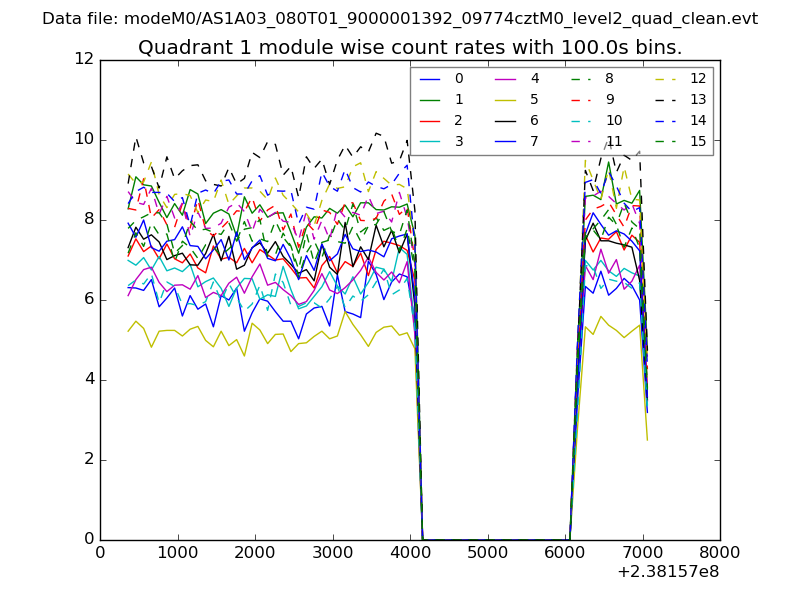
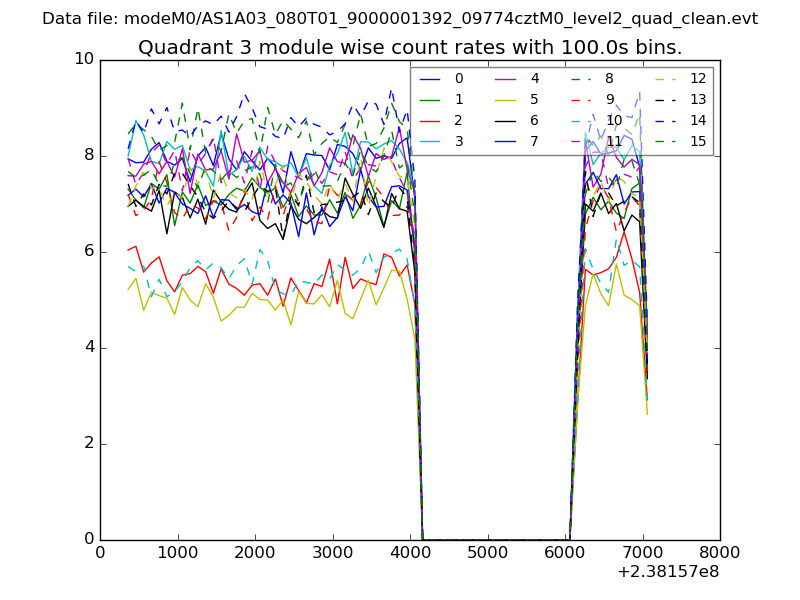
| Module-wise count rates for Quadrant A Data is divided into 100 sec bins |
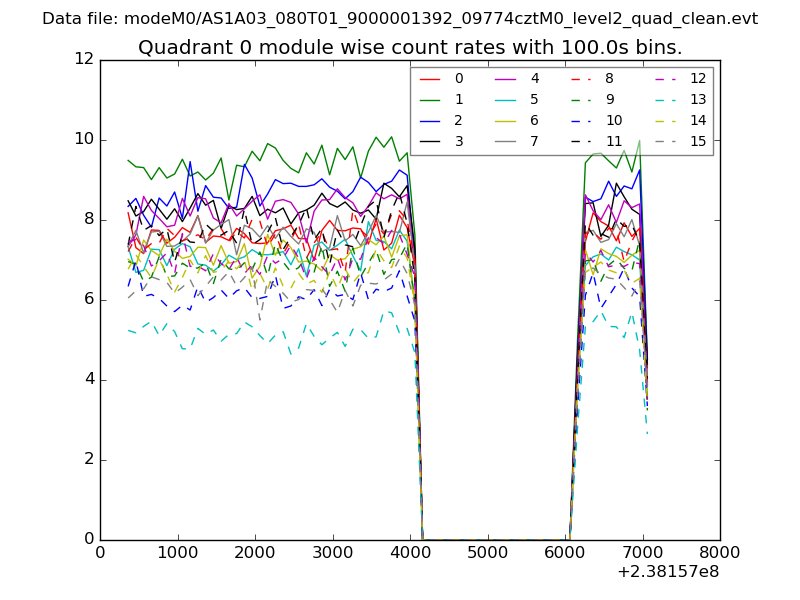 |
 |
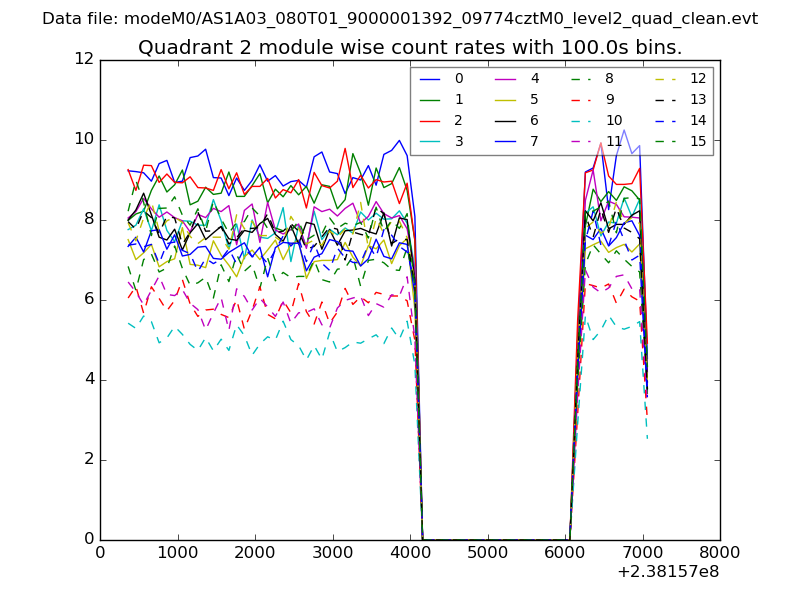
| Module-wise count rates for Quadrant B Data is divided into 100 sec bins |
 |
 |
| Module-wise count rates for Quadrant C Data is divided into 100 sec bins |
 |
 |
| Module-wise count rates for Quadrant D Data is divided into 100 sec bins |
 |
 |
| Parameter | Plot |
|---|---|
| CZT HV Monitor | 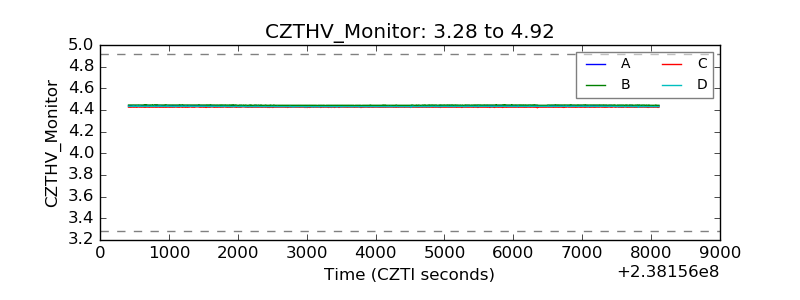 |
| D_VDD |  |
| Temperature 1 | 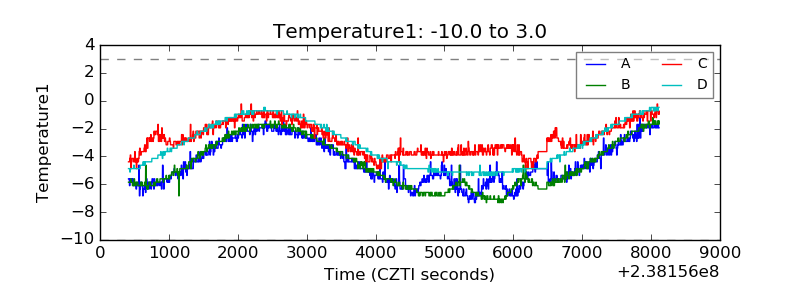 |
| Veto HV Monitor | 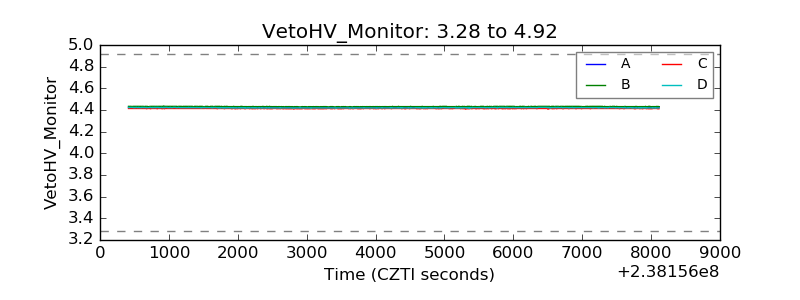 |
| Veto LLD | 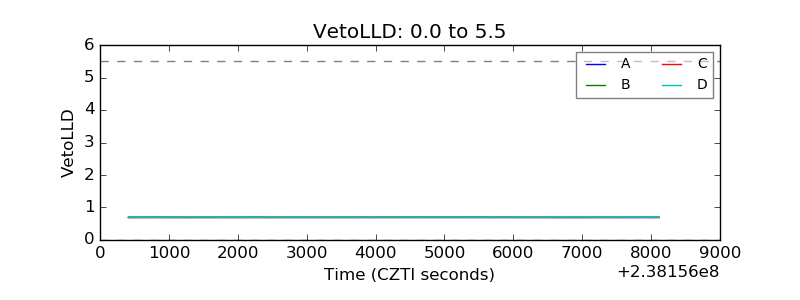 |
| Alpha Counter | 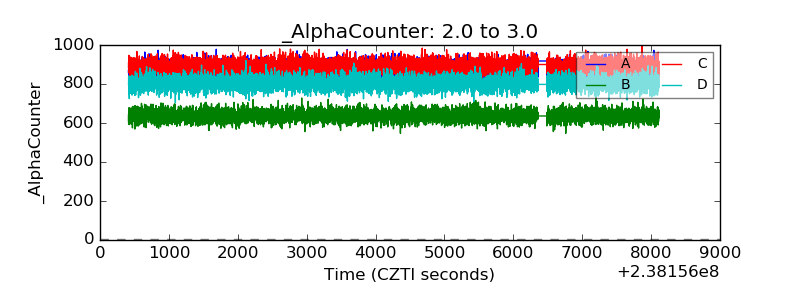 |
| _CPM_Rate | 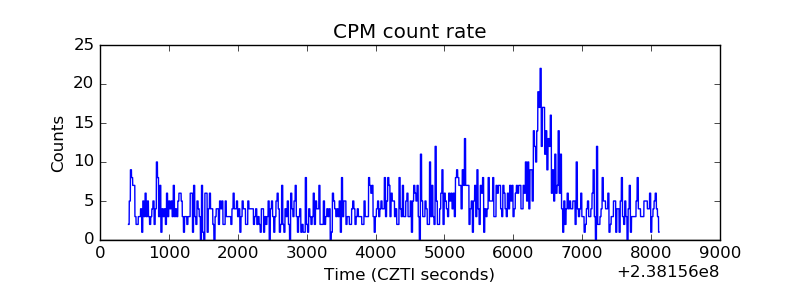 |
| CZT Counter | 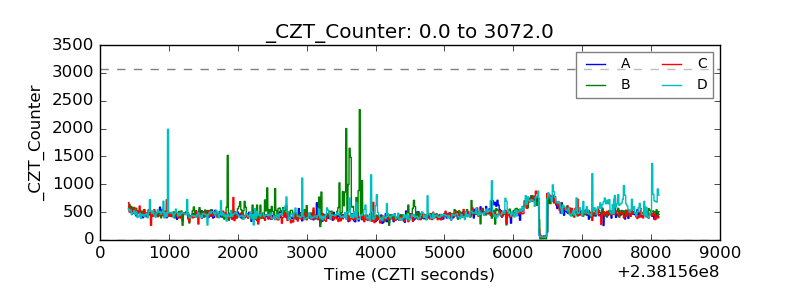 |
| +2.5 Volts monitor | 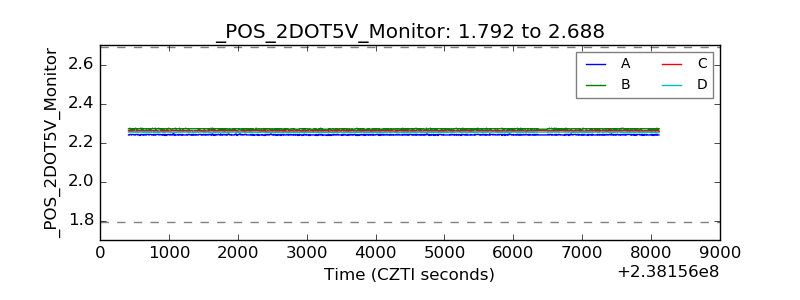 |
| +5 Volts monitor |  |
| _ROLL_ROT | 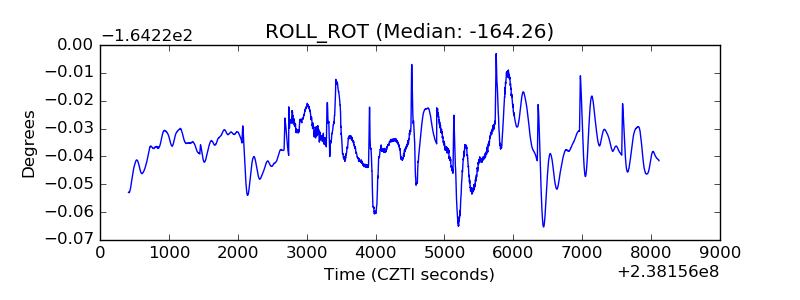 |
| _Roll_DEC | 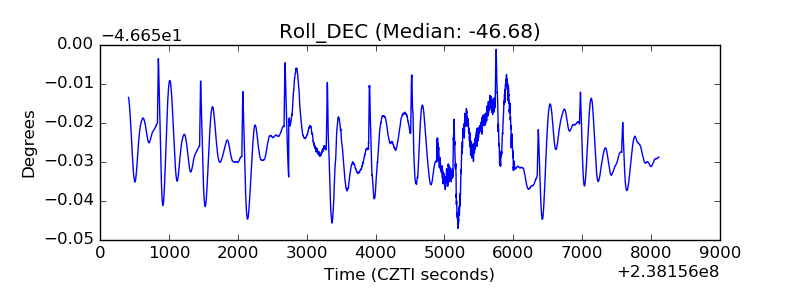 |
| _Roll_RA | 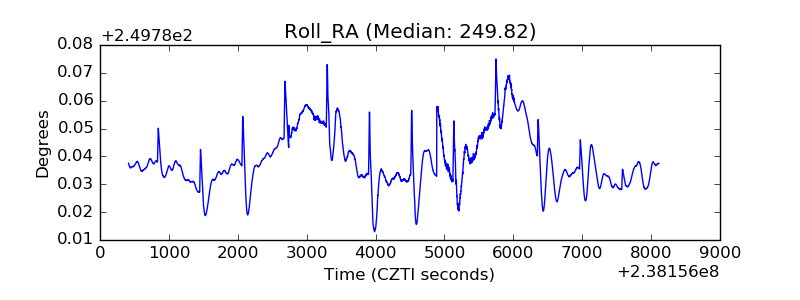 |
| Veto Counter | 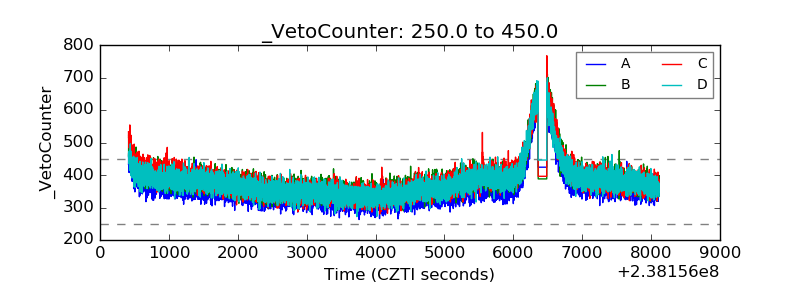 |