| Param | Original file | Final file |
|---|---|---|
| Filename | modeM0/AS1A03_080T01_9000001392_09775cztM0_level2.evt | modeM0/AS1A03_080T01_9000001392_09775cztM0_level2_quad_clean.evt |
| Size (bytes) | 491,616,000 | 93,827,520 |
| Size | 468.8 MB | 89.5 MB |
| Events in quadrant A | 3,125,359 | 594,250 |
| Events in quadrant B | 3,438,830 | 598,379 |
| Events in quadrant C | 3,101,285 | 600,190 |
| Events in quadrant D | 4,755,769 | 569,205 |
| Mode M0 | |||
|---|---|---|---|
| Quadrant | BADHDUFLAG | Total packets | Discarded packets |
| A | 0 | 14091 | 8 |
| B | 0 | 14679 | 3 |
| C | 0 | 14085 | 5 |
| D | 0 | 18726 | 4 |
| Mode M9 | |||
|---|---|---|---|
| Quadrant | BADHDUFLAG | Total packets | Discarded packets |
| A | 0 | 2 | 0 |
| B | 0 | 2 | 0 |
| C | 0 | 2 | 0 |
| D | 0 | 2 | 0 |
| Mode SS | |||
|---|---|---|---|
| Quadrant | BADHDUFLAG | Total packets | Discarded packets |
| A | 0 | 140 | 0 |
| B | 0 | 140 | 0 |
| C | 0 | 140 | 0 |
| D | 0 | 140 | 0 |
| Quadrant | Total seconds | Saturated seconds | Saturation percentage |
|---|---|---|---|
| A | 6877 | 129 | 1.875818% |
| B | 6879 | 151 | 2.195086% |
| C | 6878 | 64 | 0.930503% |
| D | 6879 | 226 | 3.285361% |
Noise dominated data is calculated using 1-second bins in cleaned event files. If a bin has >2000 counts, and if more than 50% of those come from <1% of pixels, then it is considered to be noise-dominated and hence unusable.
| Quadrant | # 1 sec bins | Bins with >0 counts | Bins with >2000 counts | High rate bins dominated by noise | Noise dominated (total time) | Noise dominated (detector-on time) | Marked lightcurve |
|---|---|---|---|---|---|---|---|
| A | 7105 | 6881 | 0 | 0 | 0.00% | 0.00% |  |
| B | 7105 | 6881 | 9 | 9 | 0.13% | 0.13% |  |
| C | 7105 | 6881 | 0 | 0 | 0.00% | 0.00% |  |
| D | 7105 | 6881 | 93 | 93 | 1.31% | 1.35% |  |
Top three noisy pixels from each quadrant. If the there are fewer than three noisy pixels in the level2.evt file, extra rows are filled as -1
| Pixel properties | Quadrant properties | ||||||
|---|---|---|---|---|---|---|---|
| Quadrant | DetID | PixID | Counts | Sigma | Mean | Median | Sigma |
| A | 15 | 239 | 7635 | 41.26 | 809 | 792 | 165.9 |
| A | 0 | 226 | 7565 | 40.84 | 809 | 792 | 165.9 |
| A | 12 | 194 | 6898 | 36.82 | 809 | 792 | 165.9 |
| B | 0 | 214 | 78337 | 496.7 | 812 | 793 | 156.1 |
| B | 4 | 239 | 73933 | 468.49 | 812 | 793 | 156.1 |
| B | 4 | 48 | 28591 | 178.06 | 812 | 793 | 156.1 |
| C | 8 | 128 | 9589 | 47.79 | 788 | 791 | 184.1 |
| C | 13 | 61 | 5984 | 28.21 | 788 | 791 | 184.1 |
| C | 8 | 112 | 5855 | 27.51 | 788 | 791 | 184.1 |
| D | 1 | 52 | 477297 | 2513.06 | 777 | 755 | 189.6 |
| D | 7 | 46 | 420898 | 2215.64 | 777 | 755 | 189.6 |
| D | 8 | 195 | 281653 | 1481.33 | 777 | 755 | 189.6 |
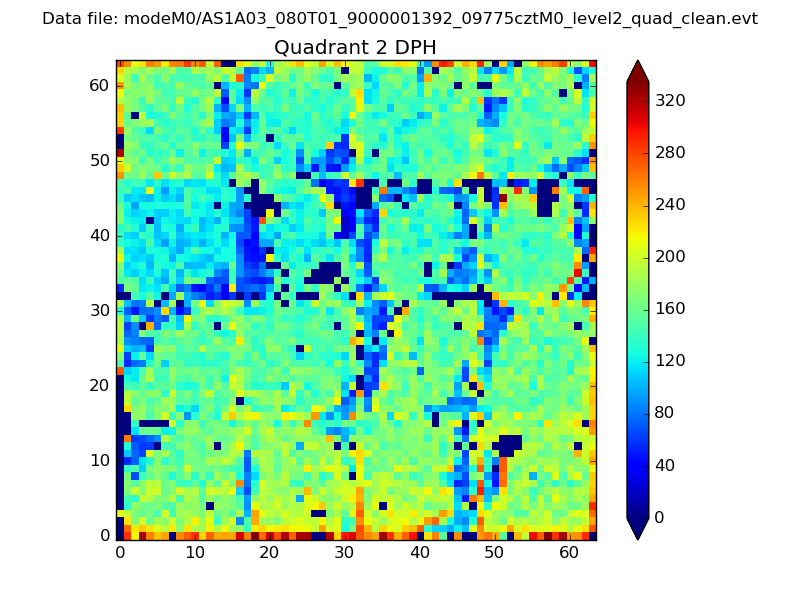
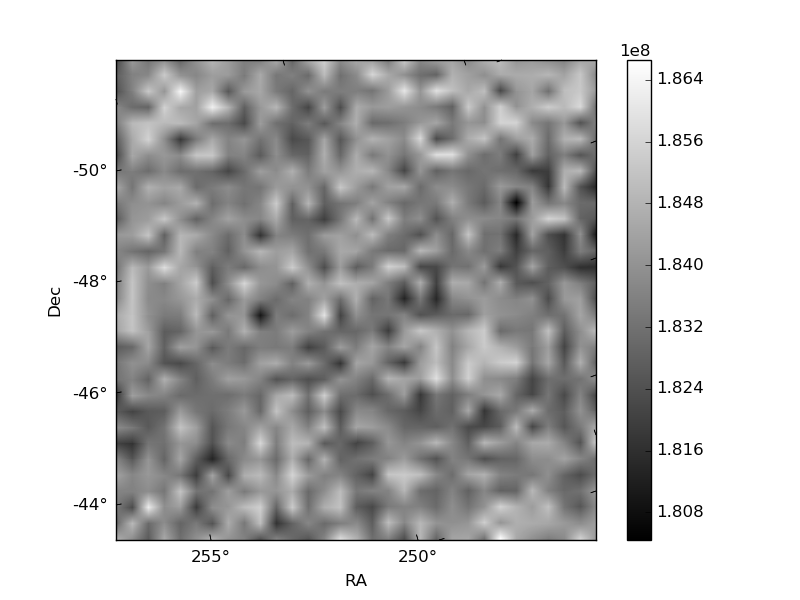
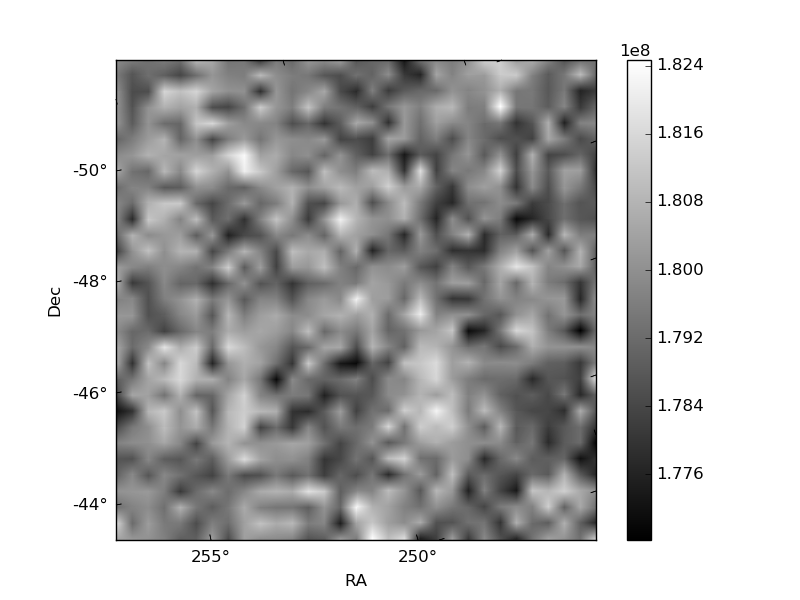
Histogram calculated using DETX and DETY for each event in the final _common_clean file
| Quadrant A | 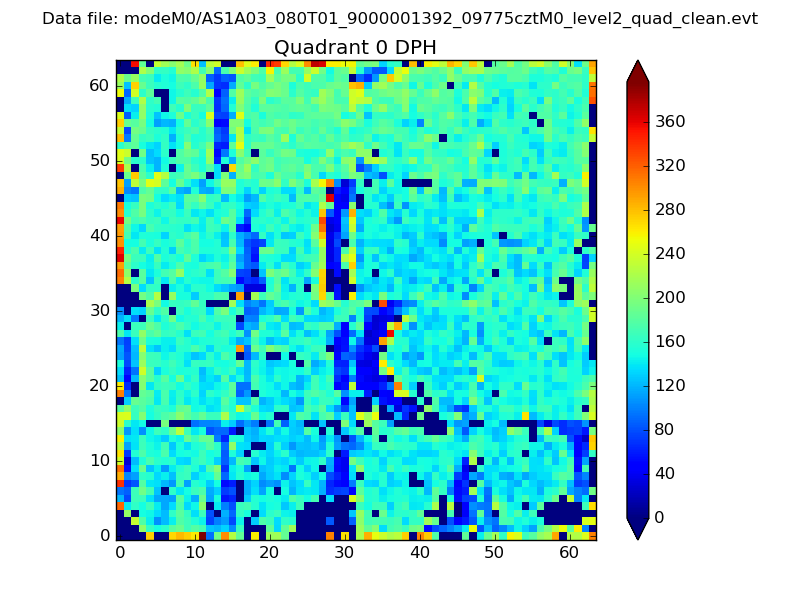 |
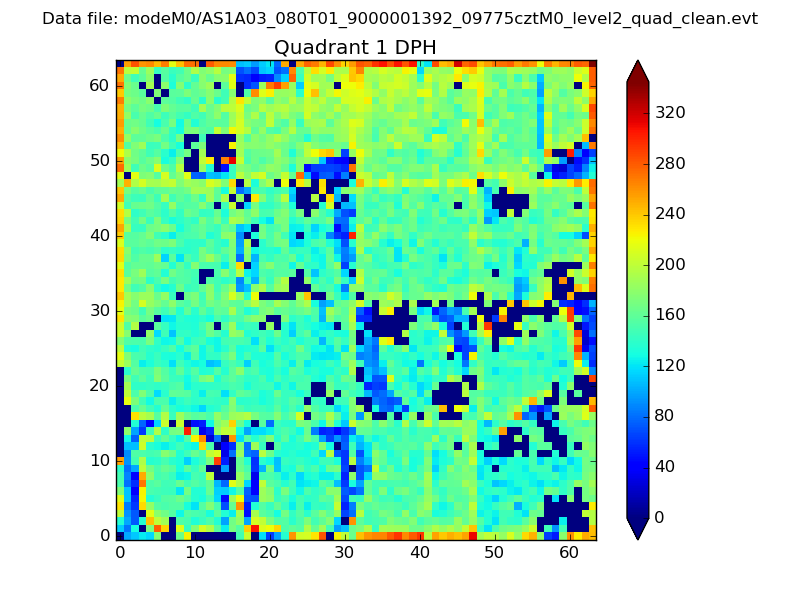 |
Quadrant B |
|---|---|---|---|
| Quadrant D | 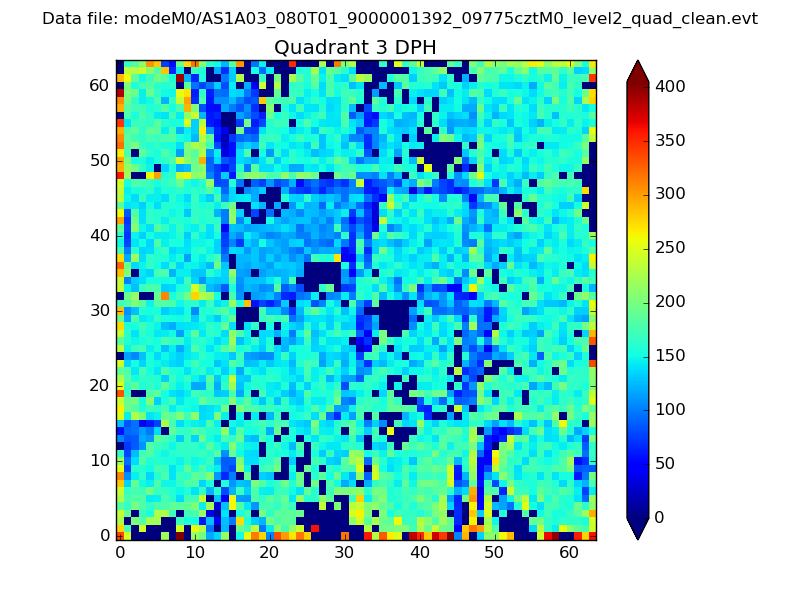 |
 |
Quadrant C |
| Plot type | Count rate plots | Images |
|---|---|---|
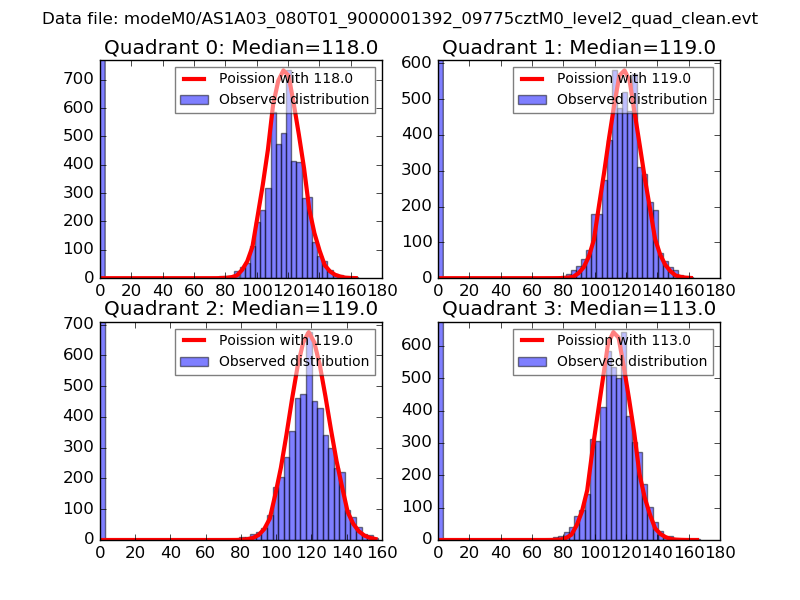
| Comparison with Poisson distribution Blue bars denote a histogram of data divided into 1 sec bins. Red curve is a Poisson curve with rate = median count rate of data. |
 |
 |
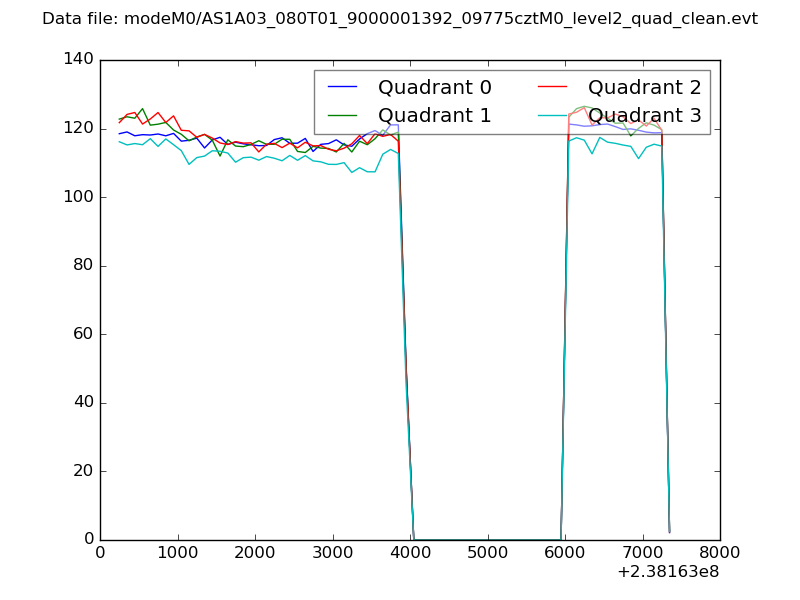
| Quadrant-wise count rates Data is divided into 100 sec bins |
 |
|
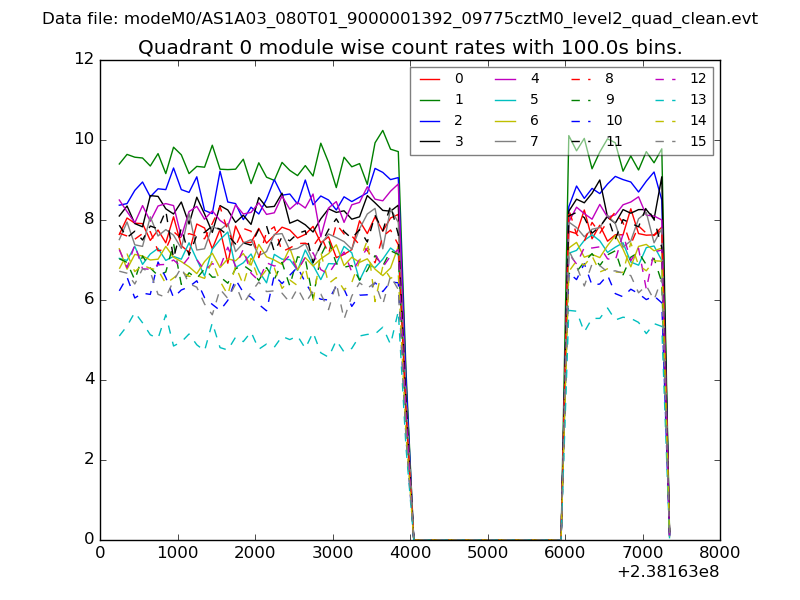
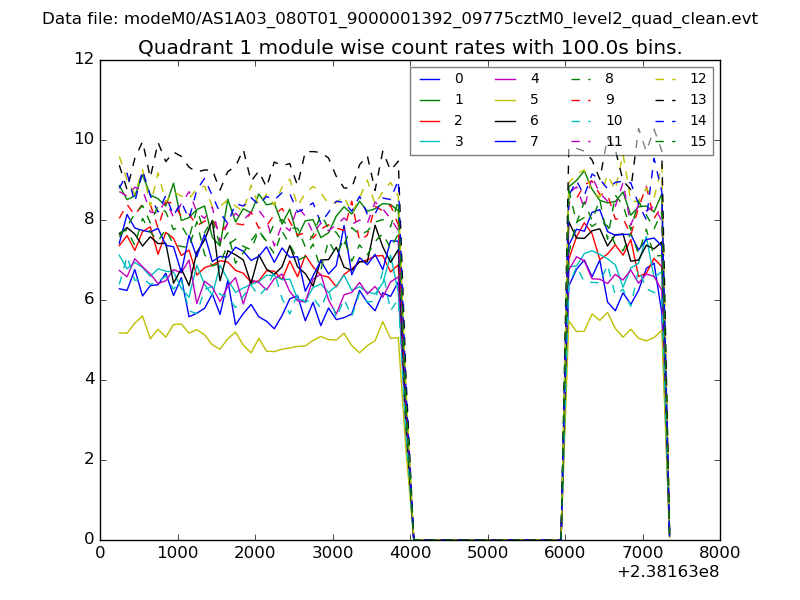
| Module-wise count rates for Quadrant A Data is divided into 100 sec bins |
 |
 |
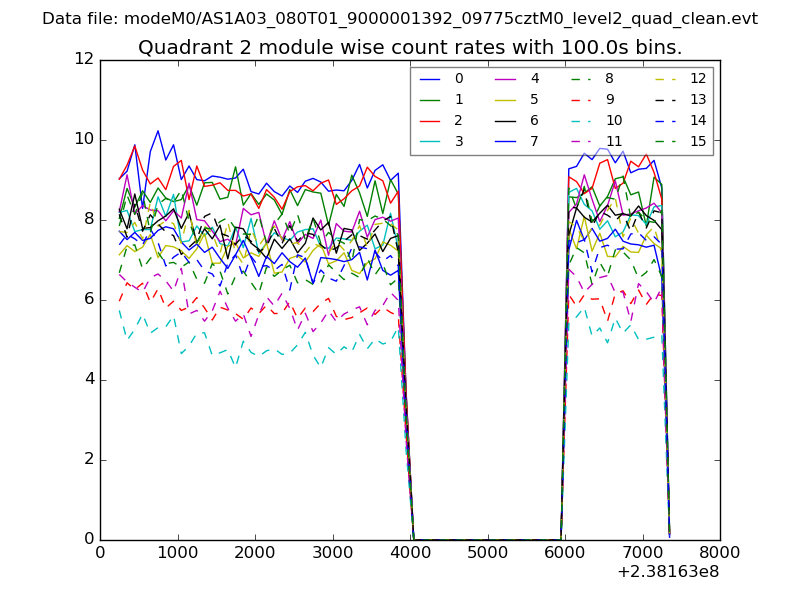
| Module-wise count rates for Quadrant B Data is divided into 100 sec bins |
 |
 |
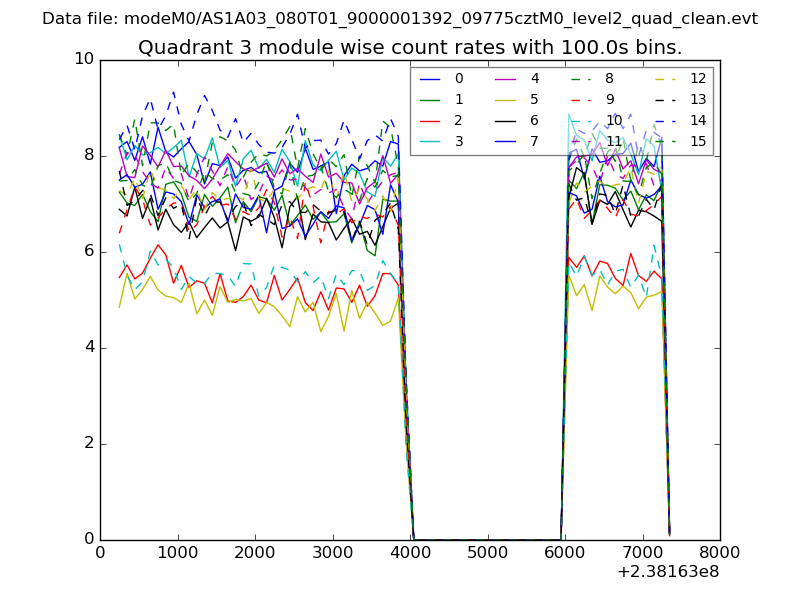
| Module-wise count rates for Quadrant C Data is divided into 100 sec bins |
 |
 |
| Module-wise count rates for Quadrant D Data is divided into 100 sec bins |
 |
 |
| Parameter | Plot |
|---|---|
| CZT HV Monitor | 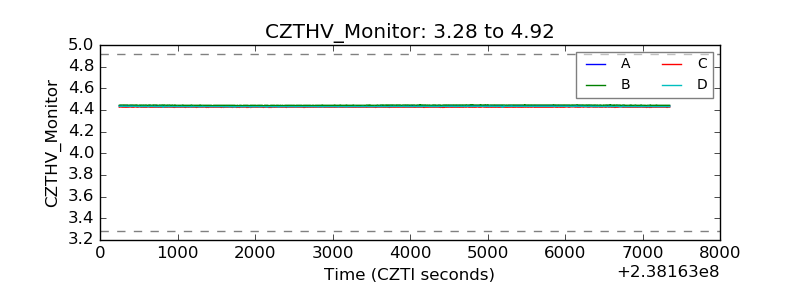 |
| D_VDD | 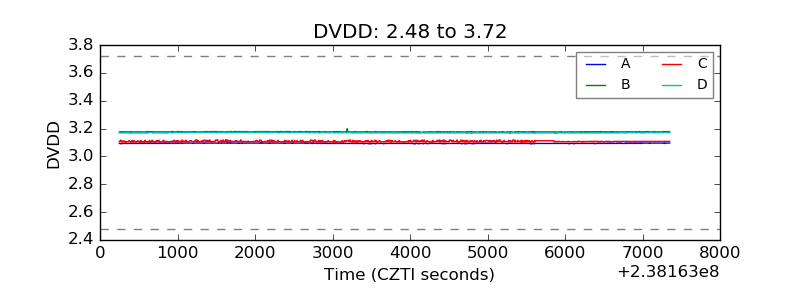 |
| Temperature 1 | 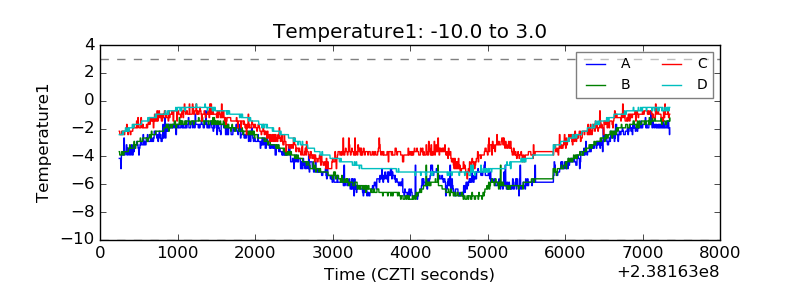 |
| Veto HV Monitor | 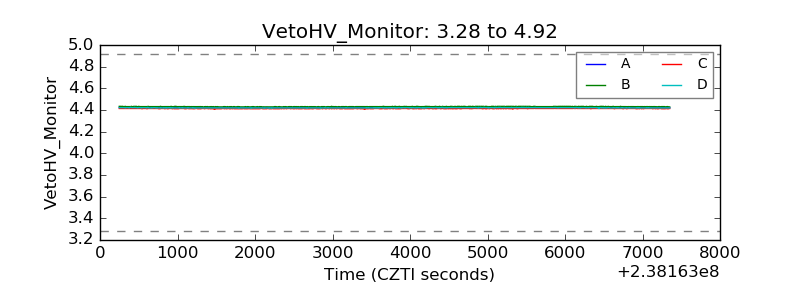 |
| Veto LLD | 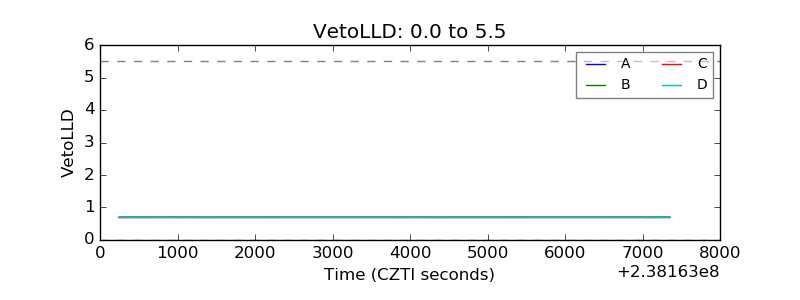 |
| Alpha Counter | 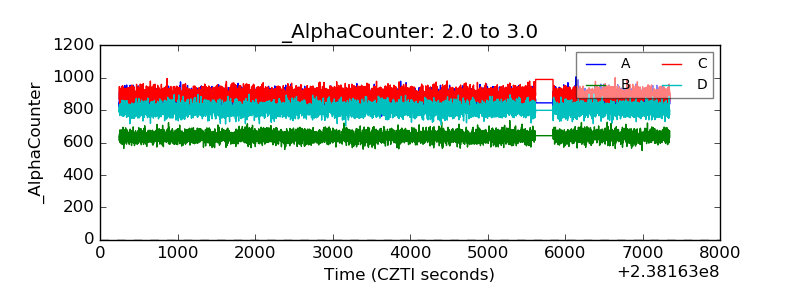 |
| _CPM_Rate | 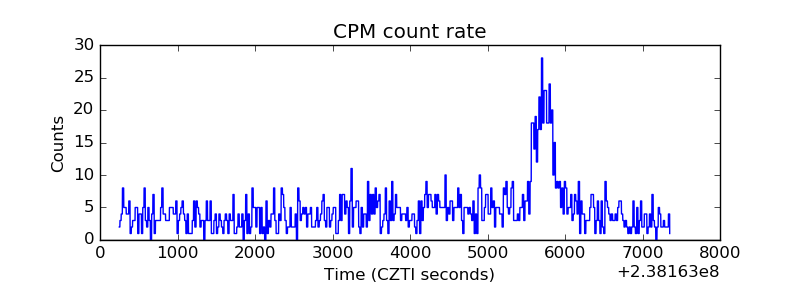 |
| CZT Counter | 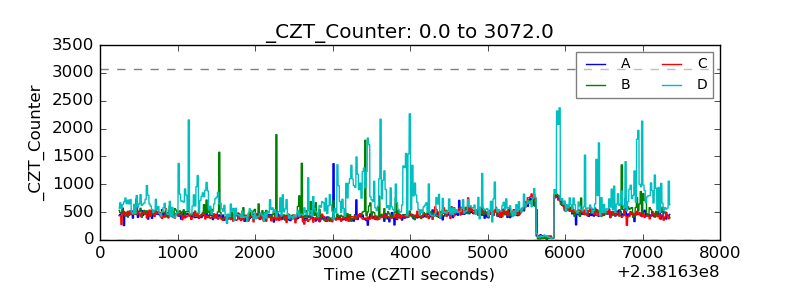 |
| +2.5 Volts monitor | 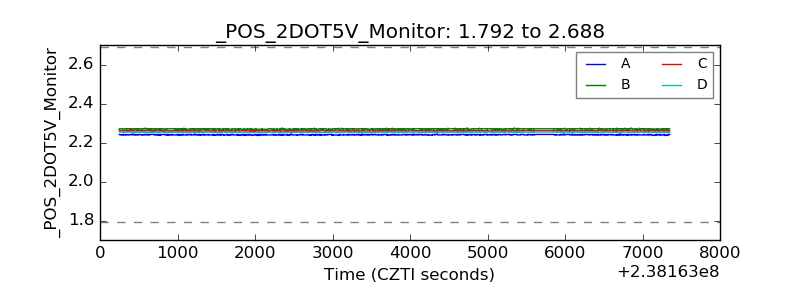 |
| +5 Volts monitor | 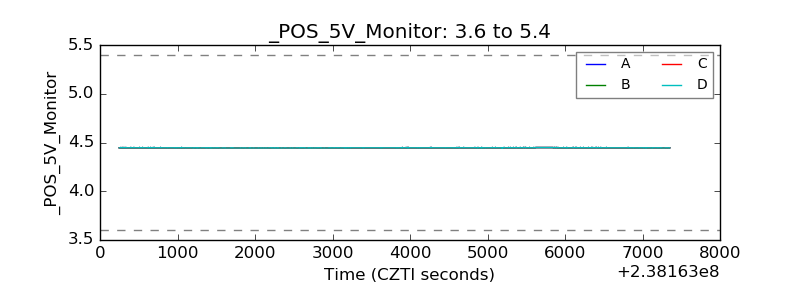 |
| _ROLL_ROT | 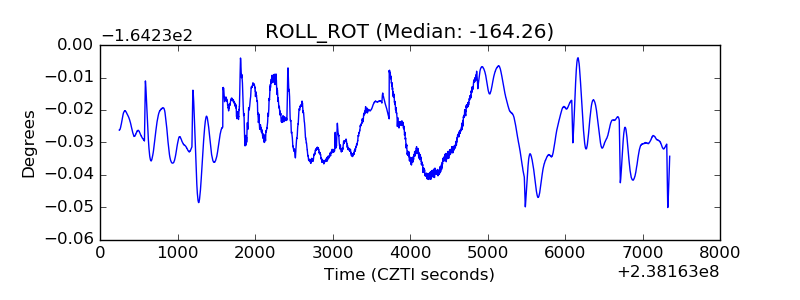 |
| _Roll_DEC | 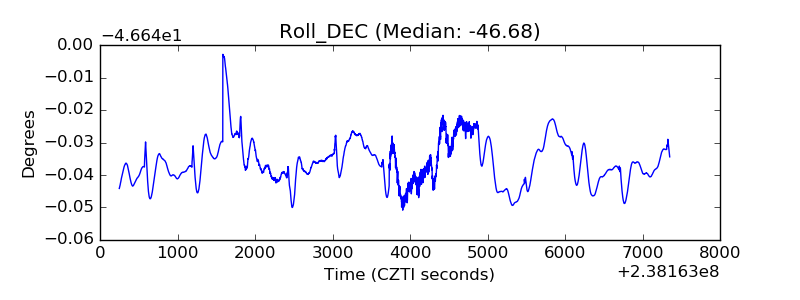 |
| _Roll_RA | 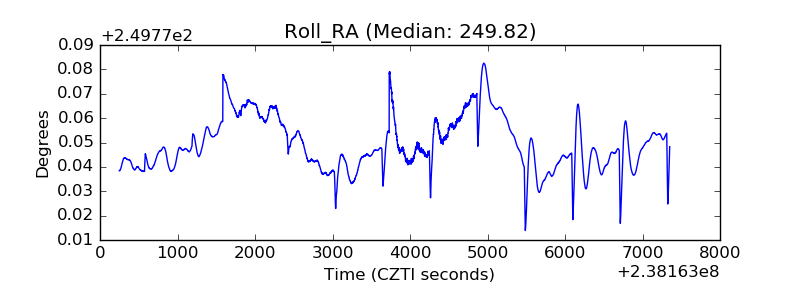 |
| Veto Counter | 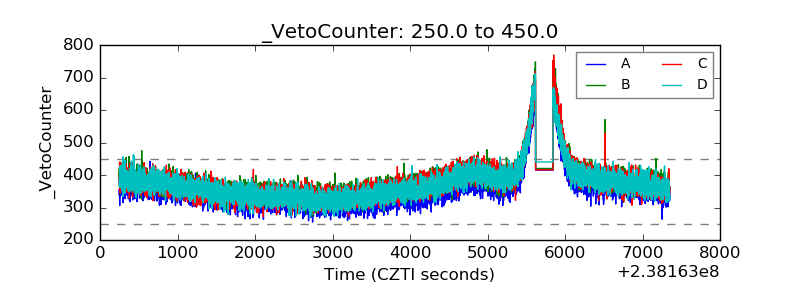 |