| Param | Original file | Final file |
|---|---|---|
| Filename | modeM0/AS1A03_080T01_9000001392_09778cztM0_level2.evt | modeM0/AS1A03_080T01_9000001392_09778cztM0_level2_quad_clean.evt |
| Size (bytes) | 1,131,606,720 | 212,103,360 |
| Size | 1.1 GB | 202.3 MB |
| Events in quadrant A | 7,629,327 | 1,333,432 |
| Events in quadrant B | 7,937,838 | 1,332,869 |
| Events in quadrant C | 7,314,944 | 1,330,384 |
| Events in quadrant D | 10,248,459 | 1,266,271 |
| Mode M0 | |||
|---|---|---|---|
| Quadrant | BADHDUFLAG | Total packets | Discarded packets |
| A | 0 | 36384 | 1929 |
| B | 0 | 36804 | 1834 |
| C | 0 | 35932 | 1923 |
| D | 0 | 44625 | 2386 |
| Mode M9 | |||
|---|---|---|---|
| Quadrant | BADHDUFLAG | Total packets | Discarded packets |
| A | 0 | 20 | 0 |
| B | 0 | 20 | 0 |
| C | 0 | 20 | 0 |
| D | 0 | 20 | 0 |
| Mode SS | |||
|---|---|---|---|
| Quadrant | BADHDUFLAG | Total packets | Discarded packets |
| A | 0 | 360 | 18 |
| B | 0 | 359 | 15 |
| C | 0 | 359 | 17 |
| D | 0 | 360 | 20 |
| Quadrant | Total seconds | Saturated seconds | Saturation percentage |
|---|---|---|---|
| A | 16852 | 90 | 0.534061% |
| B | 16882 | 126 | 0.746357% |
| C | 16819 | 29 | 0.172424% |
| D | 16795 | 455 | 2.709140% |
Noise dominated data is calculated using 1-second bins in cleaned event files. If a bin has >2000 counts, and if more than 50% of those come from <1% of pixels, then it is considered to be noise-dominated and hence unusable.
| Quadrant | # 1 sec bins | Bins with >0 counts | Bins with >2000 counts | High rate bins dominated by noise | Noise dominated (total time) | Noise dominated (detector-on time) | Marked lightcurve |
|---|---|---|---|---|---|---|---|
| A | 19719 | 17328 | 1 | 1 | 0.01% | 0.01% | 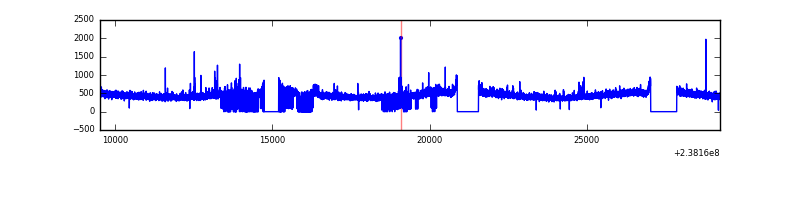 |
| B | 19719 | 17328 | 9 | 9 | 0.05% | 0.05% | 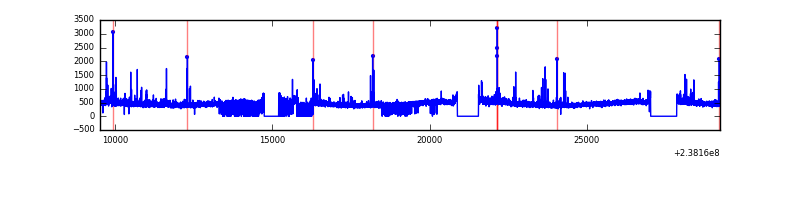 |
| C | 19719 | 17325 | 0 | 0 | 0.00% | 0.00% | 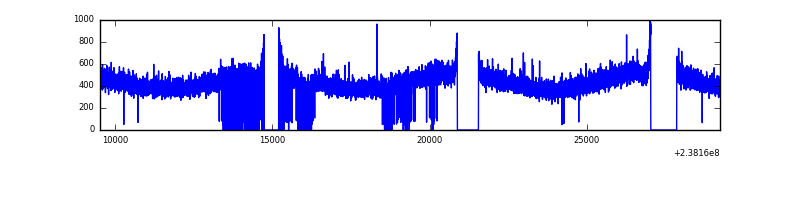 |
| D | 19719 | 17275 | 419 | 419 | 2.12% | 2.43% | 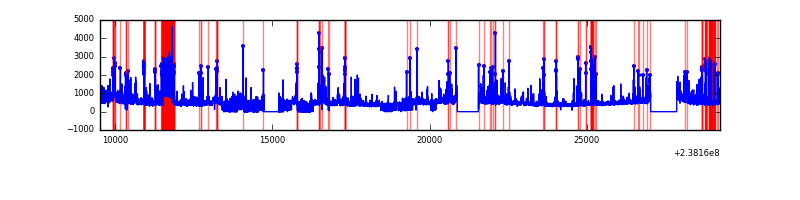 |
Top three noisy pixels from each quadrant. If the there are fewer than three noisy pixels in the level2.evt file, extra rows are filled as -1
| Pixel properties | Quadrant properties | ||||||
|---|---|---|---|---|---|---|---|
| Quadrant | DetID | PixID | Counts | Sigma | Mean | Median | Sigma |
| A | 13 | 251 | 148278 | 369.96 | 1938 | 1896 | 395.7 |
| A | 15 | 239 | 19074 | 43.41 | 1938 | 1896 | 395.7 |
| A | 0 | 226 | 17961 | 40.6 | 1938 | 1896 | 395.7 |
| B | 0 | 229 | 89219 | 234.6 | 1950 | 1904 | 372.2 |
| B | 0 | 214 | 80478 | 211.12 | 1950 | 1904 | 372.2 |
| B | 4 | 239 | 61120 | 159.1 | 1950 | 1904 | 372.2 |
| C | 13 | 61 | 13838 | 27.5 | 1872 | 1879 | 434.9 |
| C | 8 | 222 | 9153 | 16.73 | 1872 | 1879 | 434.9 |
| C | 14 | 128 | 6842 | 11.41 | 1872 | 1879 | 434.9 |
| D | 1 | 52 | 990596 | 2130.53 | 1848 | 1798 | 464.1 |
| D | 13 | 137 | 820407 | 1763.83 | 1848 | 1798 | 464.1 |
| D | 2 | 152 | 448025 | 961.47 | 1848 | 1798 | 464.1 |
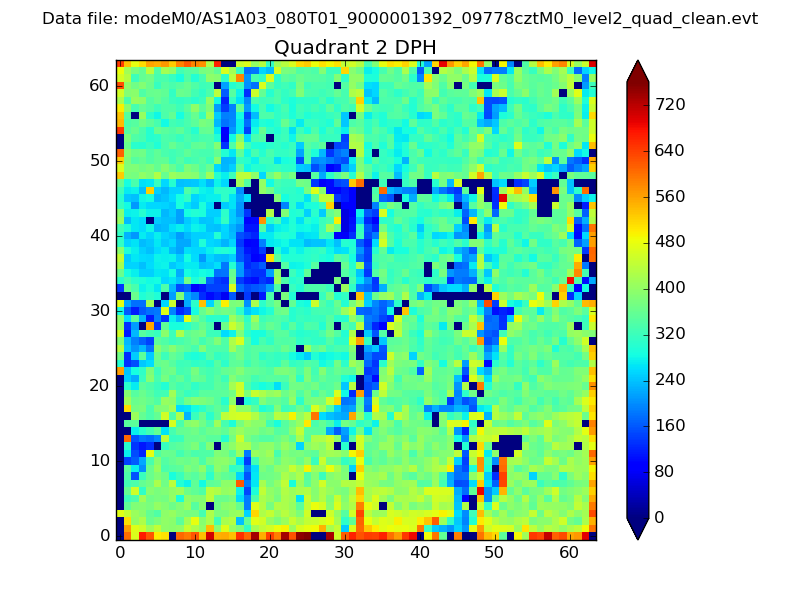
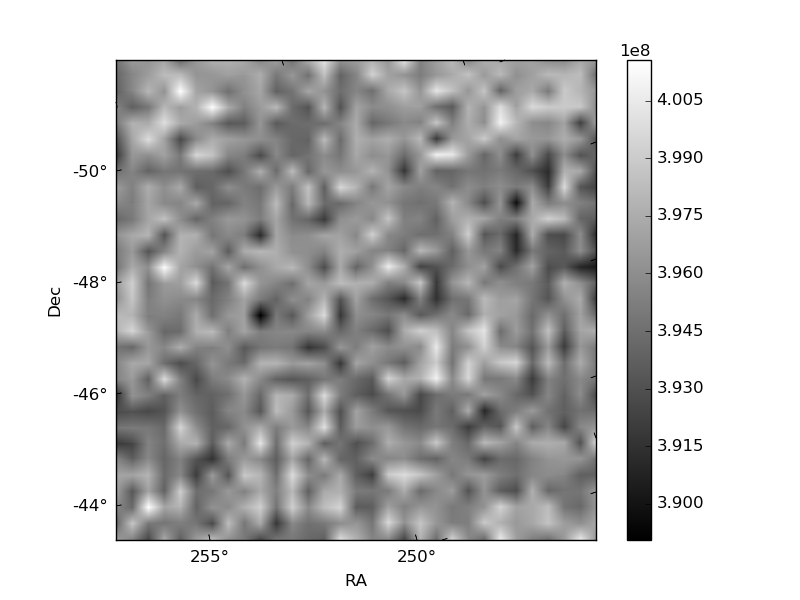
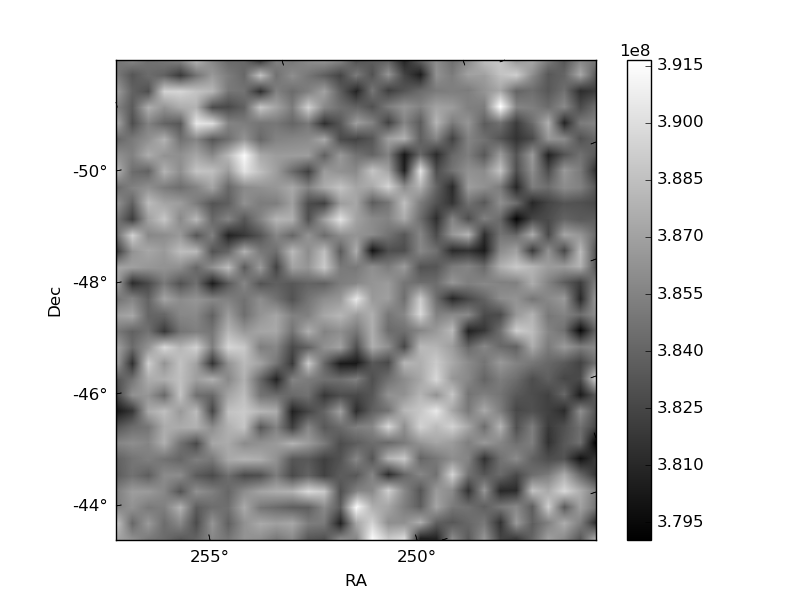
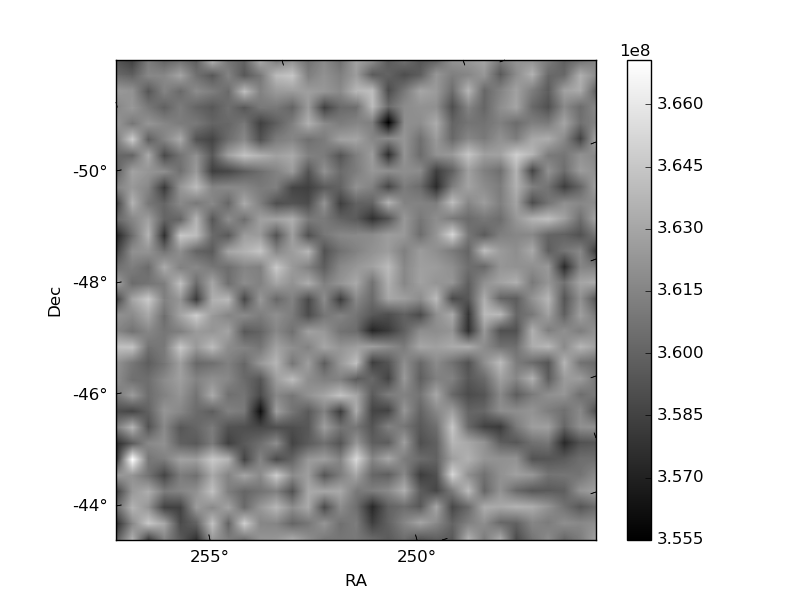
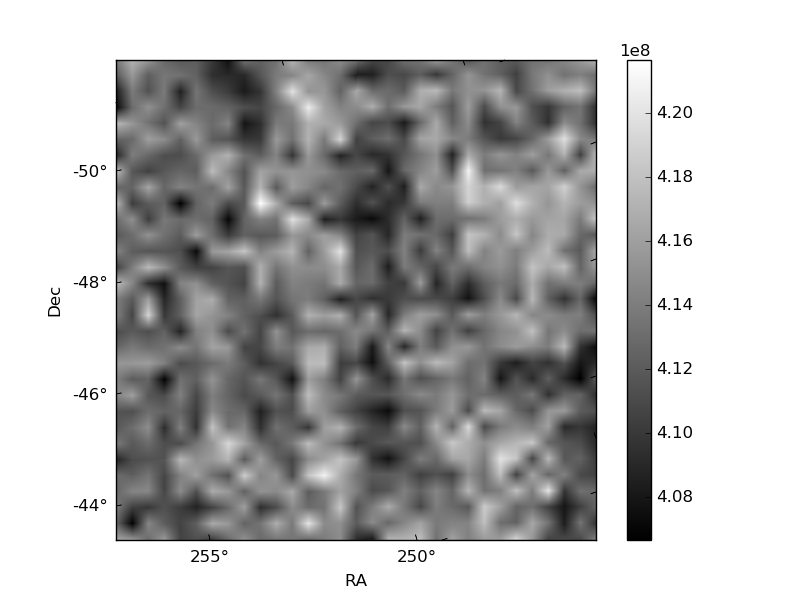
Histogram calculated using DETX and DETY for each event in the final _common_clean file
| Quadrant A | 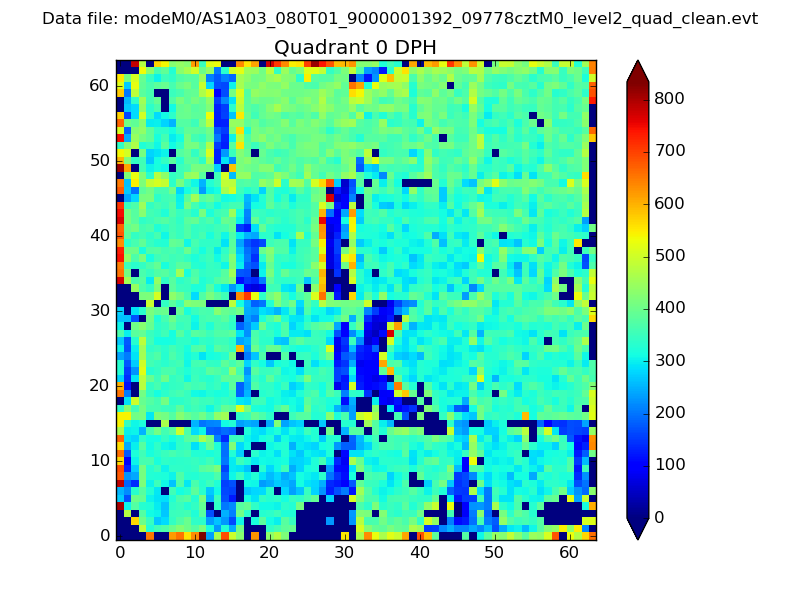 |
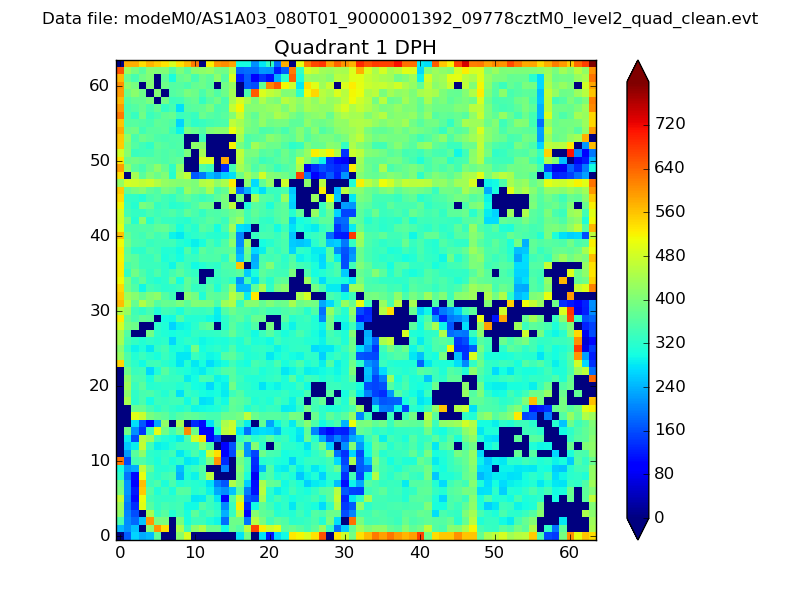 |
Quadrant B |
|---|---|---|---|
| Quadrant D | 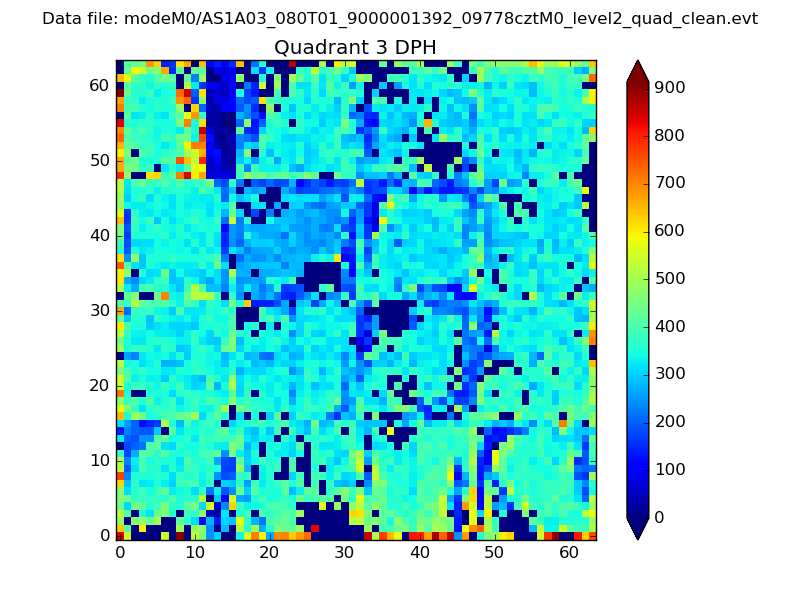 |
 |
Quadrant C |
| Plot type | Count rate plots | Images |
|---|---|---|
| Comparison with Poisson distribution Blue bars denote a histogram of data divided into 1 sec bins. Red curve is a Poisson curve with rate = median count rate of data. |
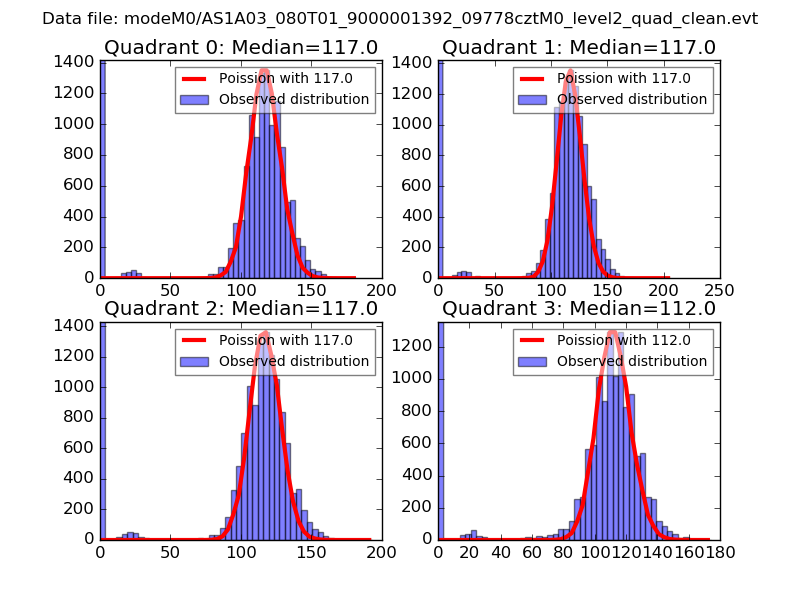 |
 |
| Quadrant-wise count rates Data is divided into 100 sec bins |
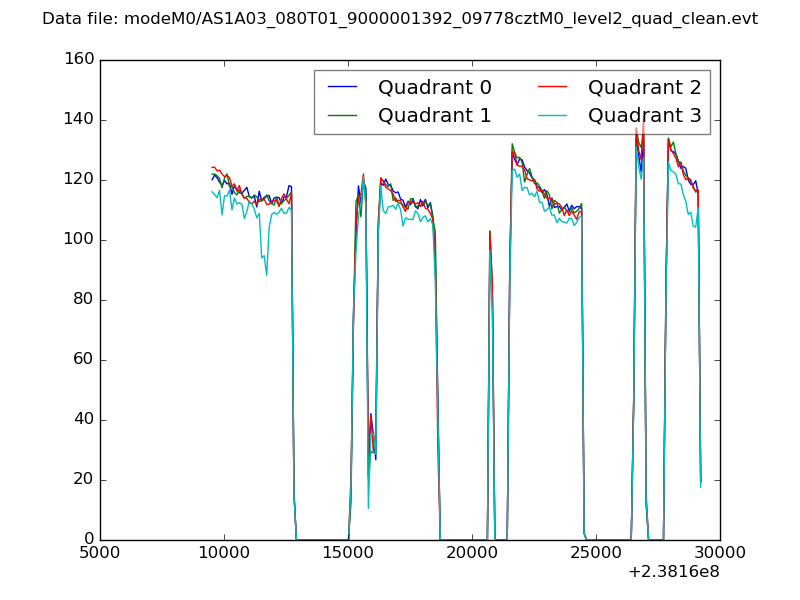 |
|
| Module-wise count rates for Quadrant A Data is divided into 100 sec bins |
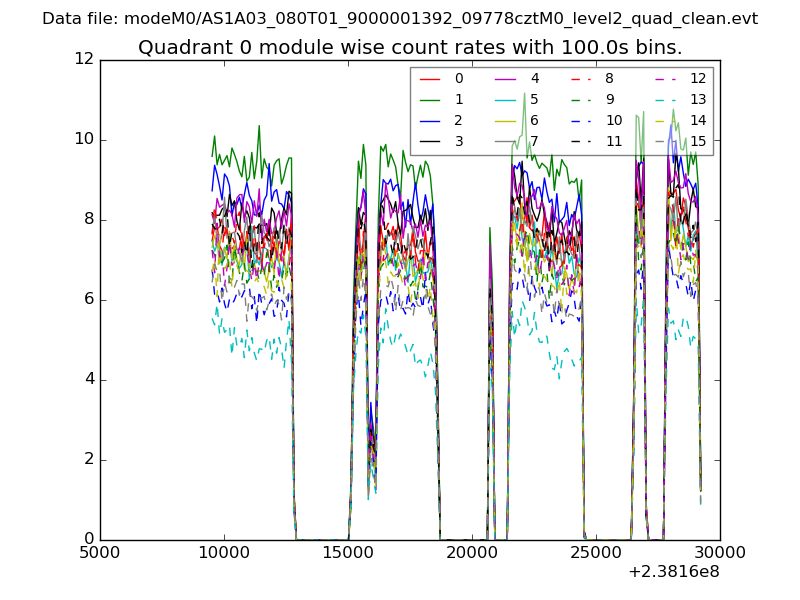 |
 |
| Module-wise count rates for Quadrant B Data is divided into 100 sec bins |
 |
 |
| Module-wise count rates for Quadrant C Data is divided into 100 sec bins |
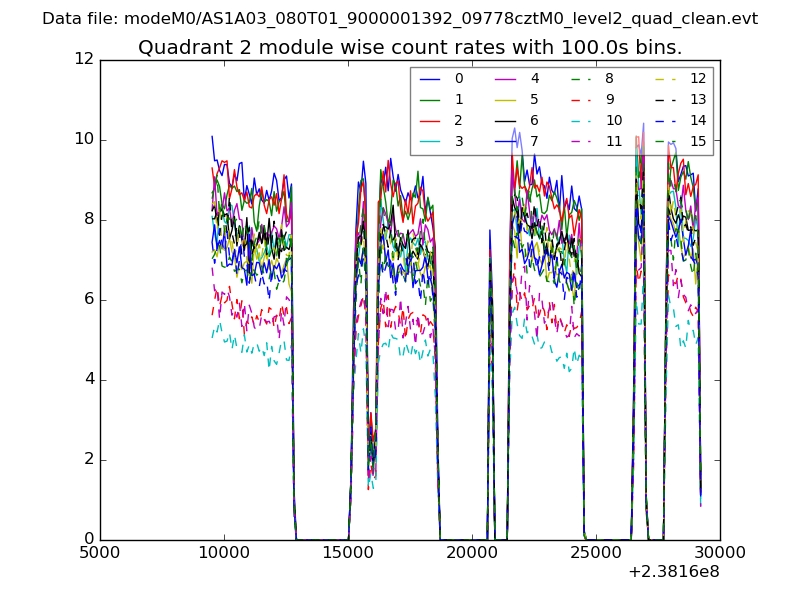 |
 |
| Module-wise count rates for Quadrant D Data is divided into 100 sec bins |
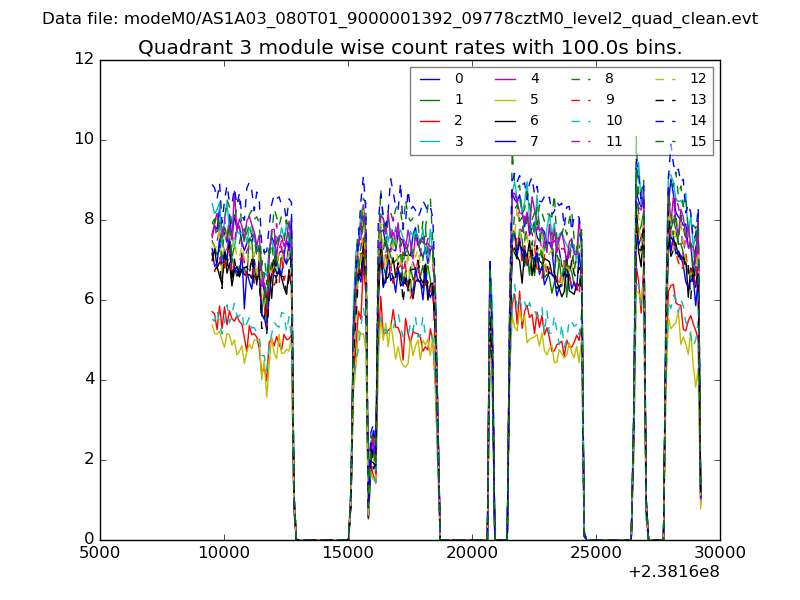 |
 |
| Parameter | Plot |
|---|---|
| CZT HV Monitor | 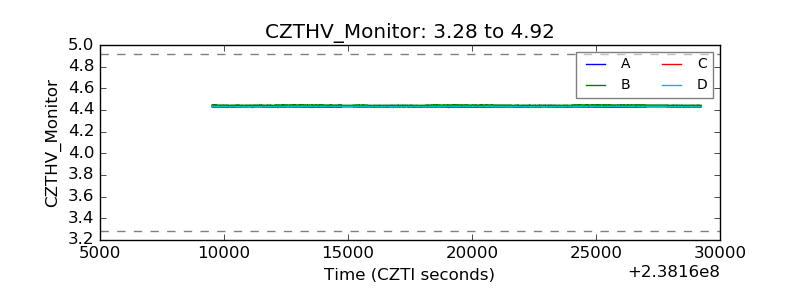 |
| D_VDD | 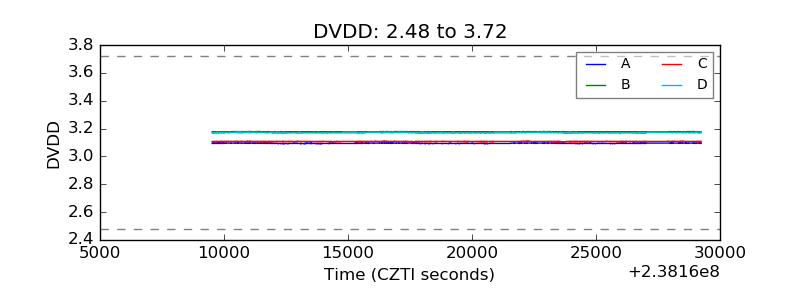 |
| Temperature 1 | 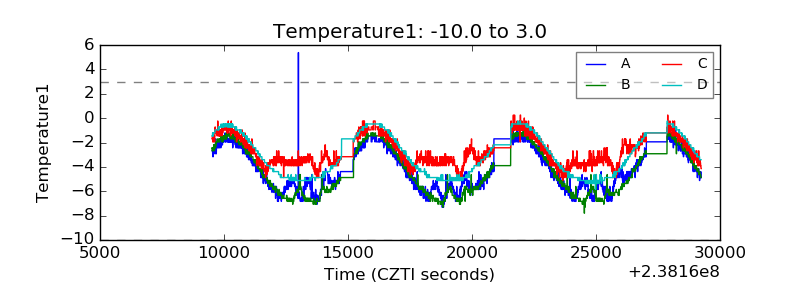 |
| Veto HV Monitor |  |
| Veto LLD | 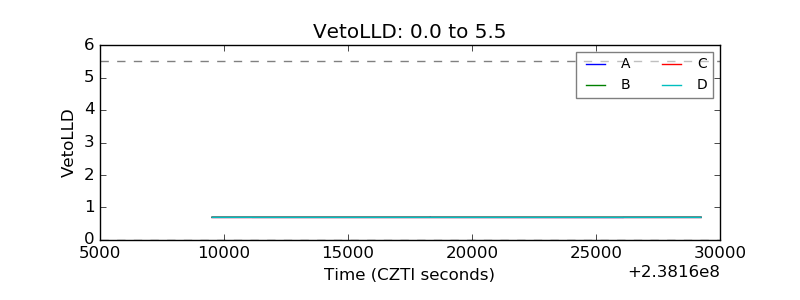 |
| Alpha Counter | 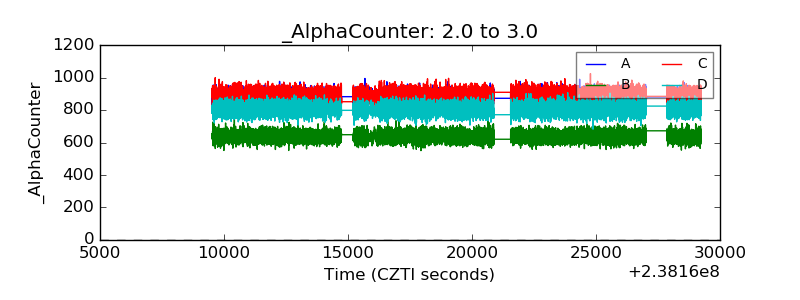 |
| _CPM_Rate | 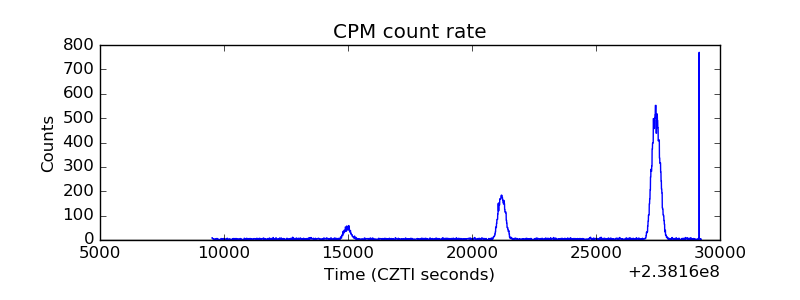 |
| CZT Counter | 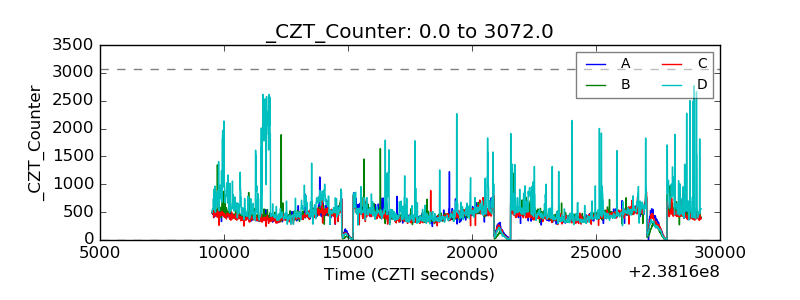 |
| +2.5 Volts monitor |  |
| +5 Volts monitor |  |
| _ROLL_ROT | 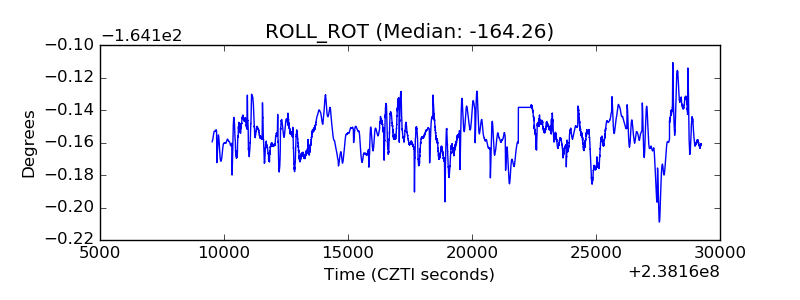 |
| _Roll_DEC | 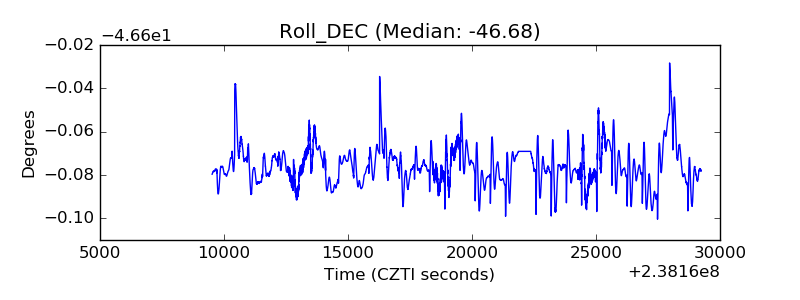 |
| _Roll_RA |  |
| Veto Counter | 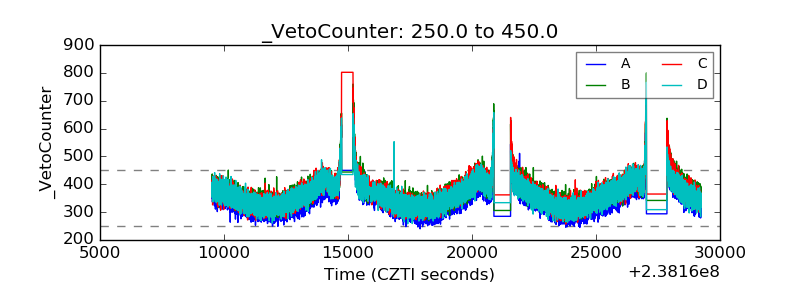 |