| Param | Original file | Final file |
|---|---|---|
| Filename | modeM0/AS1A03_080T01_9000001392_09779cztM0_level2.evt | modeM0/AS1A03_080T01_9000001392_09779cztM0_level2_quad_clean.evt |
| Size (bytes) | 504,008,640 | 90,316,800 |
| Size | 480.7 MB | 86.1 MB |
| Events in quadrant A | 3,044,977 | 578,895 |
| Events in quadrant B | 3,266,221 | 578,609 |
| Events in quadrant C | 2,919,669 | 576,071 |
| Events in quadrant D | 5,581,556 | 538,117 |
| Mode M0 | |||
|---|---|---|---|
| Quadrant | BADHDUFLAG | Total packets | Discarded packets |
| A | 0 | 13839 | 129 |
| B | 0 | 14357 | 188 |
| C | 0 | 13608 | 160 |
| D | 0 | 21676 | 638 |
| Mode M9 | |||
|---|---|---|---|
| Quadrant | BADHDUFLAG | Total packets | Discarded packets |
| A | 0 | 17 | 0 |
| B | 0 | 17 | 0 |
| C | 0 | 17 | 0 |
| D | 0 | 17 | 0 |
| Mode SS | |||
|---|---|---|---|
| Quadrant | BADHDUFLAG | Total packets | Discarded packets |
| A | 0 | 136 | 2 |
| B | 0 | 136 | 2 |
| C | 0 | 136 | 0 |
| D | 0 | 136 | 2 |
| Quadrant | Total seconds | Saturated seconds | Saturation percentage |
|---|---|---|---|
| A | 6672 | 35 | 0.524580% |
| B | 6651 | 54 | 0.811908% |
| C | 6656 | 11 | 0.165264% |
| D | 6606 | 695 | 10.520739% |
Noise dominated data is calculated using 1-second bins in cleaned event files. If a bin has >2000 counts, and if more than 50% of those come from <1% of pixels, then it is considered to be noise-dominated and hence unusable.
| Quadrant | # 1 sec bins | Bins with >0 counts | Bins with >2000 counts | High rate bins dominated by noise | Noise dominated (total time) | Noise dominated (detector-on time) | Marked lightcurve |
|---|---|---|---|---|---|---|---|
| A | 7697 | 6726 | 0 | 0 | 0.00% | 0.00% | 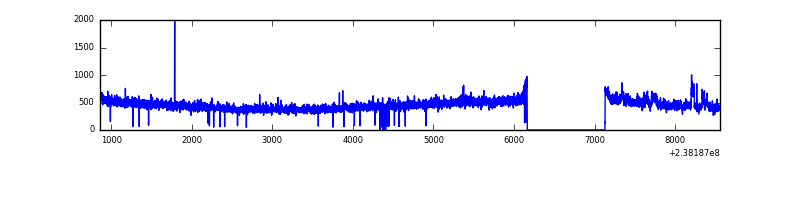 |
| B | 7697 | 6717 | 16 | 16 | 0.21% | 0.24% | 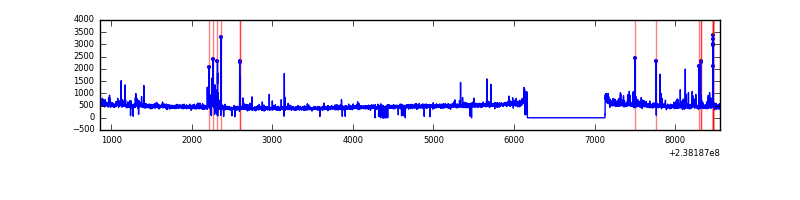 |
| C | 7697 | 6724 | 0 | 0 | 0.00% | 0.00% | 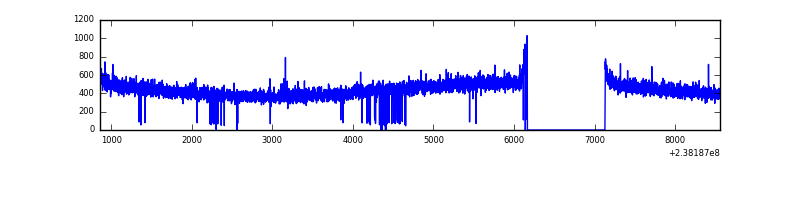 |
| D | 7697 | 6693 | 733 | 733 | 9.52% | 10.95% | 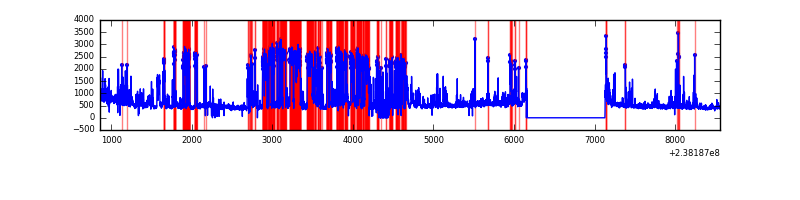 |
Top three noisy pixels from each quadrant. If the there are fewer than three noisy pixels in the level2.evt file, extra rows are filled as -1
| Pixel properties | Quadrant properties | ||||||
|---|---|---|---|---|---|---|---|
| Quadrant | DetID | PixID | Counts | Sigma | Mean | Median | Sigma |
| A | 14 | 111 | 33805 | 208.49 | 775 | 758 | 158.5 |
| A | 13 | 248 | 8644 | 49.75 | 775 | 758 | 158.5 |
| A | 13 | 251 | 8545 | 49.13 | 775 | 758 | 158.5 |
| B | 4 | 239 | 68356 | 449.65 | 777 | 759 | 150.3 |
| B | 4 | 81 | 67368 | 443.08 | 777 | 759 | 150.3 |
| B | 0 | 229 | 58918 | 386.87 | 777 | 759 | 150.3 |
| C | 13 | 61 | 5638 | 28.05 | 746 | 749 | 174.3 |
| C | 8 | 222 | 3260 | 14.41 | 746 | 749 | 174.3 |
| C | 11 | 7 | 3132 | 13.67 | 746 | 749 | 174.3 |
| D | 1 | 52 | 2140430 | 11442.49 | 717 | 700 | 187.0 |
| D | 2 | 152 | 389356 | 2078.39 | 717 | 700 | 187.0 |
| D | 8 | 195 | 74004 | 392.0 | 717 | 700 | 187.0 |
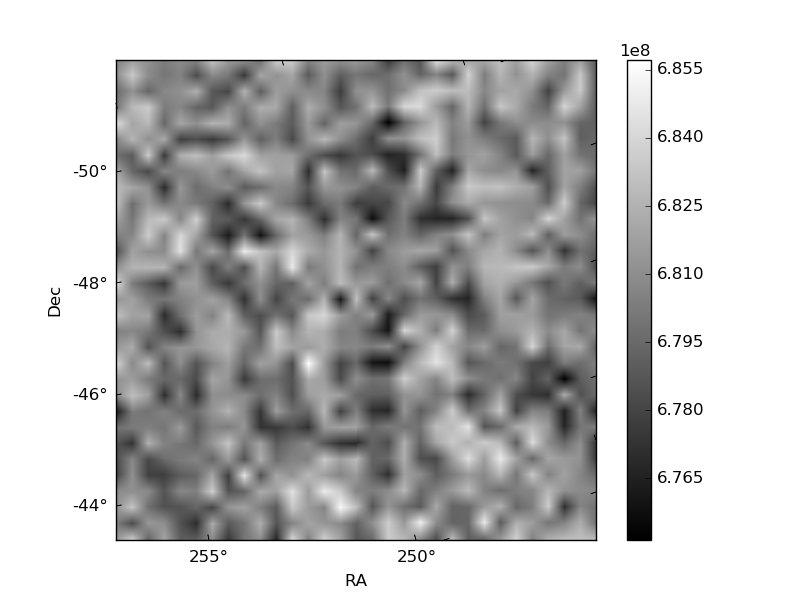
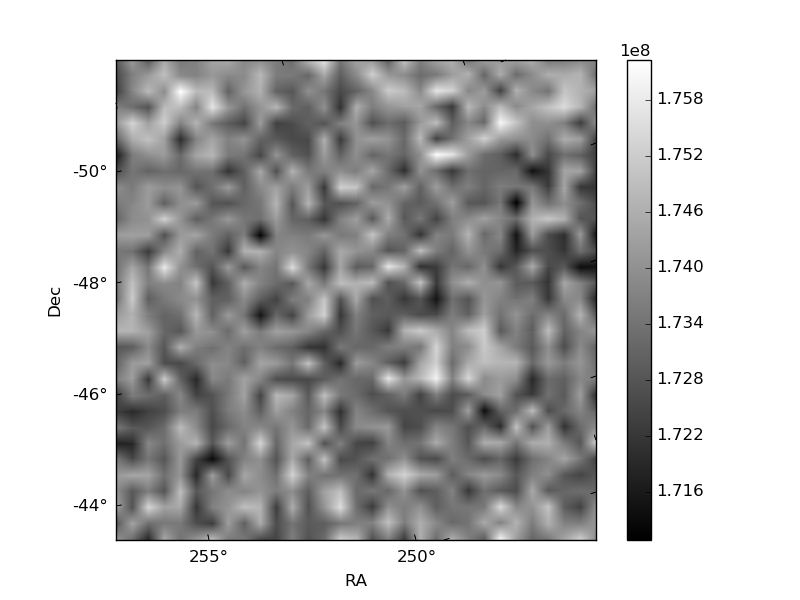
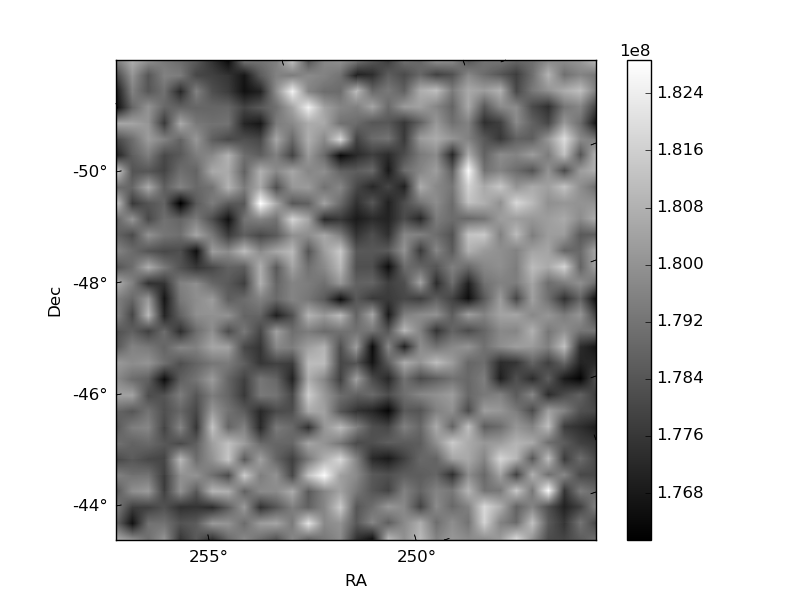
Histogram calculated using DETX and DETY for each event in the final _common_clean file
| Quadrant A | 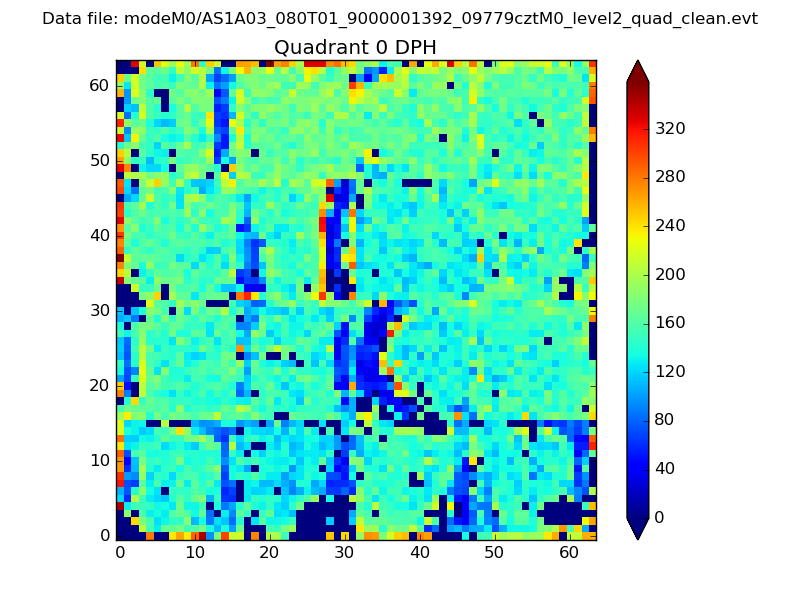 |
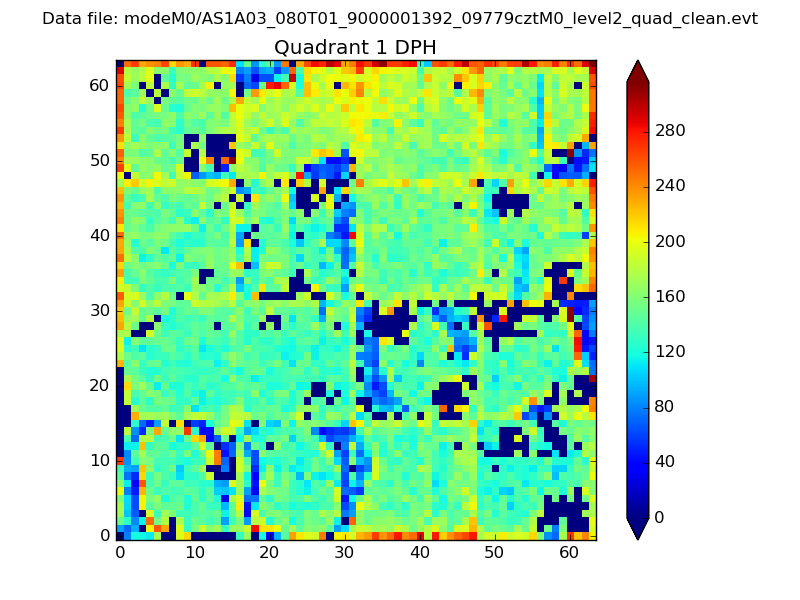 |
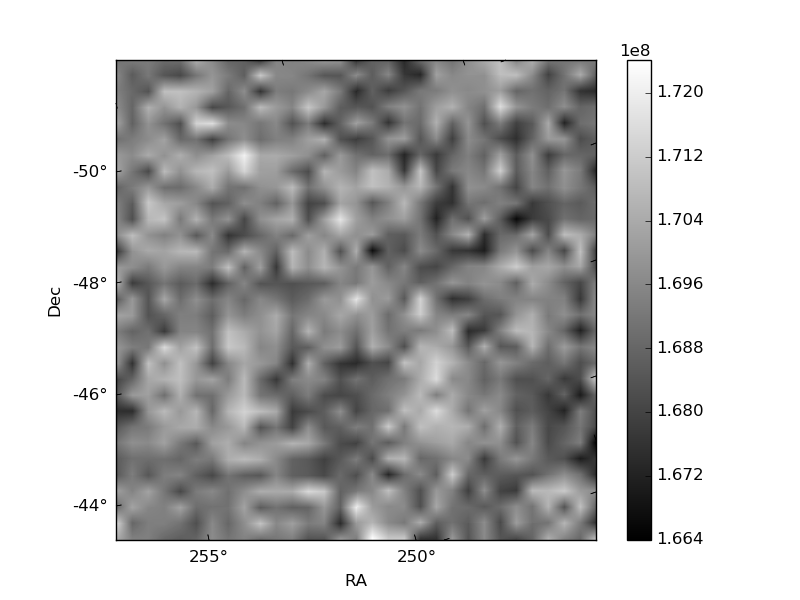
Quadrant B |
|---|---|---|---|
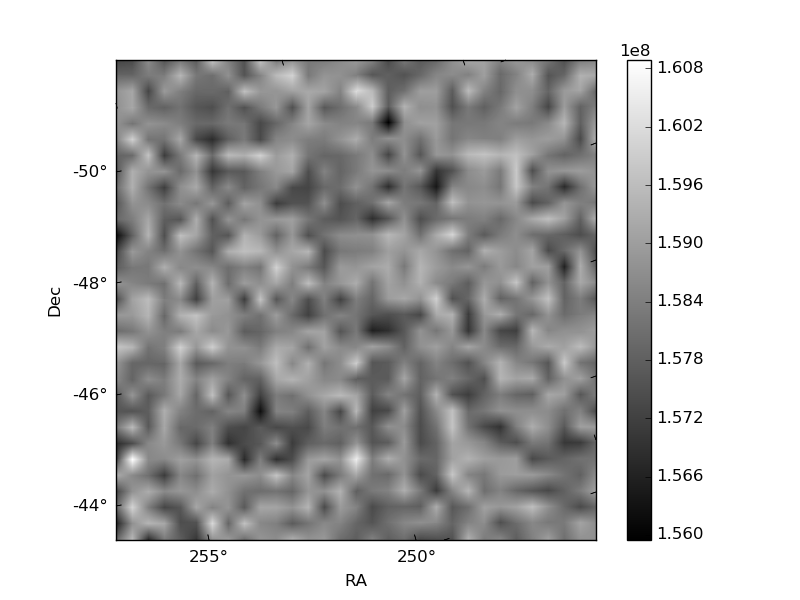
| Quadrant D | 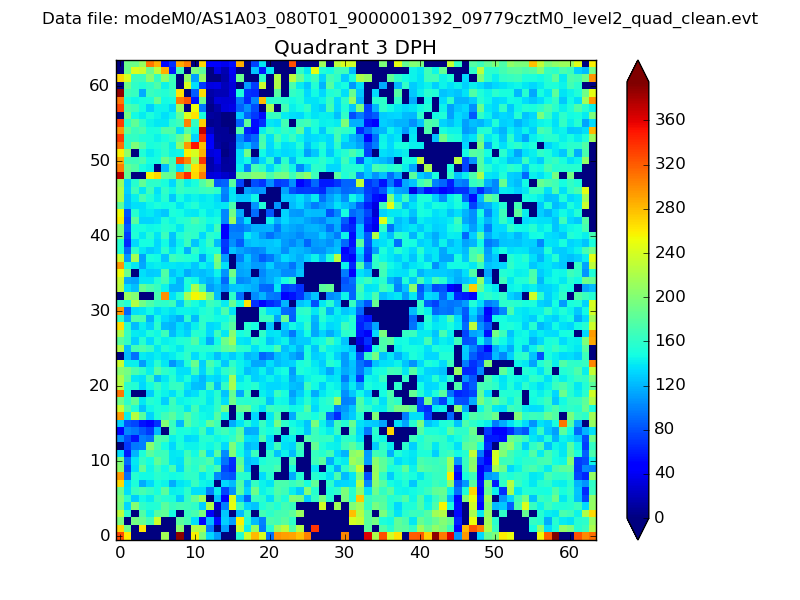 |
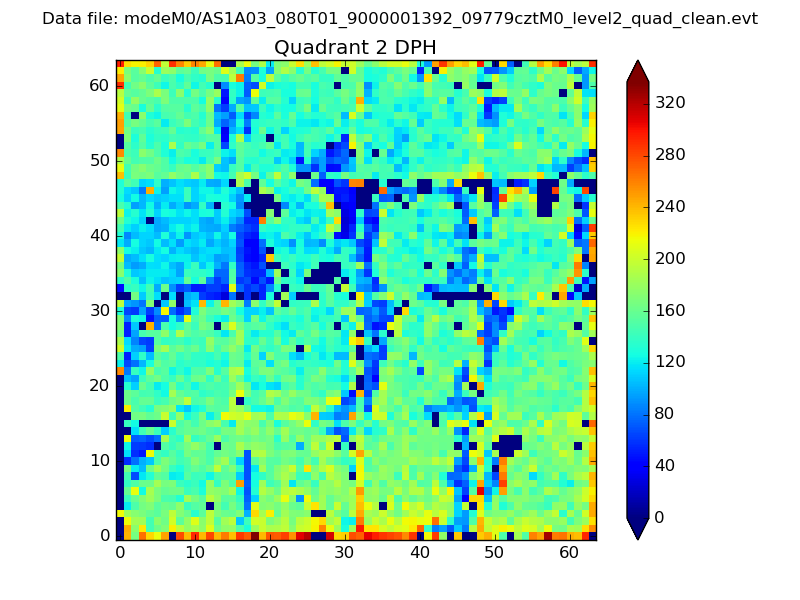 |
Quadrant C |
| Plot type | Count rate plots | Images |
|---|---|---|
| Comparison with Poisson distribution Blue bars denote a histogram of data divided into 1 sec bins. Red curve is a Poisson curve with rate = median count rate of data. |
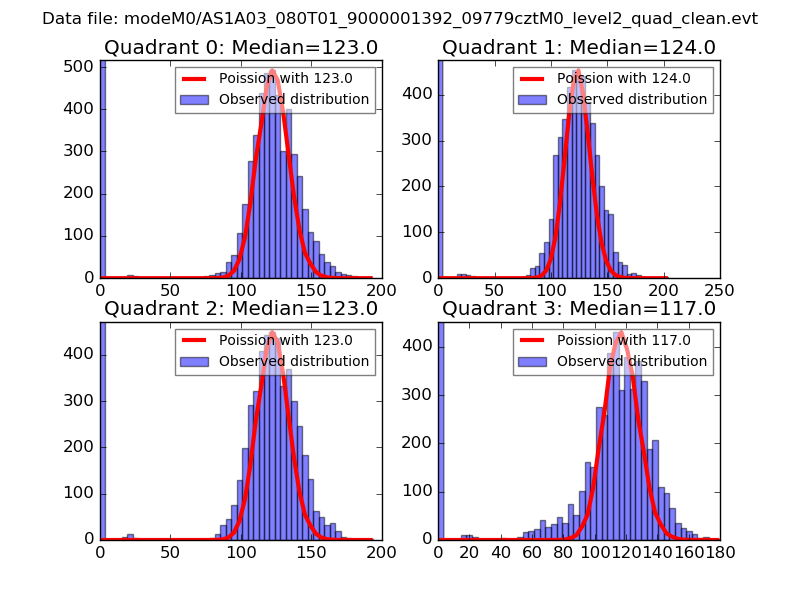 |
 |
| Quadrant-wise count rates Data is divided into 100 sec bins |
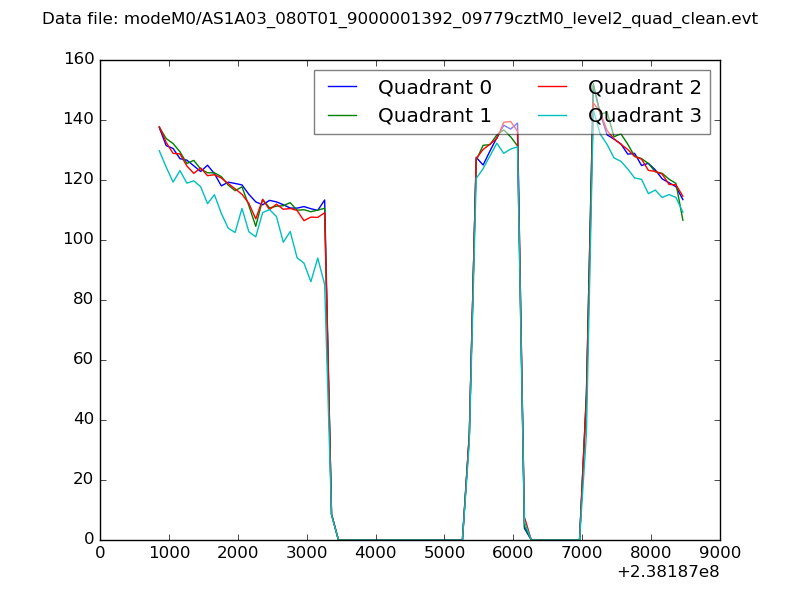 |
|
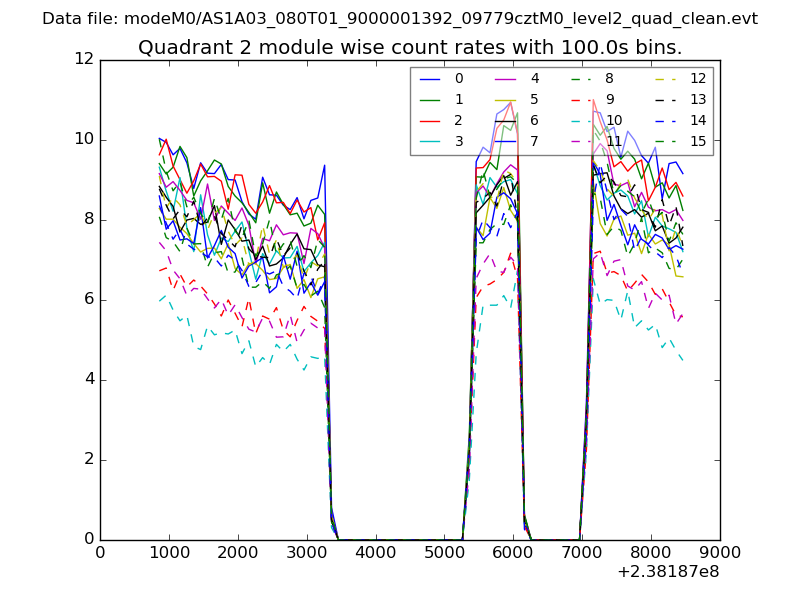
| Module-wise count rates for Quadrant A Data is divided into 100 sec bins |
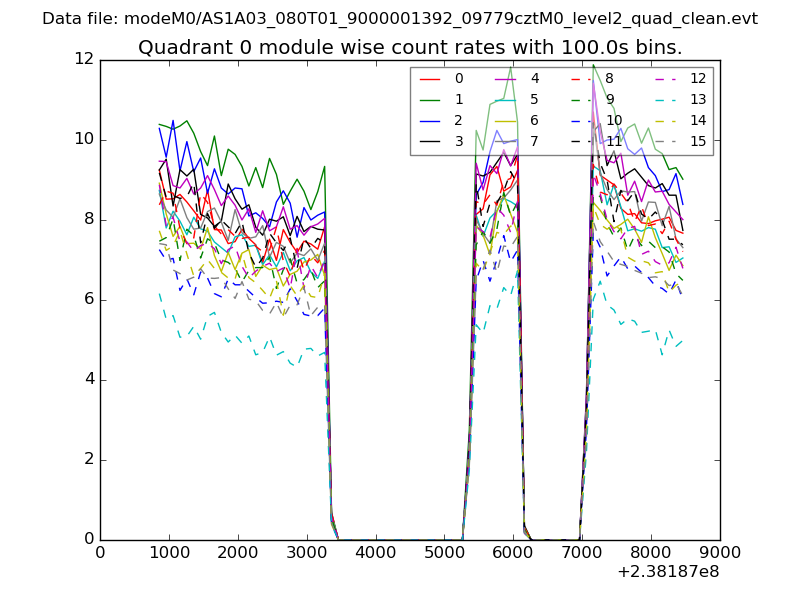 |
 |
| Module-wise count rates for Quadrant B Data is divided into 100 sec bins |
 |
 |
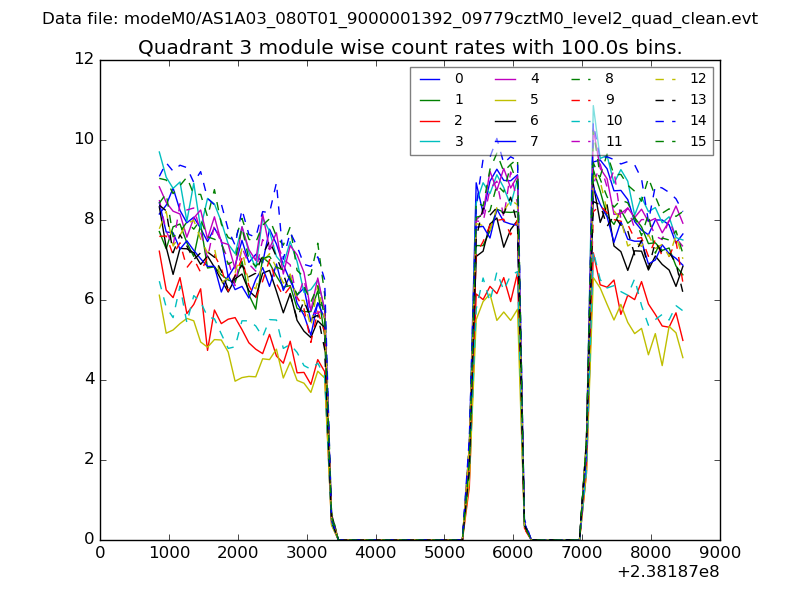
| Module-wise count rates for Quadrant C Data is divided into 100 sec bins |
 |
 |
| Module-wise count rates for Quadrant D Data is divided into 100 sec bins |
 |
 |
| Parameter | Plot |
|---|---|
| CZT HV Monitor | 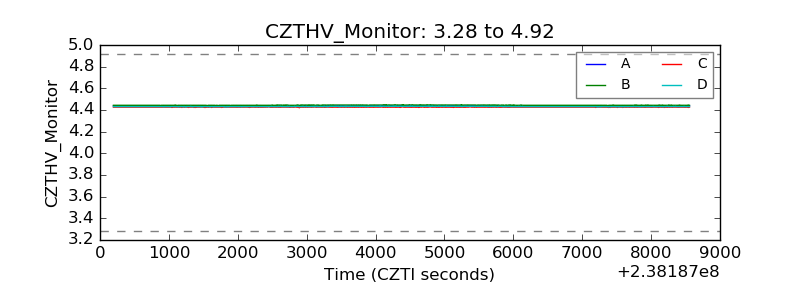 |
| D_VDD | 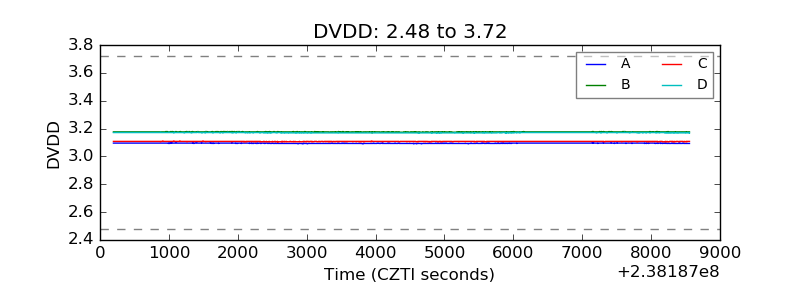 |
| Temperature 1 | 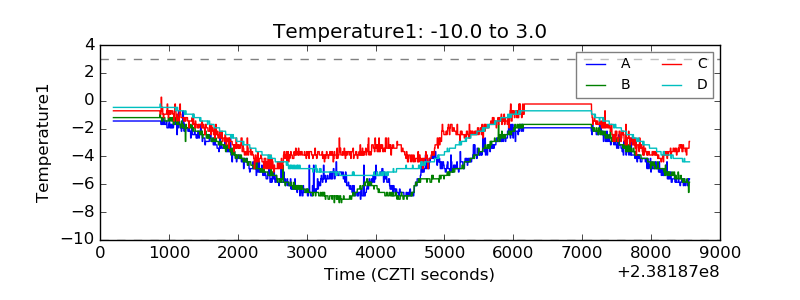 |
| Veto HV Monitor | 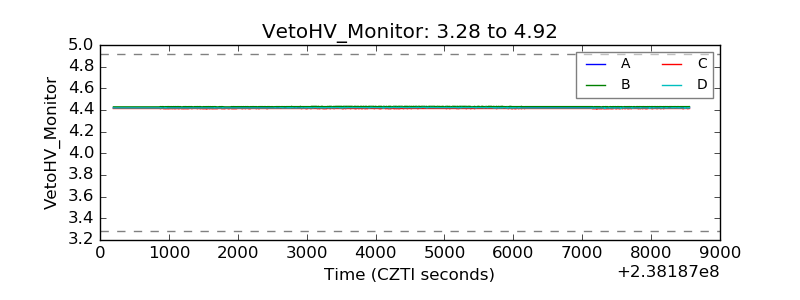 |
| Veto LLD | 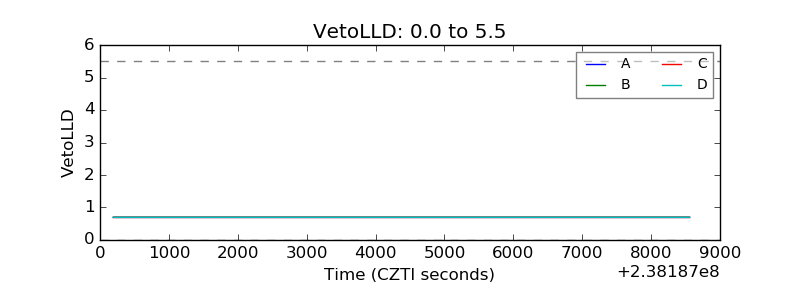 |
| Alpha Counter | 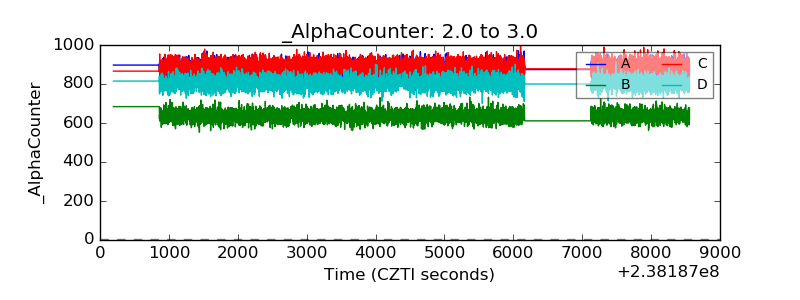 |
| _CPM_Rate | 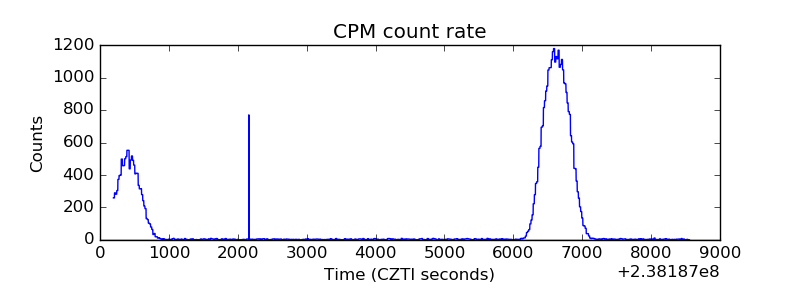 |
| CZT Counter | 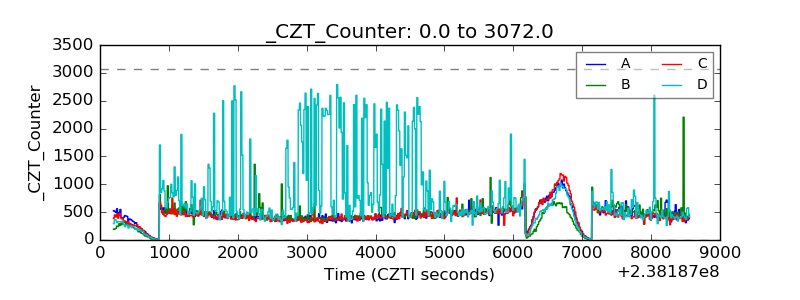 |
| +2.5 Volts monitor |  |
| +5 Volts monitor |  |
| _ROLL_ROT | 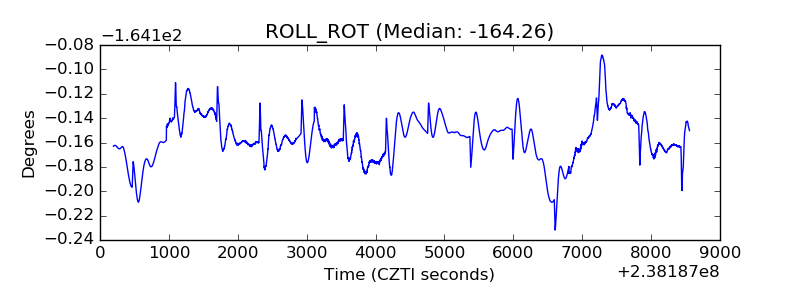 |
| _Roll_DEC | 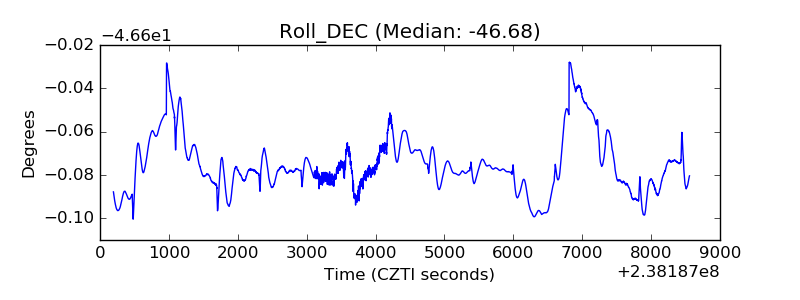 |
| _Roll_RA | 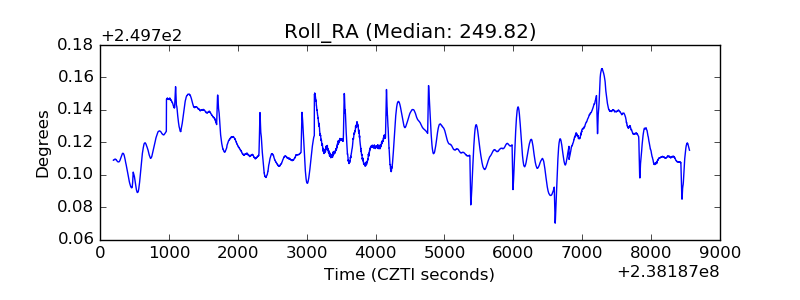 |
| Veto Counter | 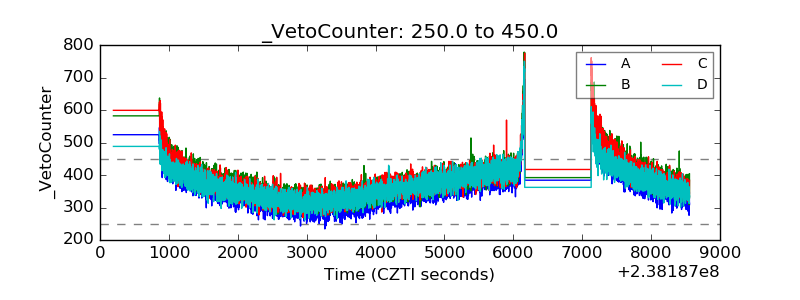 |