| Param | Original file | Final file |
|---|---|---|
| Filename | modeM0/AS1A03_080T01_9000001392_09781cztM0_level2.evt | modeM0/AS1A03_080T01_9000001392_09781cztM0_level2_quad_clean.evt |
| Size (bytes) | 424,232,640 | 87,762,240 |
| Size | 404.6 MB | 83.7 MB |
| Events in quadrant A | 2,968,904 | 556,889 |
| Events in quadrant B | 3,232,498 | 565,372 |
| Events in quadrant C | 2,837,676 | 559,491 |
| Events in quadrant D | 3,374,559 | 530,449 |
| Mode M0 | |||
|---|---|---|---|
| Quadrant | BADHDUFLAG | Total packets | Discarded packets |
| A | 0 | 13212 | 3 |
| B | 0 | 13868 | 4 |
| C | 0 | 12904 | 4 |
| D | 0 | 14470 | 4 |
| Mode M9 | |||
|---|---|---|---|
| Quadrant | BADHDUFLAG | Total packets | Discarded packets |
| A | 0 | 17 | 0 |
| B | 0 | 17 | 0 |
| C | 0 | 17 | 0 |
| D | 0 | 18 | 0 |
| Mode SS | |||
|---|---|---|---|
| Quadrant | BADHDUFLAG | Total packets | Discarded packets |
| A | 0 | 130 | 0 |
| B | 0 | 130 | 0 |
| C | 0 | 130 | 0 |
| D | 0 | 130 | 0 |
| Quadrant | Total seconds | Saturated seconds | Saturation percentage |
|---|---|---|---|
| A | 6383 | 10 | 0.156666% |
| B | 6382 | 51 | 0.799123% |
| C | 6382 | 8 | 0.125353% |
| D | 6382 | 81 | 1.269195% |
Noise dominated data is calculated using 1-second bins in cleaned event files. If a bin has >2000 counts, and if more than 50% of those come from <1% of pixels, then it is considered to be noise-dominated and hence unusable.
| Quadrant | # 1 sec bins | Bins with >0 counts | Bins with >2000 counts | High rate bins dominated by noise | Noise dominated (total time) | Noise dominated (detector-on time) | Marked lightcurve |
|---|---|---|---|---|---|---|---|
| A | 7528 | 6384 | 0 | 0 | 0.00% | 0.00% | 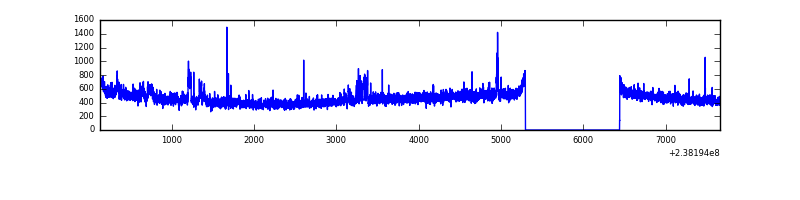 |
| B | 7528 | 6384 | 30 | 30 | 0.40% | 0.47% | 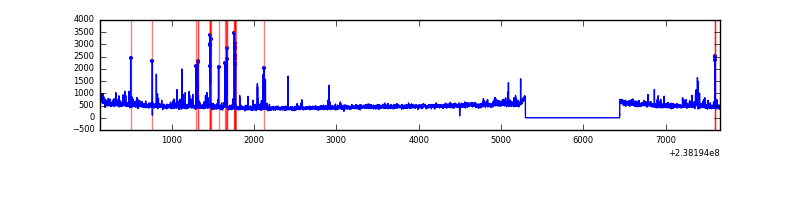 |
| C | 7528 | 6384 | 1 | 1 | 0.01% | 0.02% |  |
| D | 7528 | 6384 | 50 | 50 | 0.66% | 0.78% | 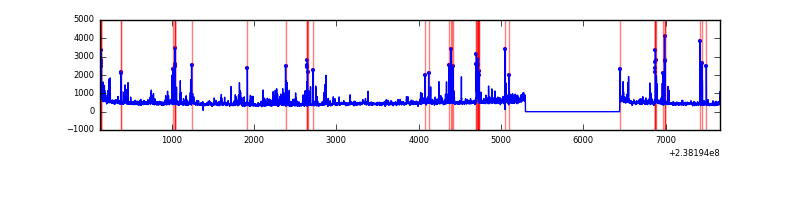 |
Top three noisy pixels from each quadrant. If the there are fewer than three noisy pixels in the level2.evt file, extra rows are filled as -1
| Pixel properties | Quadrant properties | ||||||
|---|---|---|---|---|---|---|---|
| Quadrant | DetID | PixID | Counts | Sigma | Mean | Median | Sigma |
| A | 14 | 111 | 73620 | 482.36 | 745 | 730 | 151.1 |
| A | 13 | 248 | 11628 | 72.12 | 745 | 730 | 151.1 |
| A | 14 | 250 | 7171 | 42.62 | 745 | 730 | 151.1 |
| B | 4 | 81 | 65681 | 450.63 | 754 | 735 | 144.1 |
| B | 4 | 239 | 62150 | 426.13 | 754 | 735 | 144.1 |
| B | 0 | 229 | 47661 | 325.6 | 754 | 735 | 144.1 |
| C | 13 | 61 | 5599 | 28.93 | 724 | 729 | 168.3 |
| C | 14 | 234 | 4282 | 21.11 | 724 | 729 | 168.3 |
| C | 14 | 128 | 4077 | 19.89 | 724 | 729 | 168.3 |
| D | 2 | 152 | 303671 | 1658.4 | 710 | 691 | 182.7 |
| D | 2 | 14 | 101500 | 551.79 | 710 | 691 | 182.7 |
| D | 1 | 52 | 88675 | 481.59 | 710 | 691 | 182.7 |
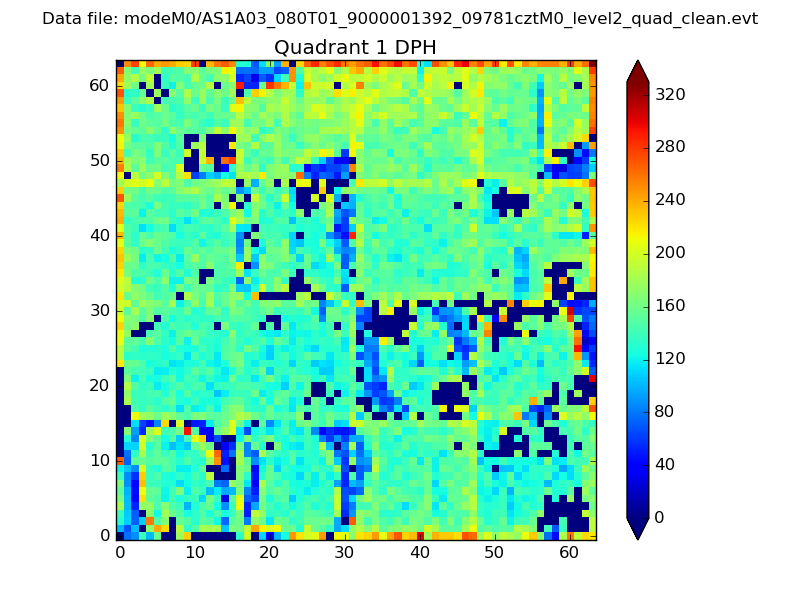
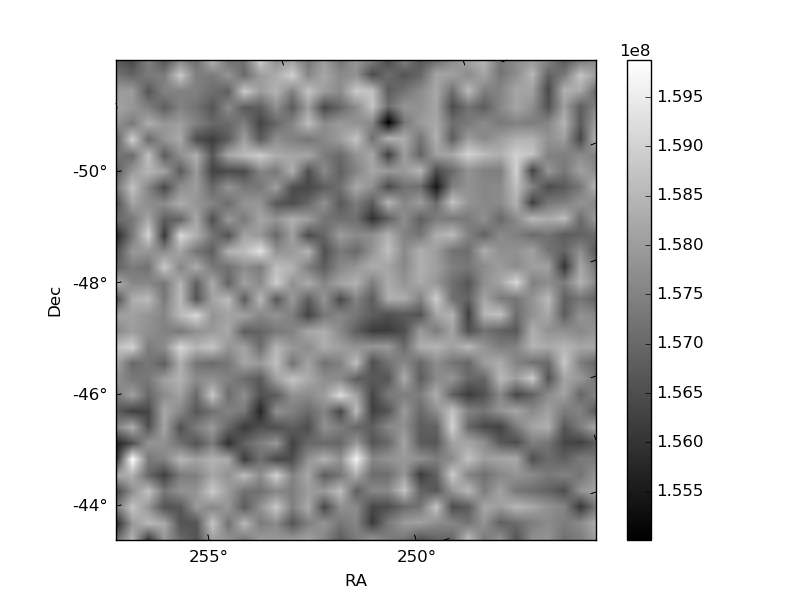
Histogram calculated using DETX and DETY for each event in the final _common_clean file
| Quadrant A | 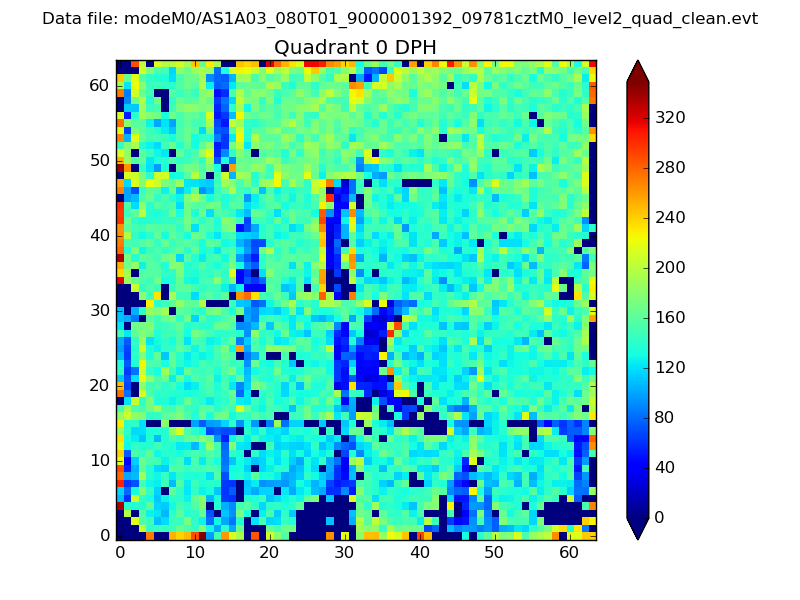 |
 |
Quadrant B |
|---|---|---|---|
| Quadrant D |  |
 |
Quadrant C |
| Plot type | Count rate plots | Images |
|---|---|---|
| Comparison with Poisson distribution Blue bars denote a histogram of data divided into 1 sec bins. Red curve is a Poisson curve with rate = median count rate of data. |
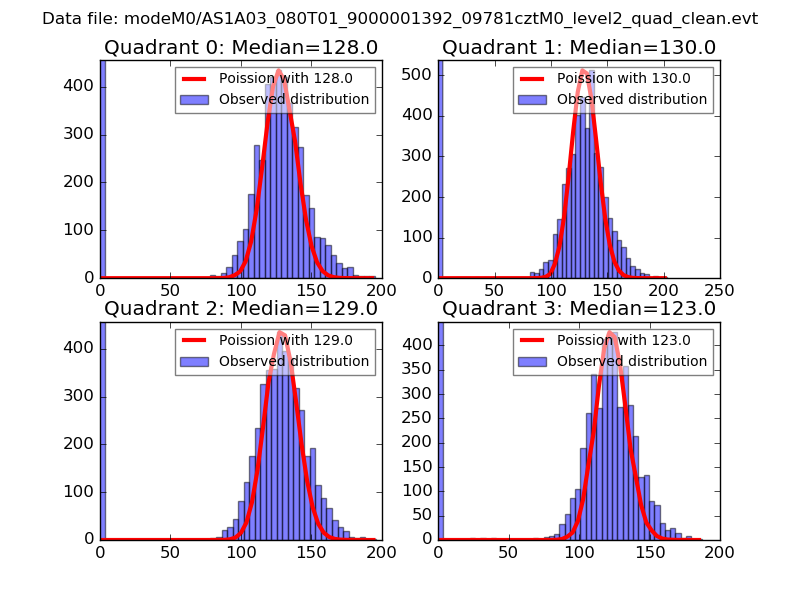 |
 |
| Quadrant-wise count rates Data is divided into 100 sec bins |
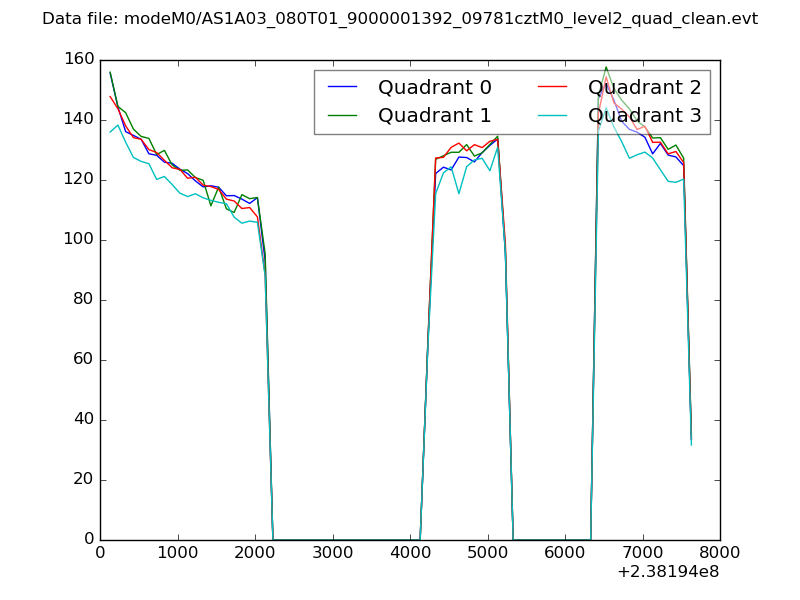 |
|
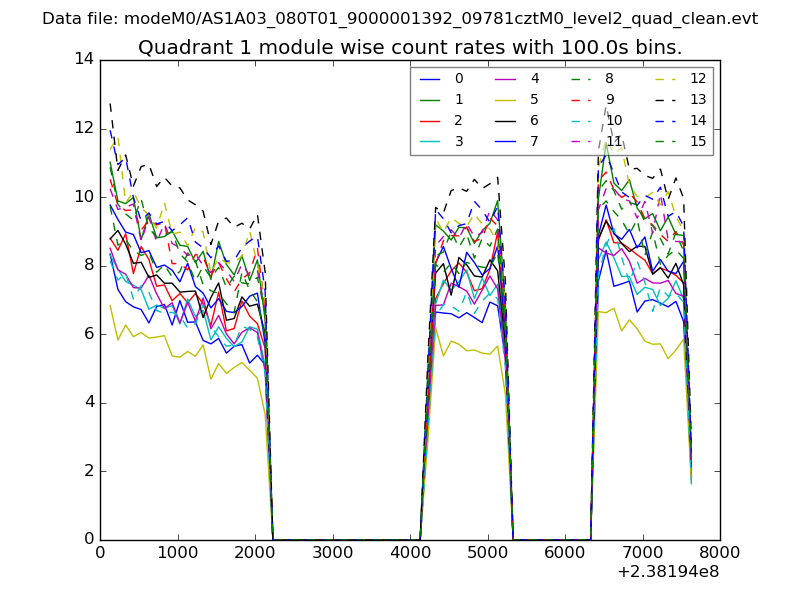
| Module-wise count rates for Quadrant A Data is divided into 100 sec bins |
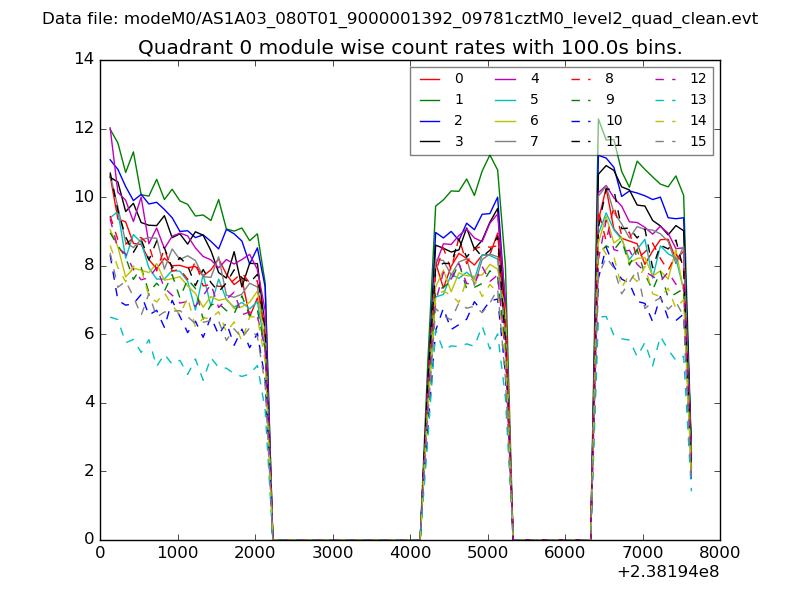 |
 |
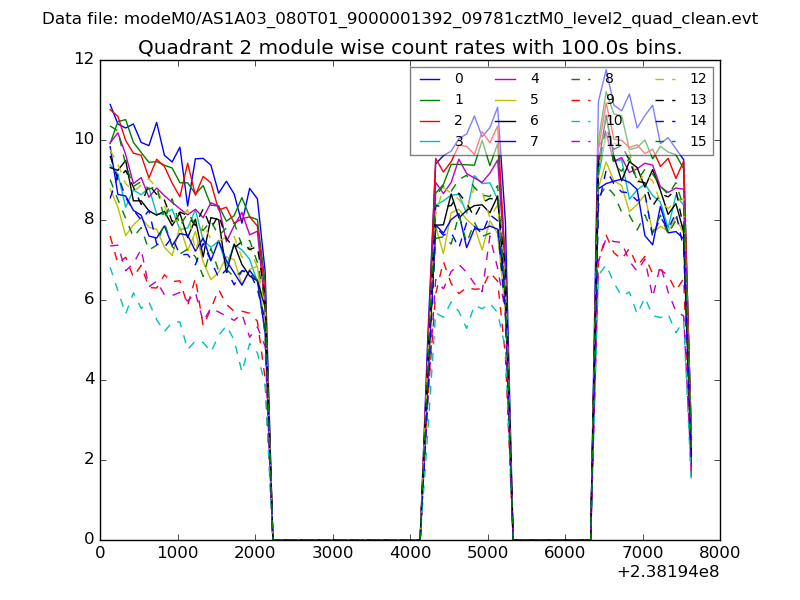
| Module-wise count rates for Quadrant B Data is divided into 100 sec bins |
 |
 |
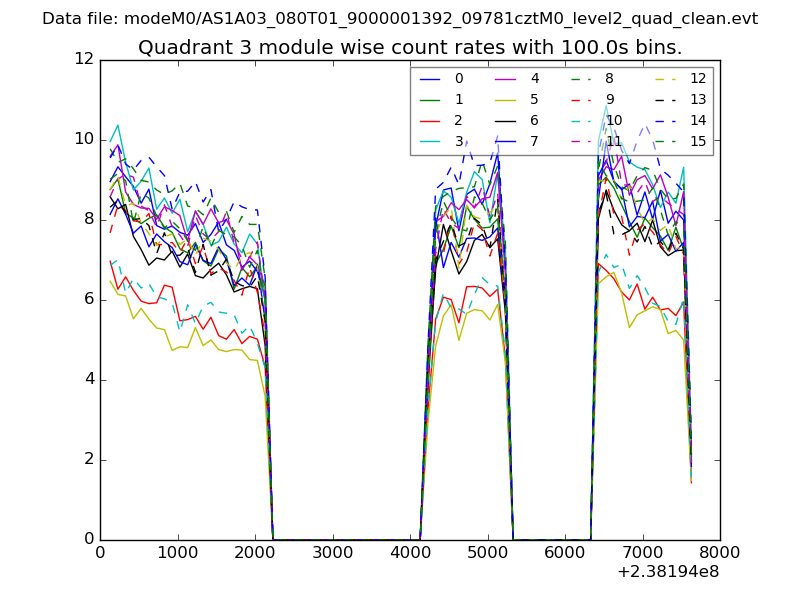
| Module-wise count rates for Quadrant C Data is divided into 100 sec bins |
 |
 |
| Module-wise count rates for Quadrant D Data is divided into 100 sec bins |
 |
 |
| Parameter | Plot |
|---|---|
| CZT HV Monitor | 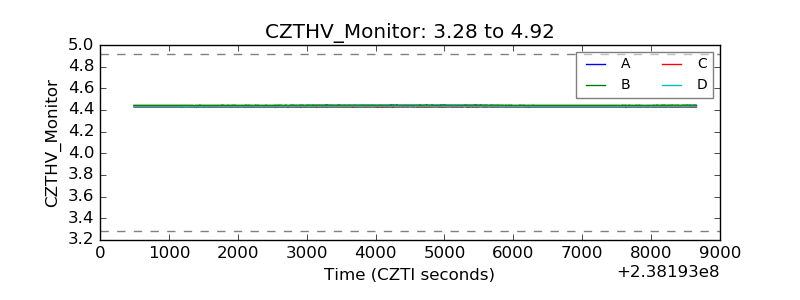 |
| D_VDD | 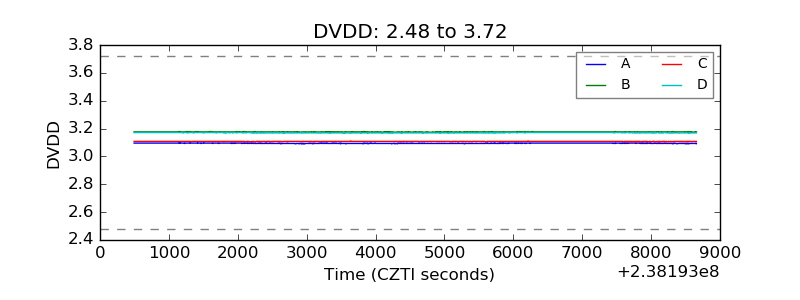 |
| Temperature 1 | 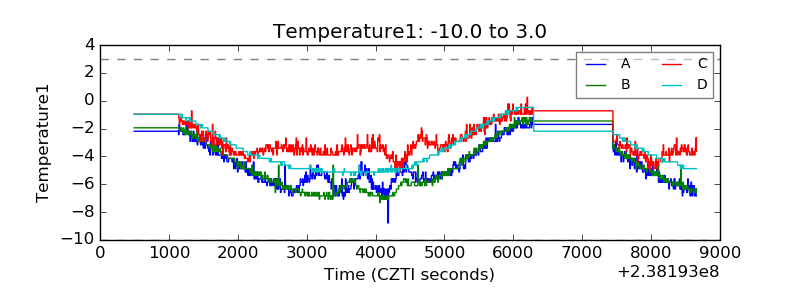 |
| Veto HV Monitor | 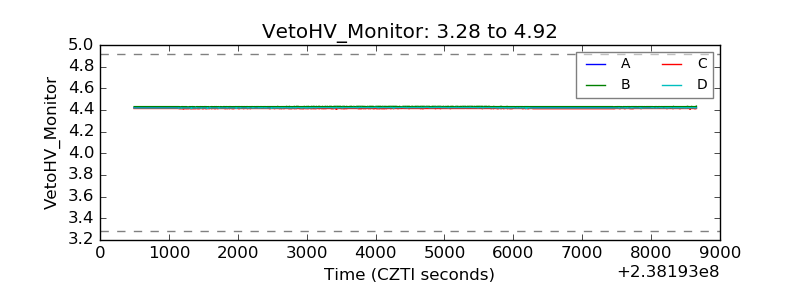 |
| Veto LLD | 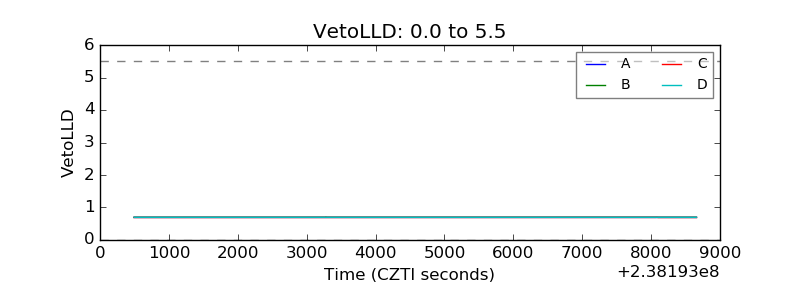 |
| Alpha Counter | 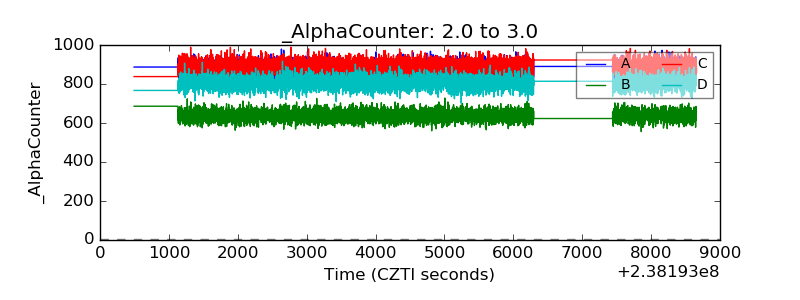 |
| _CPM_Rate | 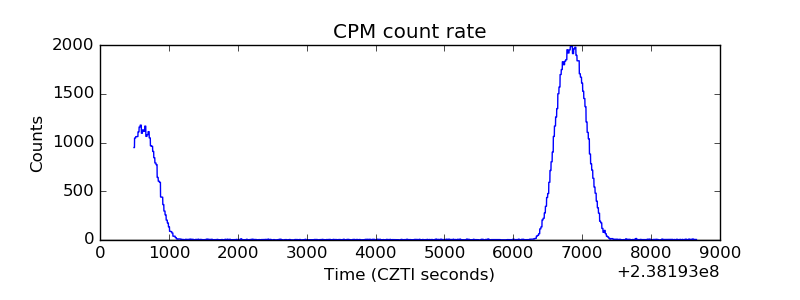 |
| CZT Counter |  |
| +2.5 Volts monitor |  |
| +5 Volts monitor |  |
| _ROLL_ROT | 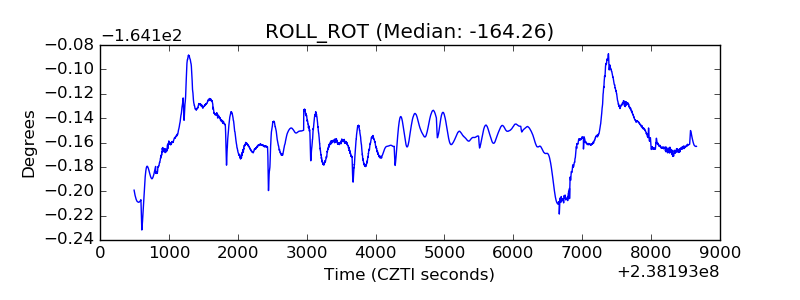 |
| _Roll_DEC | 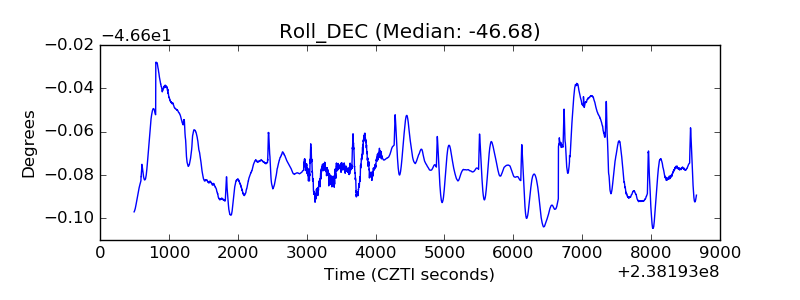 |
| _Roll_RA | 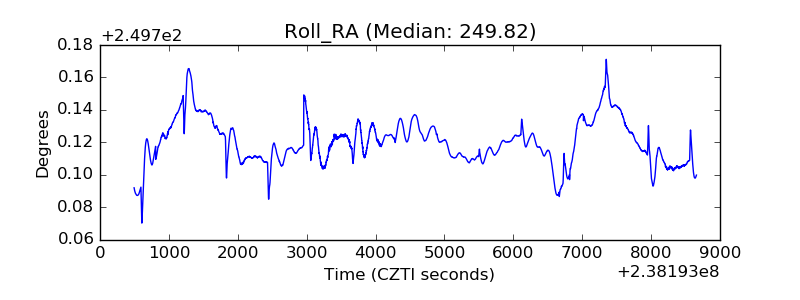 |
| Veto Counter | 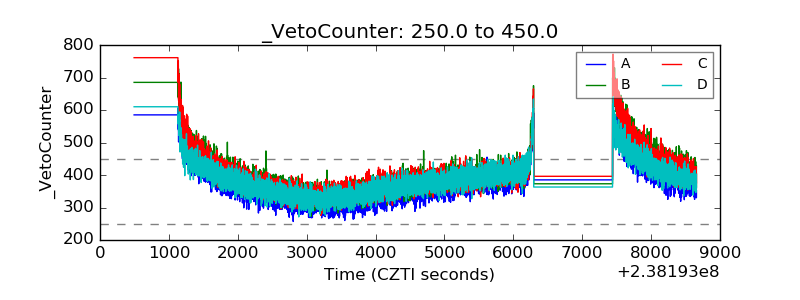 |