| Param | Original file | Final file |
|---|---|---|
| Filename | modeM0/AS1A03_080T01_9000001392_09782cztM0_level2.evt | modeM0/AS1A03_080T01_9000001392_09782cztM0_level2_quad_clean.evt |
| Size (bytes) | 433,494,720 | 94,440,960 |
| Size | 413.4 MB | 90.1 MB |
| Events in quadrant A | 3,027,398 | 602,347 |
| Events in quadrant B | 3,262,998 | 618,147 |
| Events in quadrant C | 2,997,122 | 609,490 |
| Events in quadrant D | 3,398,662 | 576,674 |
| Mode M0 | |||
|---|---|---|---|
| Quadrant | BADHDUFLAG | Total packets | Discarded packets |
| A | 0 | 13318 | 11 |
| B | 0 | 13934 | 17 |
| C | 0 | 13251 | 14 |
| D | 0 | 14674 | 6 |
| Mode M9 | |||
|---|---|---|---|
| Quadrant | BADHDUFLAG | Total packets | Discarded packets |
| A | 0 | 23 | 0 |
| B | 0 | 23 | 0 |
| C | 0 | 23 | 0 |
| D | 0 | 23 | 0 |
| Mode SS | |||
|---|---|---|---|
| Quadrant | BADHDUFLAG | Total packets | Discarded packets |
| A | 0 | 136 | 0 |
| B | 0 | 136 | 0 |
| C | 0 | 136 | 0 |
| D | 0 | 136 | 0 |
| Quadrant | Total seconds | Saturated seconds | Saturation percentage |
|---|---|---|---|
| A | 6497 | 17 | 0.261659% |
| B | 6494 | 20 | 0.307977% |
| C | 6495 | 11 | 0.169361% |
| D | 6499 | 74 | 1.138637% |
Noise dominated data is calculated using 1-second bins in cleaned event files. If a bin has >2000 counts, and if more than 50% of those come from <1% of pixels, then it is considered to be noise-dominated and hence unusable.
| Quadrant | # 1 sec bins | Bins with >0 counts | Bins with >2000 counts | High rate bins dominated by noise | Noise dominated (total time) | Noise dominated (detector-on time) | Marked lightcurve |
|---|---|---|---|---|---|---|---|
| A | 8866 | 6503 | 0 | 0 | 0.00% | 0.00% | 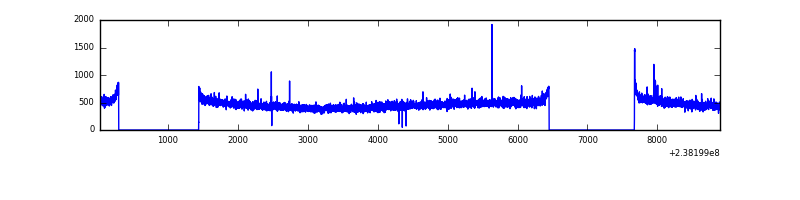 |
| B | 8866 | 6503 | 4 | 4 | 0.05% | 0.06% | 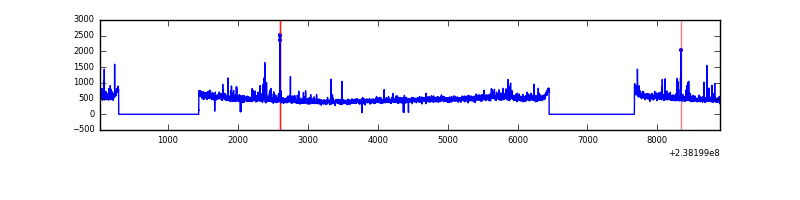 |
| C | 8866 | 6503 | 1 | 1 | 0.01% | 0.02% | 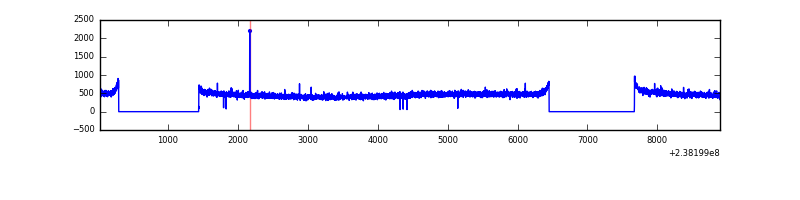 |
| D | 8866 | 6503 | 53 | 53 | 0.60% | 0.82% | 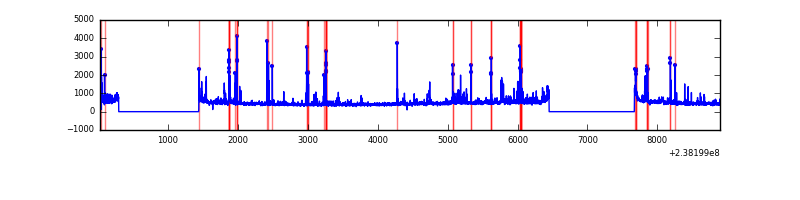 |
Top three noisy pixels from each quadrant. If the there are fewer than three noisy pixels in the level2.evt file, extra rows are filled as -1
| Pixel properties | Quadrant properties | ||||||
|---|---|---|---|---|---|---|---|
| Quadrant | DetID | PixID | Counts | Sigma | Mean | Median | Sigma |
| A | 5 | 112 | 11046 | 65.04 | 781 | 767 | 158.1 |
| A | 0 | 226 | 7218 | 40.82 | 781 | 767 | 158.1 |
| A | 12 | 194 | 6392 | 35.59 | 781 | 767 | 158.1 |
| B | 0 | 214 | 63080 | 413.0 | 794 | 775 | 150.9 |
| B | 4 | 239 | 31102 | 201.03 | 794 | 775 | 150.9 |
| B | 10 | 245 | 25567 | 164.34 | 794 | 775 | 150.9 |
| C | 13 | 61 | 5832 | 28.72 | 765 | 771 | 176.2 |
| C | 14 | 234 | 4643 | 21.97 | 765 | 771 | 176.2 |
| C | 12 | 4 | 3619 | 16.16 | 765 | 771 | 176.2 |
| D | 2 | 152 | 287460 | 1520.24 | 749 | 730 | 188.6 |
| D | 2 | 14 | 80775 | 424.4 | 749 | 730 | 188.6 |
| D | 7 | 71 | 66447 | 348.43 | 749 | 730 | 188.6 |
Histogram calculated using DETX and DETY for each event in the final _common_clean file
| Quadrant A | 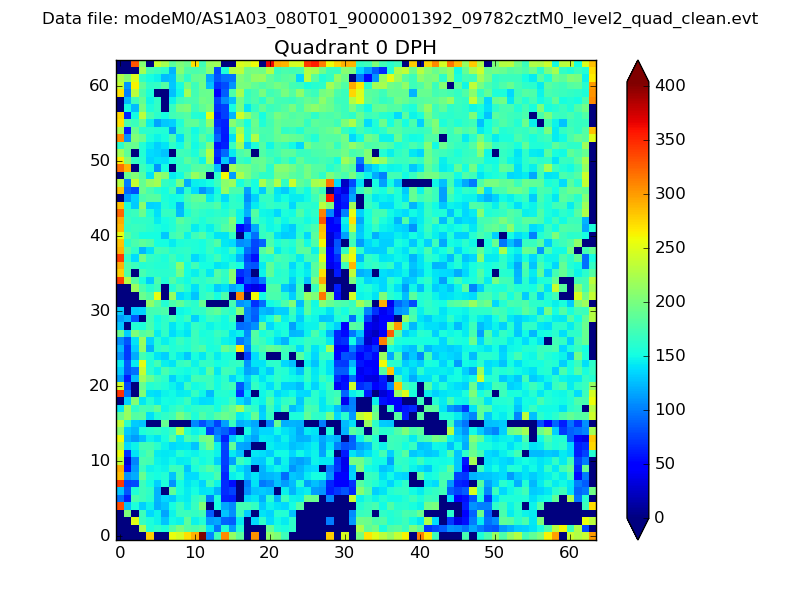 |
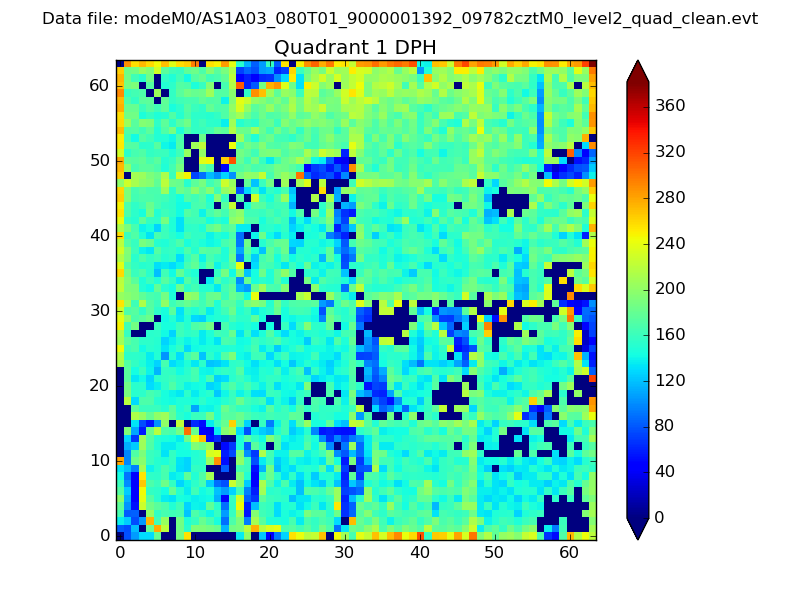 |
Quadrant B |
|---|---|---|---|
| Quadrant D | 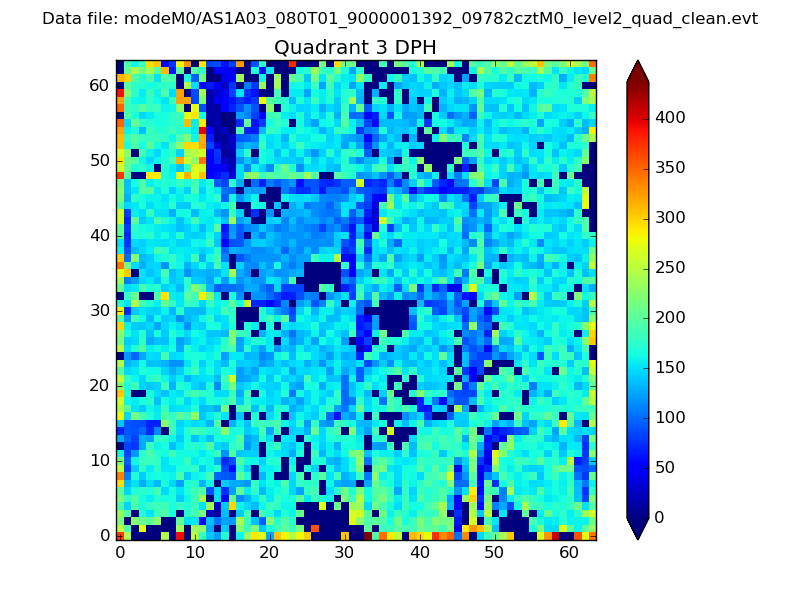 |
 |
Quadrant C |
| Plot type | Count rate plots | Images |
|---|---|---|
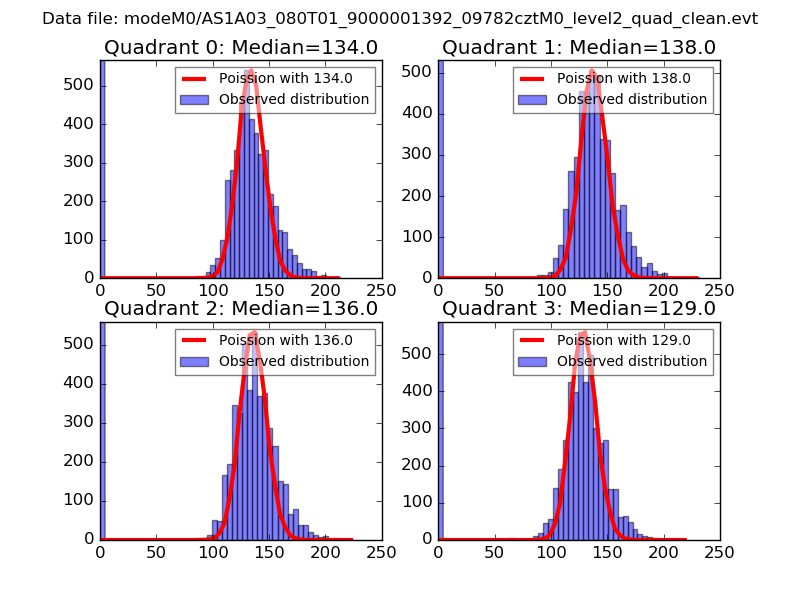
| Comparison with Poisson distribution Blue bars denote a histogram of data divided into 1 sec bins. Red curve is a Poisson curve with rate = median count rate of data. |
 |
 |
| Quadrant-wise count rates Data is divided into 100 sec bins |
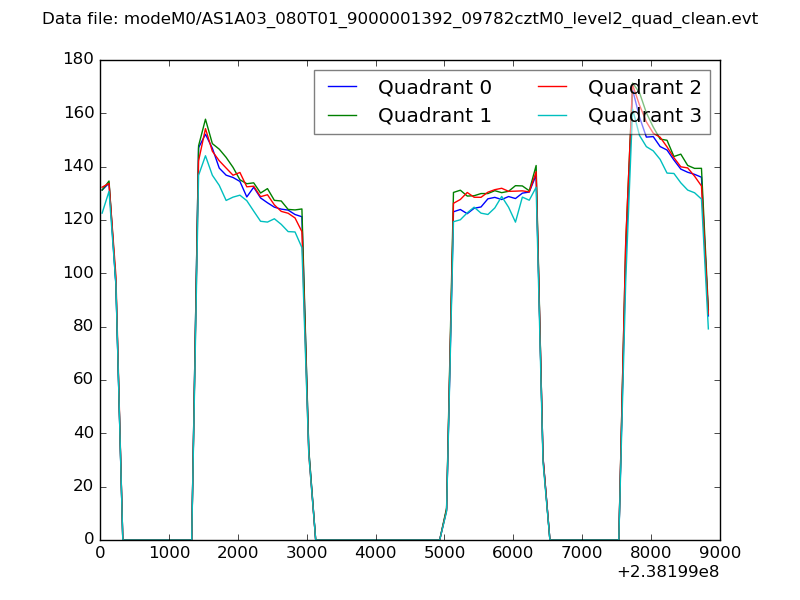 |
|
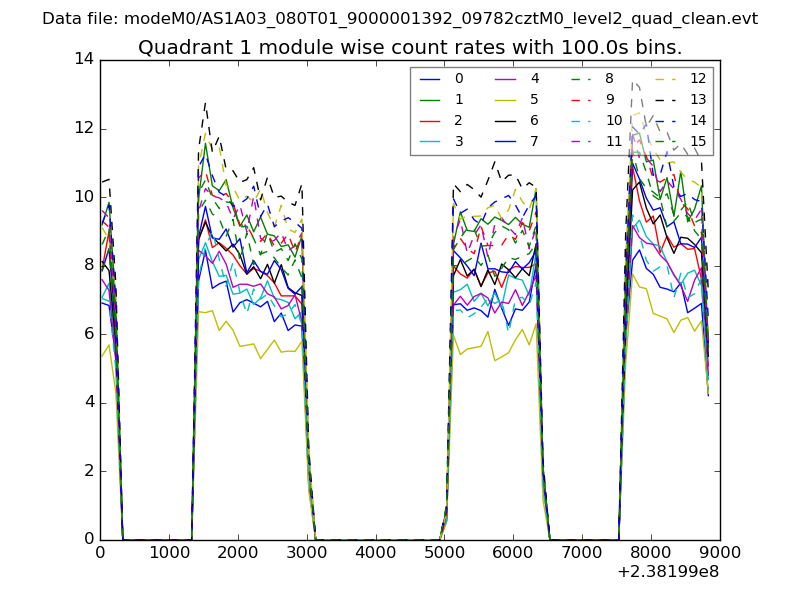
| Module-wise count rates for Quadrant A Data is divided into 100 sec bins |
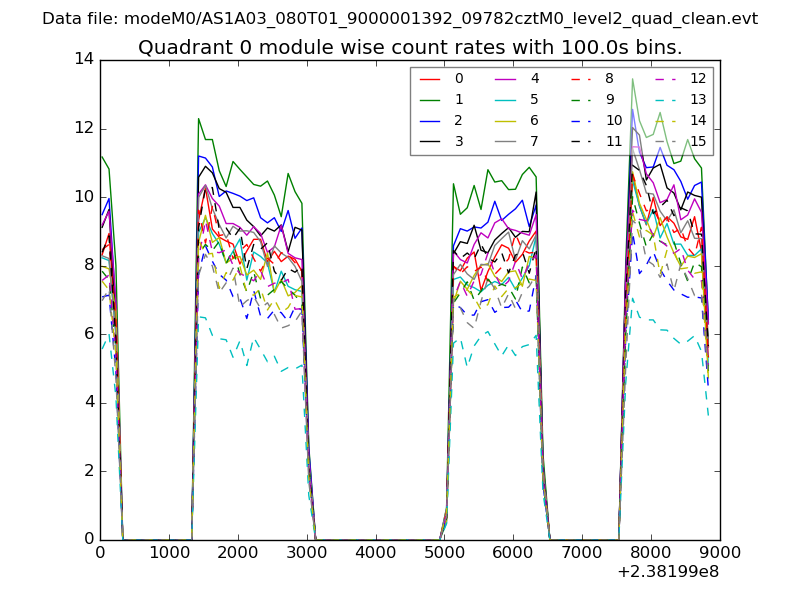 |
 |
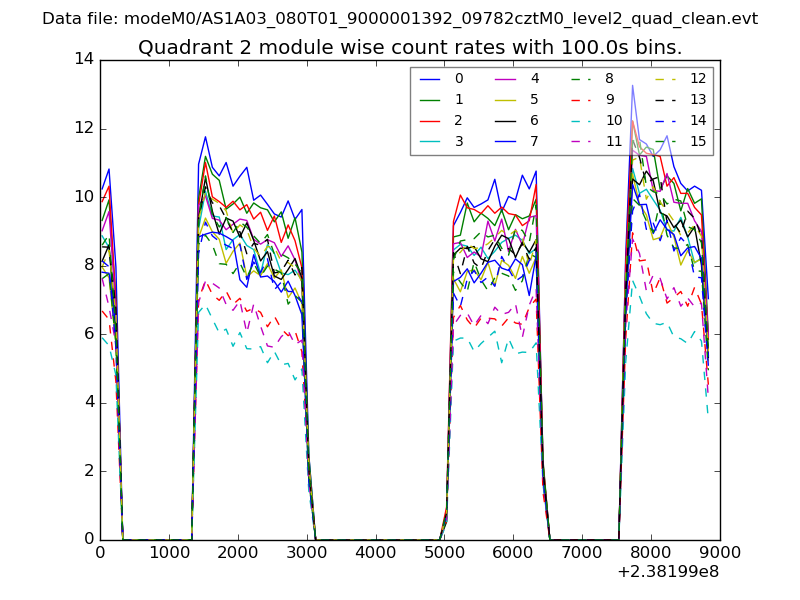
| Module-wise count rates for Quadrant B Data is divided into 100 sec bins |
 |
 |
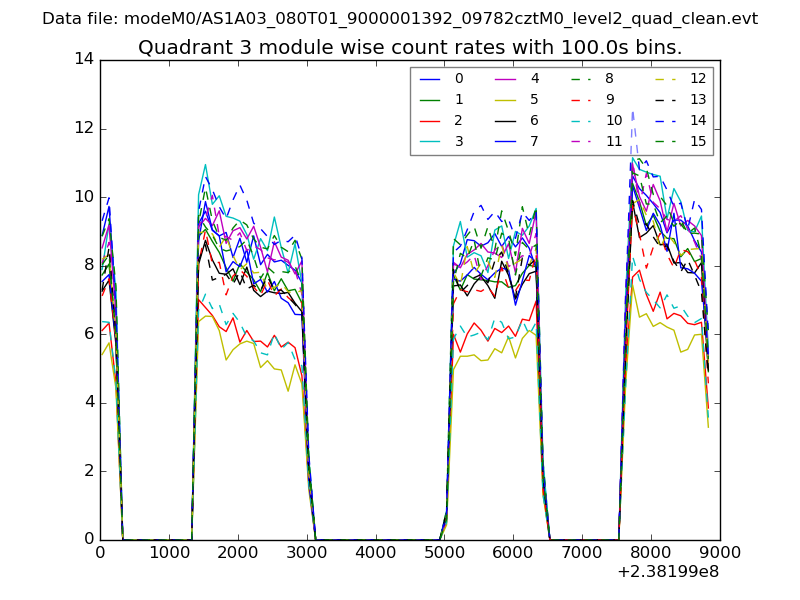
| Module-wise count rates for Quadrant C Data is divided into 100 sec bins |
 |
 |
| Module-wise count rates for Quadrant D Data is divided into 100 sec bins |
 |
 |
| Parameter | Plot |
|---|---|
| CZT HV Monitor | 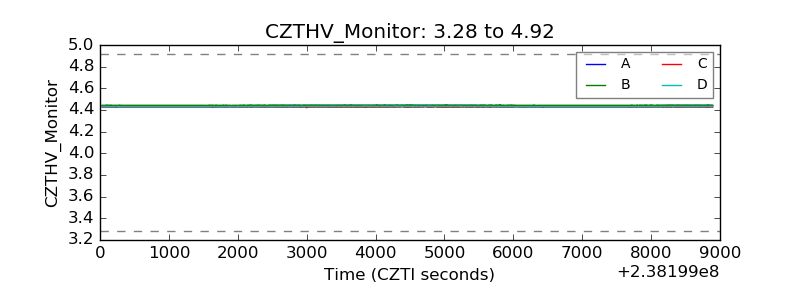 |
| D_VDD | 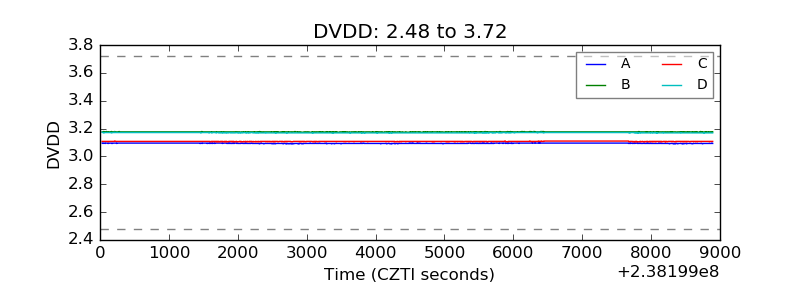 |
| Temperature 1 | 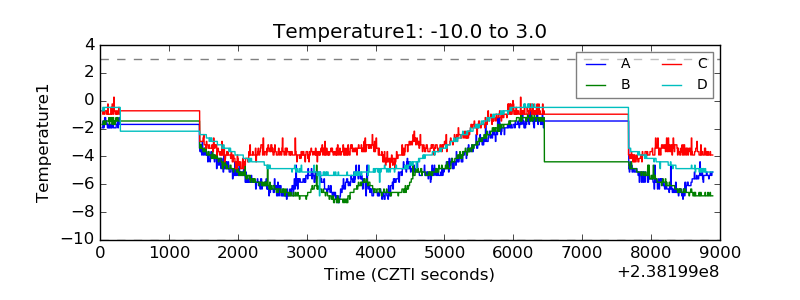 |
| Veto HV Monitor | 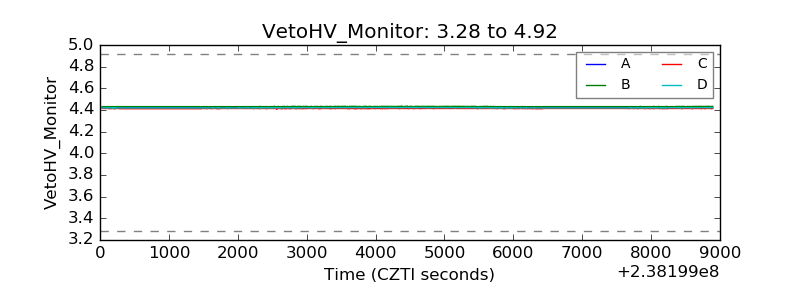 |
| Veto LLD | 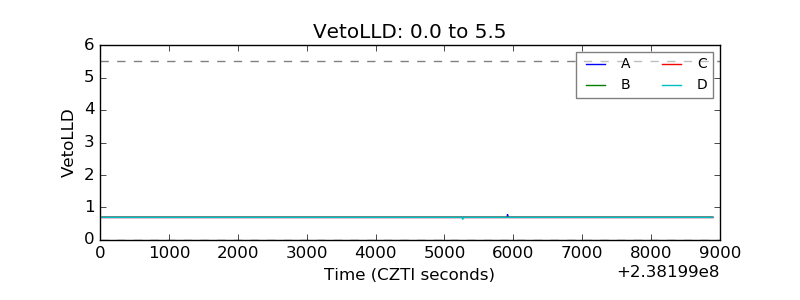 |
| Alpha Counter | 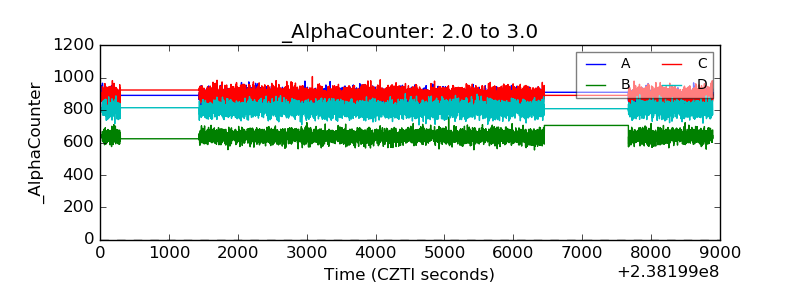 |
| _CPM_Rate | 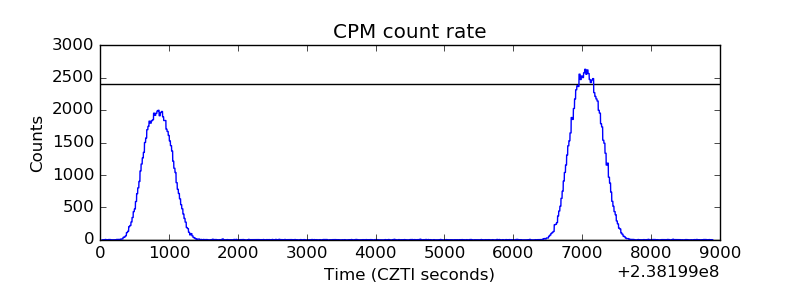 |
| CZT Counter |  |
| +2.5 Volts monitor |  |
| +5 Volts monitor | 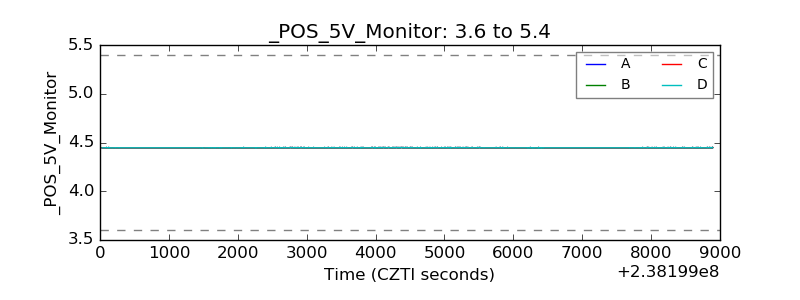 |
| _ROLL_ROT | 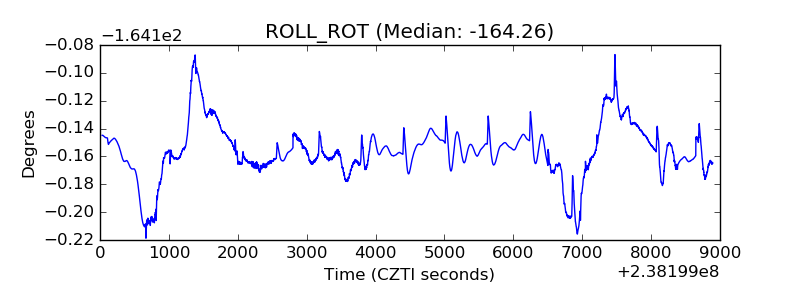 |
| _Roll_DEC | 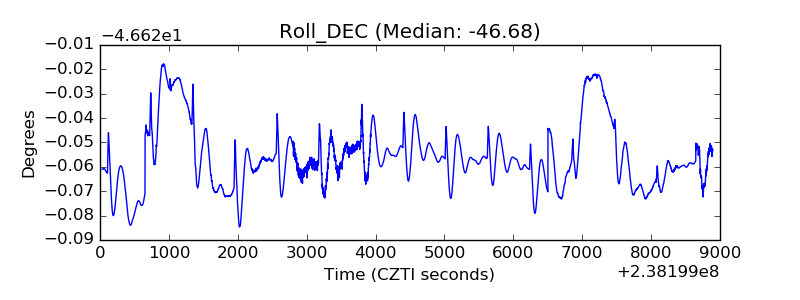 |
| _Roll_RA | 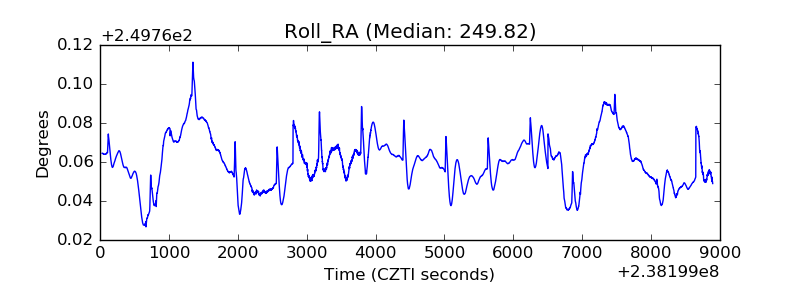 |
| Veto Counter | 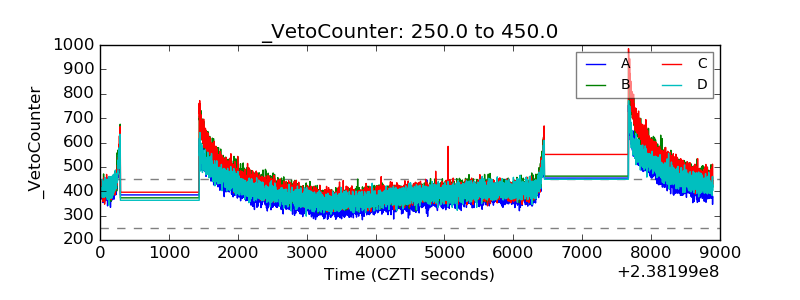 |