| Param | Original file | Final file |
|---|---|---|
| Filename | modeM0/AS1A03_080T01_9000001392_09783cztM0_level2.evt | modeM0/AS1A03_080T01_9000001392_09783cztM0_level2_quad_clean.evt |
| Size (bytes) | 456,287,040 | 88,404,480 |
| Size | 435.1 MB | 84.3 MB |
| Events in quadrant A | 3,167,535 | 551,177 |
| Events in quadrant B | 3,520,795 | 565,807 |
| Events in quadrant C | 3,183,744 | 563,820 |
| Events in quadrant D | 3,496,967 | 534,942 |
| Mode M0 | |||
|---|---|---|---|
| Quadrant | BADHDUFLAG | Total packets | Discarded packets |
| A | 0 | 13656 | 3 |
| B | 0 | 14705 | 2 |
| C | 0 | 13658 | 2 |
| D | 0 | 14864 | 2 |
| Mode M9 | |||
|---|---|---|---|
| Quadrant | BADHDUFLAG | Total packets | Discarded packets |
| A | 0 | 25 | 0 |
| B | 0 | 25 | 0 |
| C | 0 | 25 | 0 |
| D | 0 | 25 | 0 |
| Mode SS | |||
|---|---|---|---|
| Quadrant | BADHDUFLAG | Total packets | Discarded packets |
| A | 0 | 136 | 0 |
| B | 0 | 136 | 0 |
| C | 0 | 136 | 0 |
| D | 0 | 136 | 0 |
| Quadrant | Total seconds | Saturated seconds | Saturation percentage |
|---|---|---|---|
| A | 6618 | 40 | 0.604412% |
| B | 6618 | 93 | 1.405258% |
| C | 6618 | 47 | 0.710184% |
| D | 6618 | 68 | 1.027501% |
Noise dominated data is calculated using 1-second bins in cleaned event files. If a bin has >2000 counts, and if more than 50% of those come from <1% of pixels, then it is considered to be noise-dominated and hence unusable.
| Quadrant | # 1 sec bins | Bins with >0 counts | Bins with >2000 counts | High rate bins dominated by noise | Noise dominated (total time) | Noise dominated (detector-on time) | Marked lightcurve |
|---|---|---|---|---|---|---|---|
| A | 9119 | 6620 | 0 | 0 | 0.00% | 0.00% | 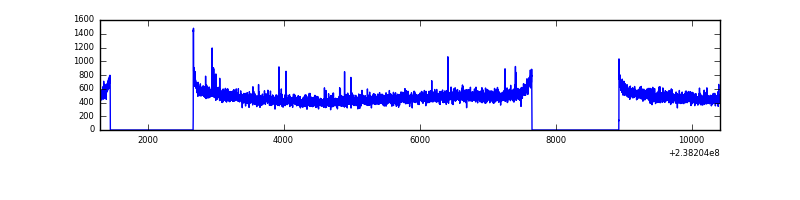 |
| B | 9119 | 6620 | 25 | 25 | 0.27% | 0.38% | 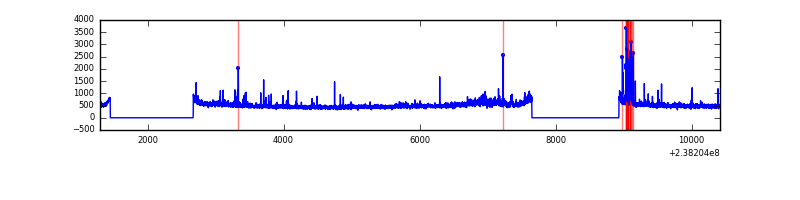 |
| C | 9119 | 6620 | 3 | 3 | 0.03% | 0.05% | 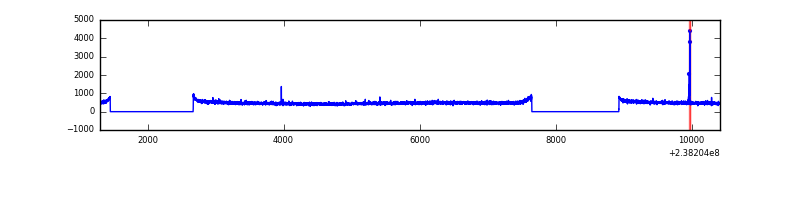 |
| D | 9119 | 6620 | 29 | 29 | 0.32% | 0.44% | 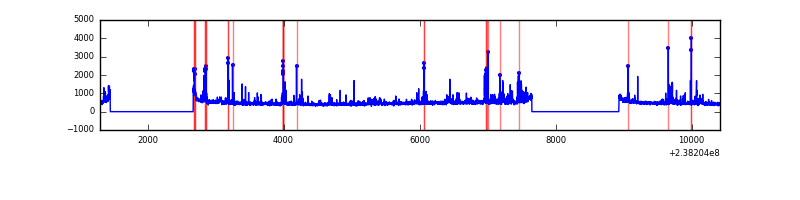 |
Top three noisy pixels from each quadrant. If the there are fewer than three noisy pixels in the level2.evt file, extra rows are filled as -1
| Pixel properties | Quadrant properties | ||||||
|---|---|---|---|---|---|---|---|
| Quadrant | DetID | PixID | Counts | Sigma | Mean | Median | Sigma |
| A | 5 | 112 | 11057 | 62.93 | 817 | 801 | 163.0 |
| A | 0 | 226 | 7487 | 41.02 | 817 | 801 | 163.0 |
| A | 12 | 194 | 6843 | 37.07 | 817 | 801 | 163.0 |
| B | 4 | 239 | 138366 | 889.23 | 830 | 812 | 154.7 |
| B | 0 | 214 | 71645 | 457.91 | 830 | 812 | 154.7 |
| B | 0 | 187 | 51730 | 329.16 | 830 | 812 | 154.7 |
| C | 14 | 234 | 21782 | 112.86 | 809 | 814 | 185.8 |
| C | 13 | 61 | 6085 | 28.37 | 809 | 814 | 185.8 |
| C | 8 | 222 | 2867 | 11.05 | 809 | 814 | 185.8 |
| D | 2 | 152 | 309302 | 1596.08 | 791 | 772 | 193.3 |
| D | 2 | 14 | 72310 | 370.08 | 791 | 772 | 193.3 |
| D | 7 | 71 | 58740 | 299.88 | 791 | 772 | 193.3 |
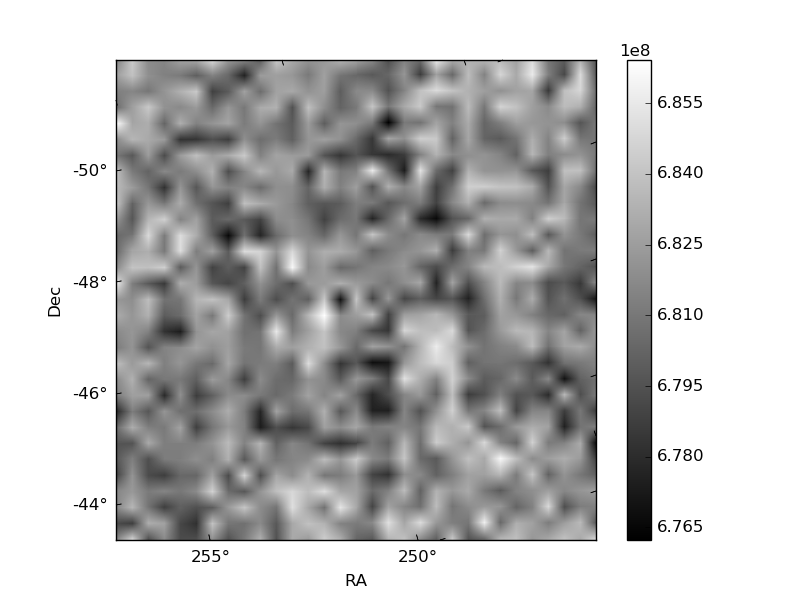
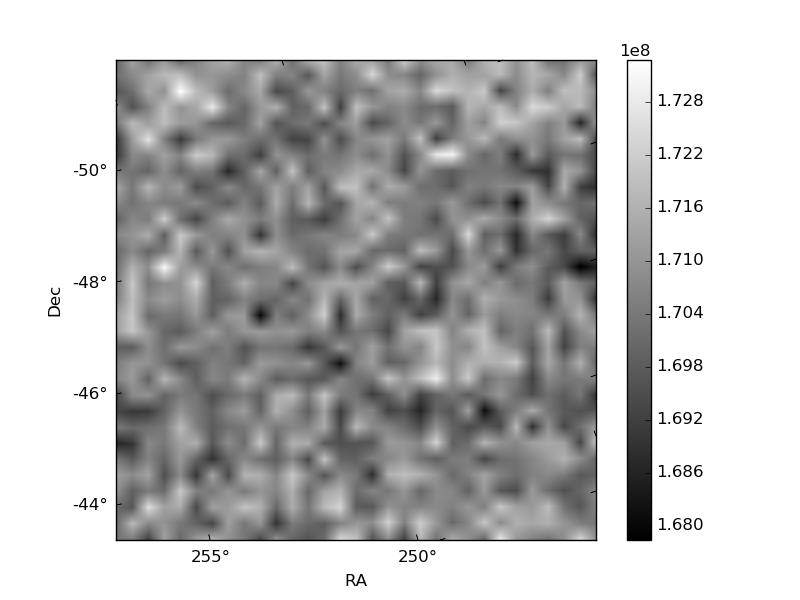
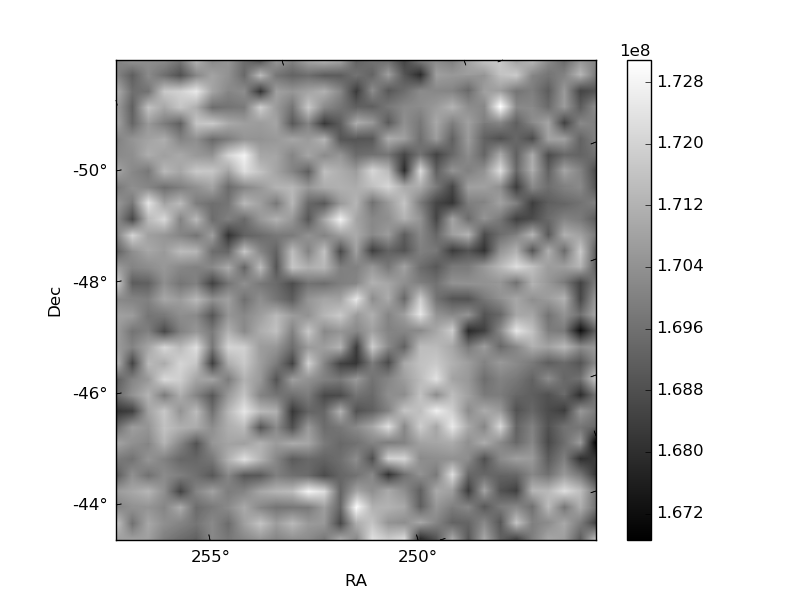
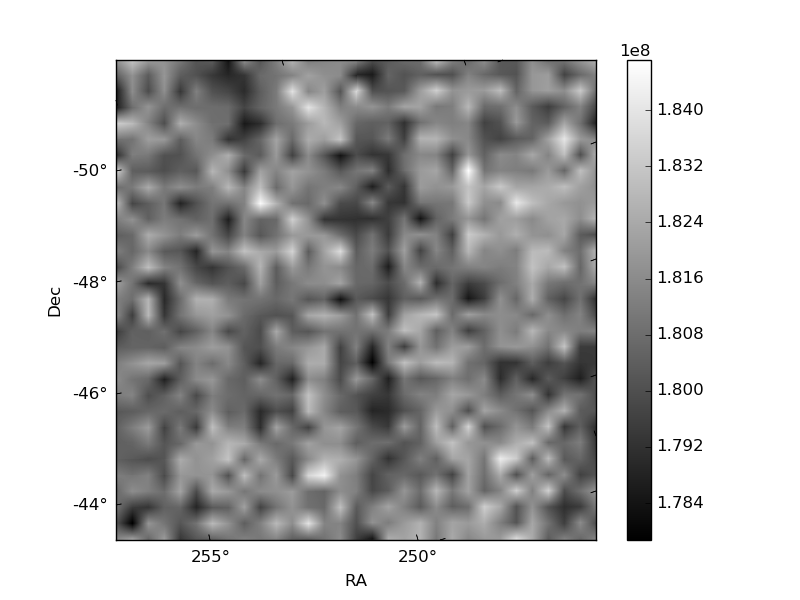
Histogram calculated using DETX and DETY for each event in the final _common_clean file
| Quadrant A | 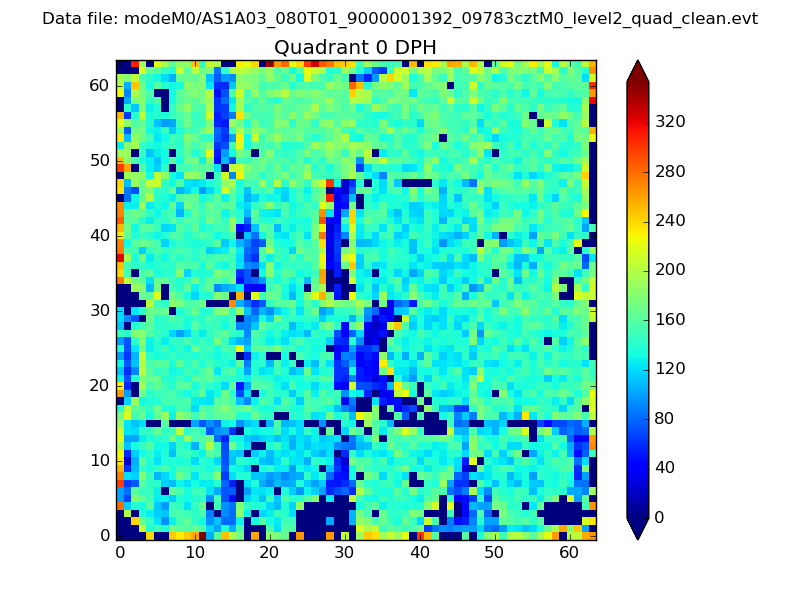 |
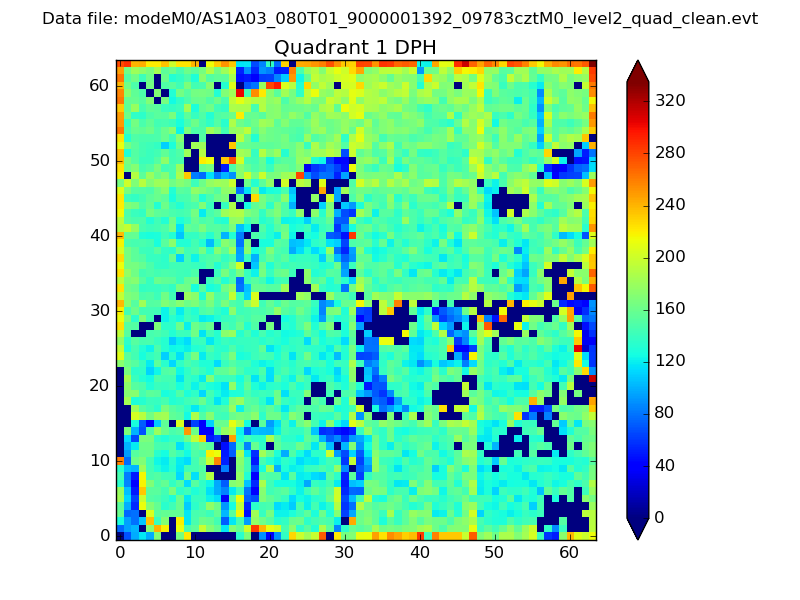 |
Quadrant B |
|---|---|---|---|
| Quadrant D | 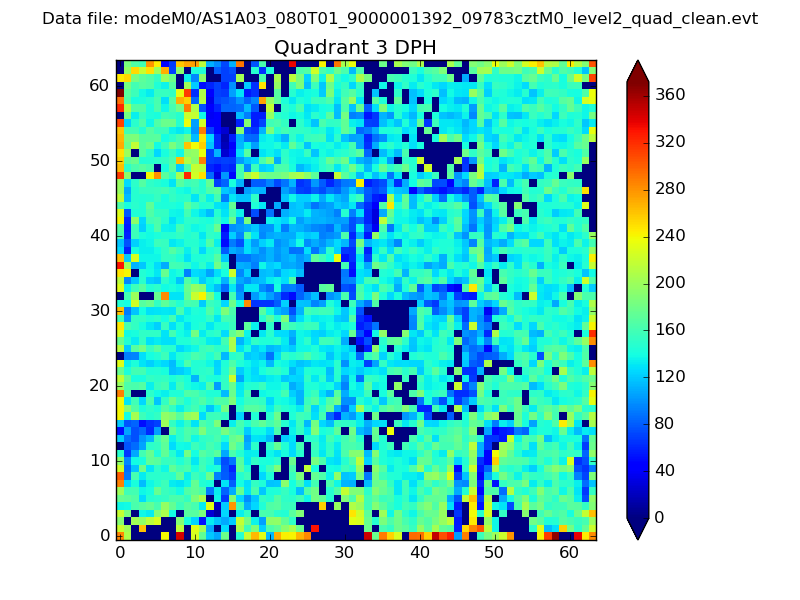 |
 |
Quadrant C |
| Plot type | Count rate plots | Images |
|---|---|---|
| Comparison with Poisson distribution Blue bars denote a histogram of data divided into 1 sec bins. Red curve is a Poisson curve with rate = median count rate of data. |
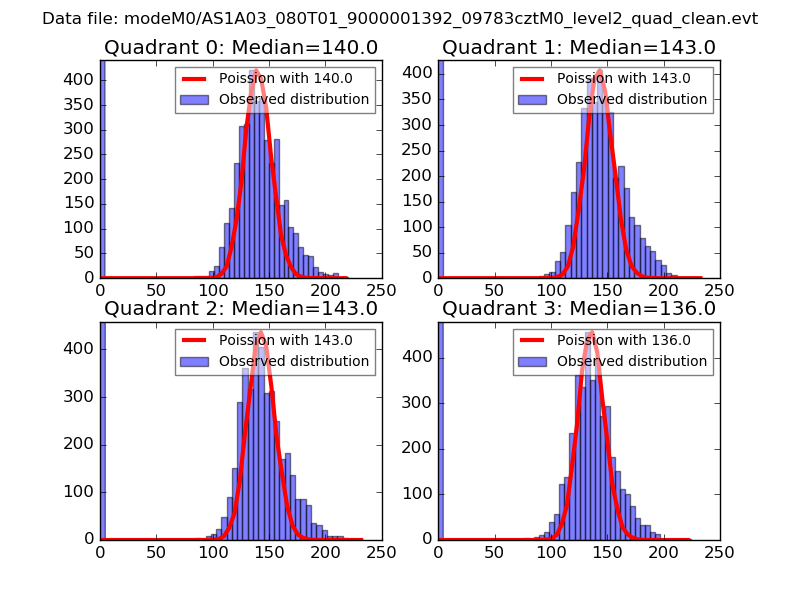 |
 |
| Quadrant-wise count rates Data is divided into 100 sec bins |
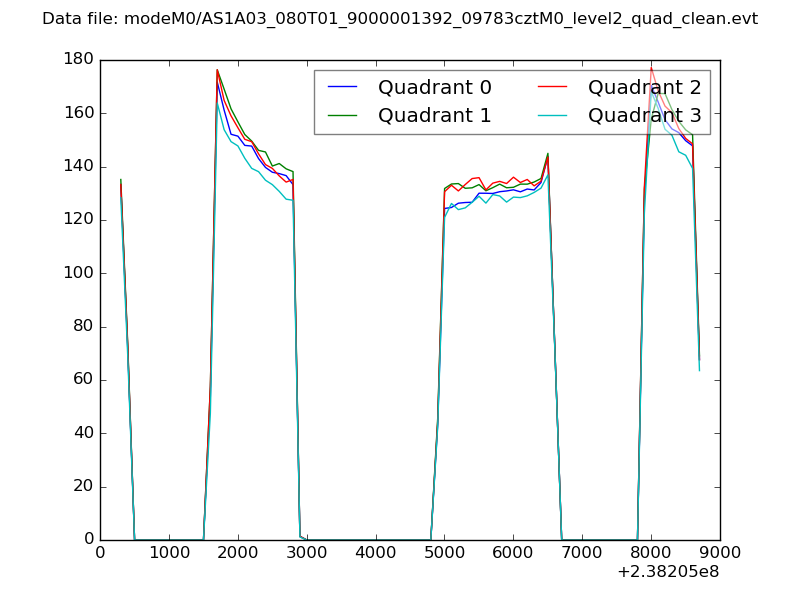 |
|
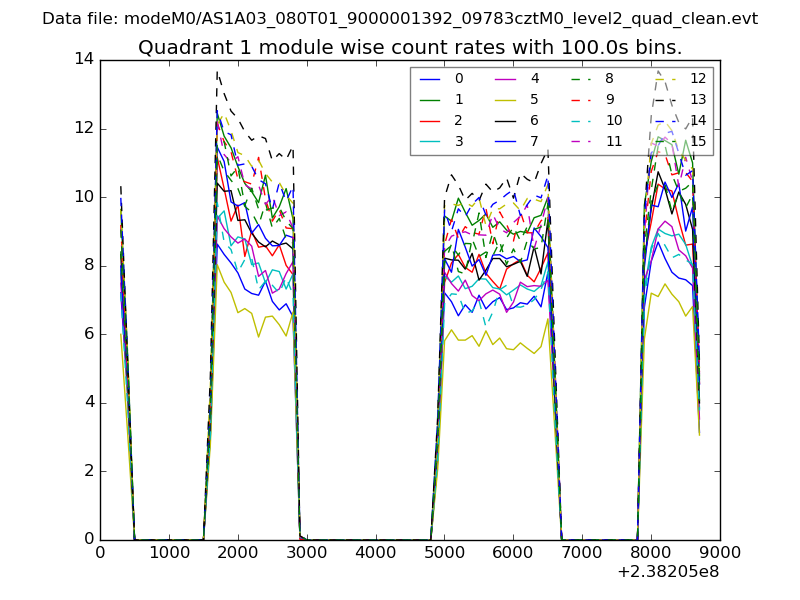
| Module-wise count rates for Quadrant A Data is divided into 100 sec bins |
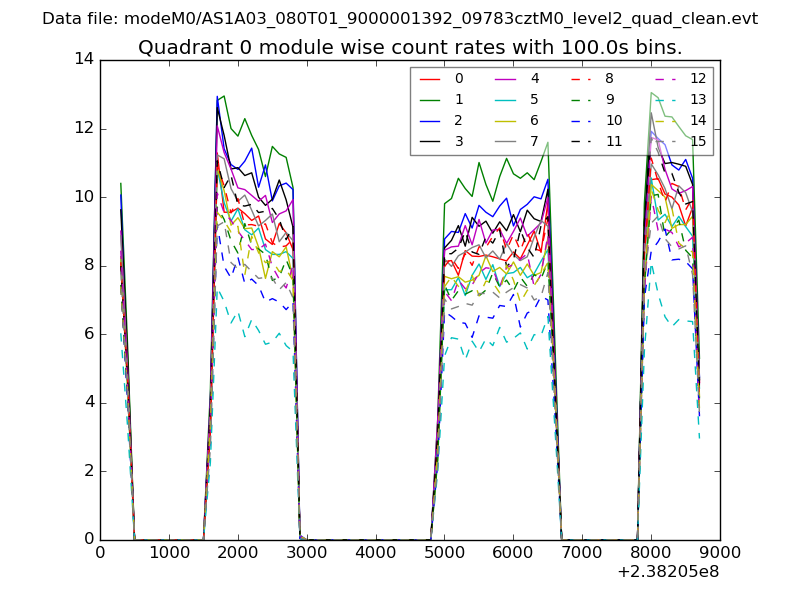 |
 |
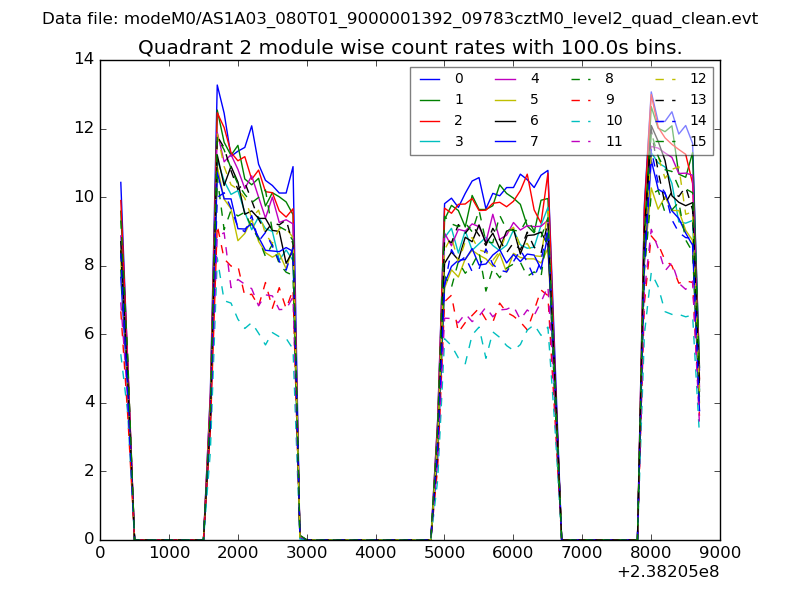
| Module-wise count rates for Quadrant B Data is divided into 100 sec bins |
 |
 |
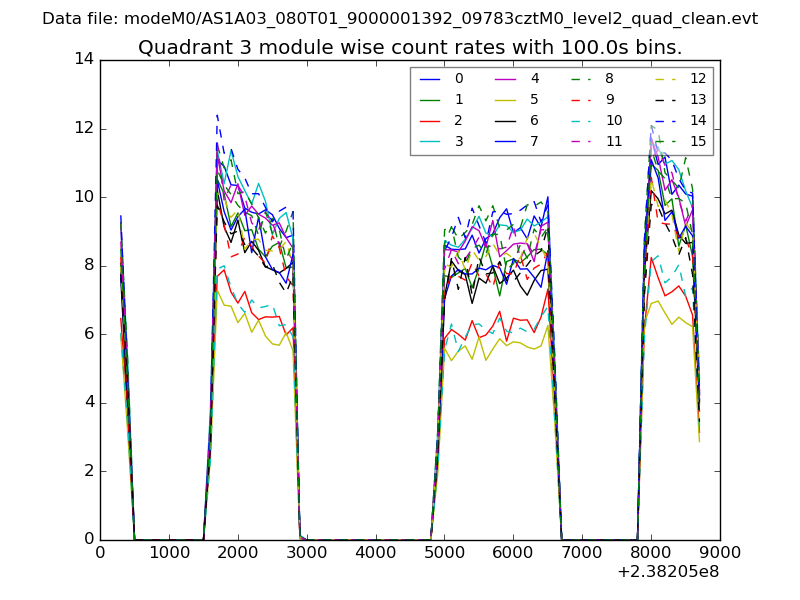
| Module-wise count rates for Quadrant C Data is divided into 100 sec bins |
 |
 |
| Module-wise count rates for Quadrant D Data is divided into 100 sec bins |
 |
 |
| Parameter | Plot |
|---|---|
| CZT HV Monitor | 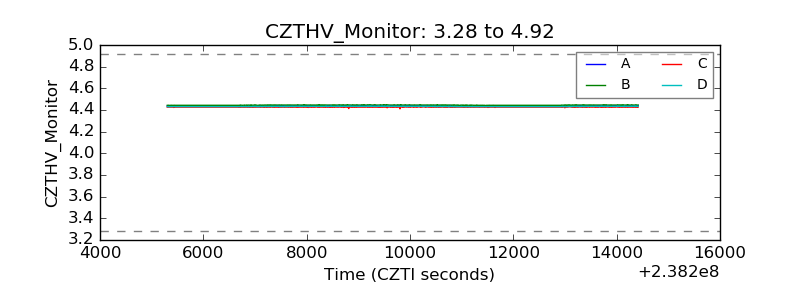 |
| D_VDD |  |
| Temperature 1 | 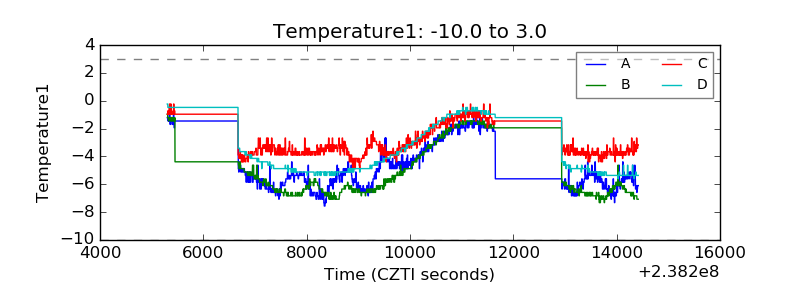 |
| Veto HV Monitor | 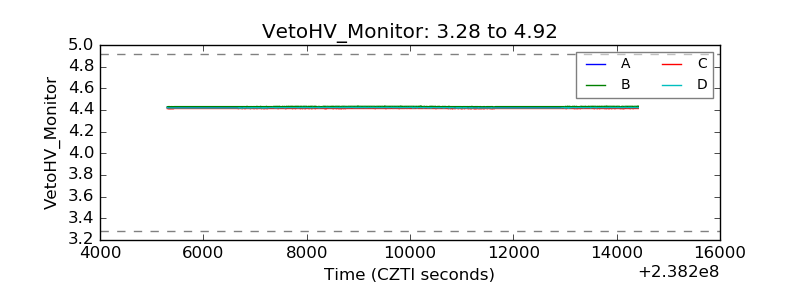 |
| Veto LLD | 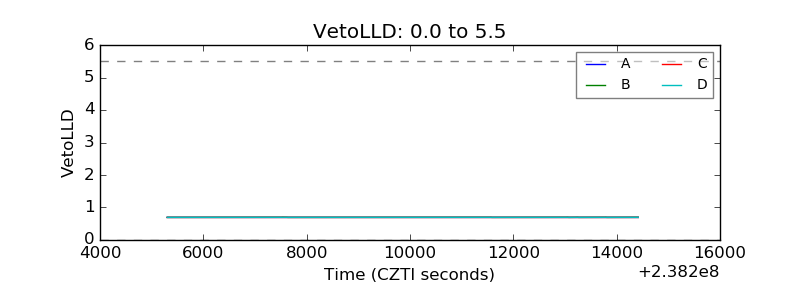 |
| Alpha Counter | 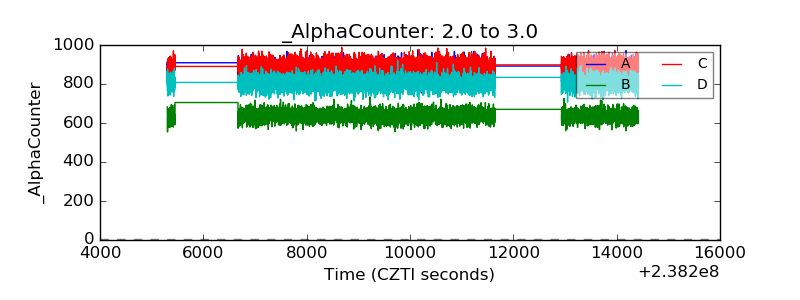 |
| _CPM_Rate | 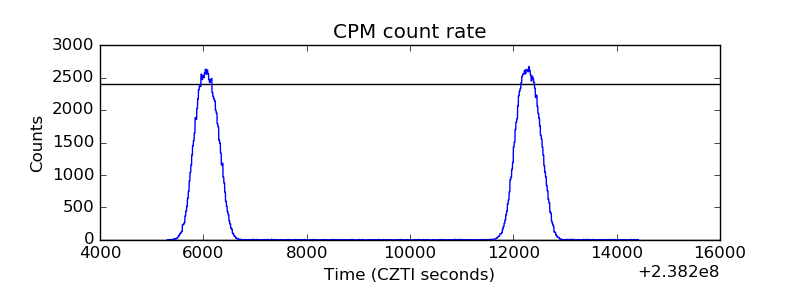 |
| CZT Counter |  |
| +2.5 Volts monitor |  |
| +5 Volts monitor |  |
| _ROLL_ROT | 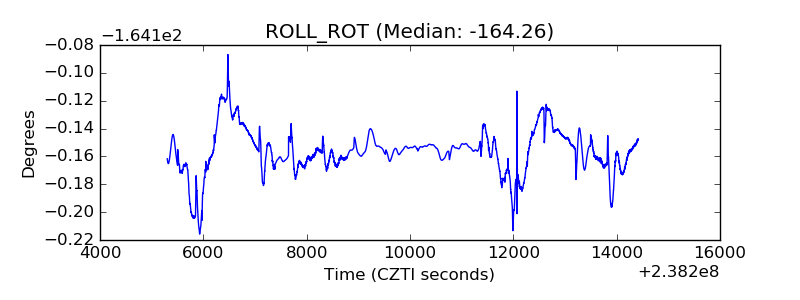 |
| _Roll_DEC | 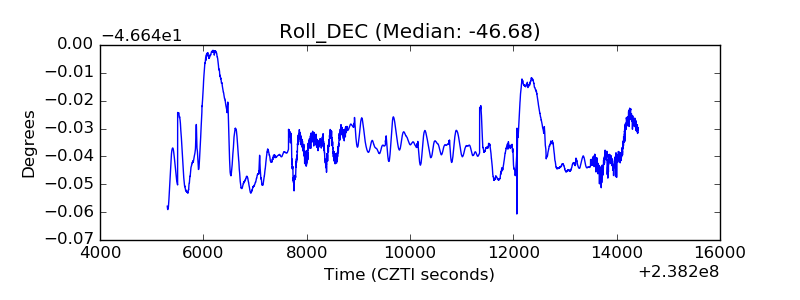 |
| _Roll_RA | 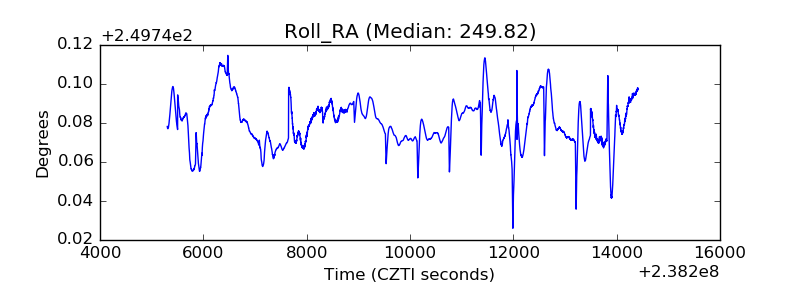 |
| Veto Counter | 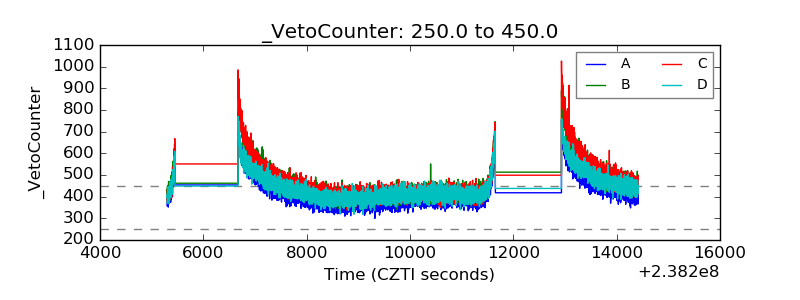 |