| Param | Original file | Final file |
|---|---|---|
| Filename | modeM0/AS1A03_080T01_9000001392_09784cztM0_level2.evt | modeM0/AS1A03_080T01_9000001392_09784cztM0_level2_quad_clean.evt |
| Size (bytes) | 442,676,160 | 76,564,800 |
| Size | 422.2 MB | 73.0 MB |
| Events in quadrant A | 3,053,336 | 467,298 |
| Events in quadrant B | 3,286,128 | 477,959 |
| Events in quadrant C | 3,130,934 | 479,708 |
| Events in quadrant D | 3,507,158 | 453,085 |
| Mode M0 | |||
|---|---|---|---|
| Quadrant | BADHDUFLAG | Total packets | Discarded packets |
| A | 0 | 12938 | 3 |
| B | 0 | 13553 | 2 |
| C | 0 | 13150 | 2 |
| D | 0 | 14618 | 2 |
| Mode M9 | |||
|---|---|---|---|
| Quadrant | BADHDUFLAG | Total packets | Discarded packets |
| A | 0 | 21 | 0 |
| B | 0 | 21 | 0 |
| C | 0 | 21 | 0 |
| D | 0 | 22 | 0 |
| Mode SS | |||
|---|---|---|---|
| Quadrant | BADHDUFLAG | Total packets | Discarded packets |
| A | 0 | 128 | 0 |
| B | 0 | 128 | 0 |
| C | 0 | 128 | 0 |
| D | 0 | 128 | 0 |
| Quadrant | Total seconds | Saturated seconds | Saturation percentage |
|---|---|---|---|
| A | 6311 | 34 | 0.538742% |
| B | 6311 | 89 | 1.410236% |
| C | 6311 | 46 | 0.728886% |
| D | 6311 | 91 | 1.441927% |
Noise dominated data is calculated using 1-second bins in cleaned event files. If a bin has >2000 counts, and if more than 50% of those come from <1% of pixels, then it is considered to be noise-dominated and hence unusable.
| Quadrant | # 1 sec bins | Bins with >0 counts | Bins with >2000 counts | High rate bins dominated by noise | Noise dominated (total time) | Noise dominated (detector-on time) | Marked lightcurve |
|---|---|---|---|---|---|---|---|
| A | 7641 | 6312 | 0 | 0 | 0.00% | 0.00% |  |
| B | 7641 | 6312 | 24 | 24 | 0.31% | 0.38% |  |
| C | 7641 | 6312 | 10 | 10 | 0.13% | 0.16% |  |
| D | 7641 | 6312 | 34 | 34 | 0.44% | 0.54% |  |
Top three noisy pixels from each quadrant. If the there are fewer than three noisy pixels in the level2.evt file, extra rows are filled as -1
| Pixel properties | Quadrant properties | ||||||
|---|---|---|---|---|---|---|---|
| Quadrant | DetID | PixID | Counts | Sigma | Mean | Median | Sigma |
| A | 13 | 251 | 13924 | 83.81 | 787 | 772 | 156.9 |
| A | 0 | 226 | 7314 | 41.69 | 787 | 772 | 156.9 |
| A | 12 | 194 | 6329 | 35.41 | 787 | 772 | 156.9 |
| B | 4 | 239 | 117944 | 789.58 | 798 | 781 | 148.4 |
| B | 0 | 214 | 27355 | 179.09 | 798 | 781 | 148.4 |
| B | 4 | 173 | 16138 | 103.49 | 798 | 781 | 148.4 |
| C | 14 | 234 | 74828 | 414.89 | 782 | 788 | 178.5 |
| C | 13 | 61 | 5948 | 28.91 | 782 | 788 | 178.5 |
| C | 14 | 67 | 2566 | 9.96 | 782 | 788 | 178.5 |
| D | 2 | 152 | 223733 | 1214.98 | 766 | 750 | 183.5 |
| D | 1 | 52 | 166000 | 900.41 | 766 | 750 | 183.5 |
| D | 2 | 14 | 105966 | 573.3 | 766 | 750 | 183.5 |
Histogram calculated using DETX and DETY for each event in the final _common_clean file
| Quadrant A | 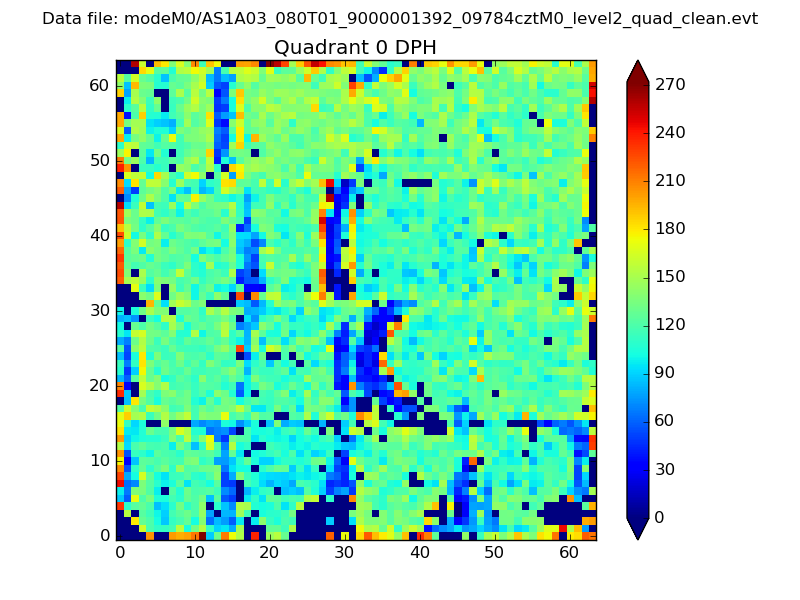 |
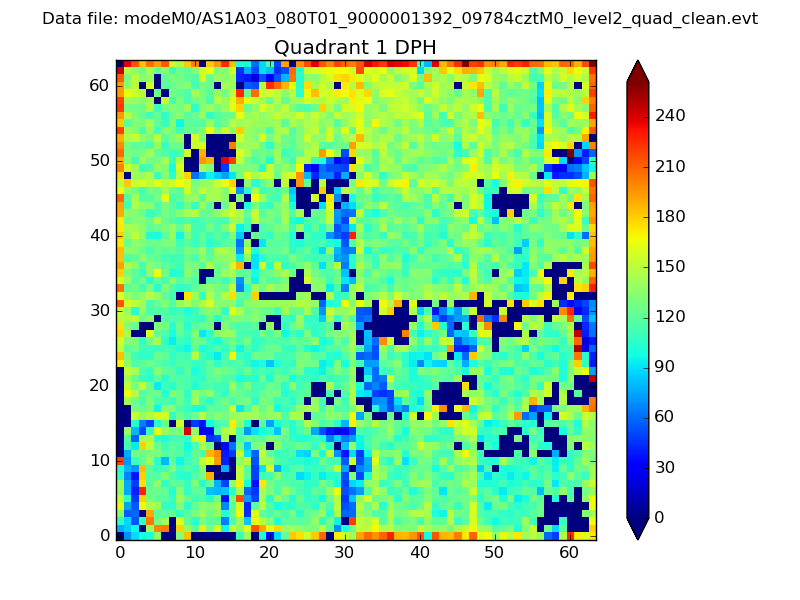 |
Quadrant B |
|---|---|---|---|
| Quadrant D | 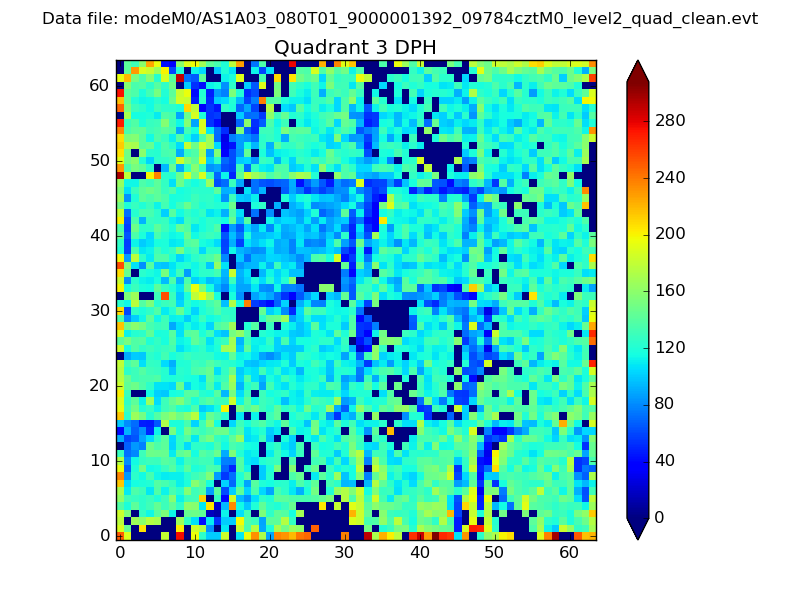 |
 |
Quadrant C |
| Plot type | Count rate plots | Images |
|---|---|---|
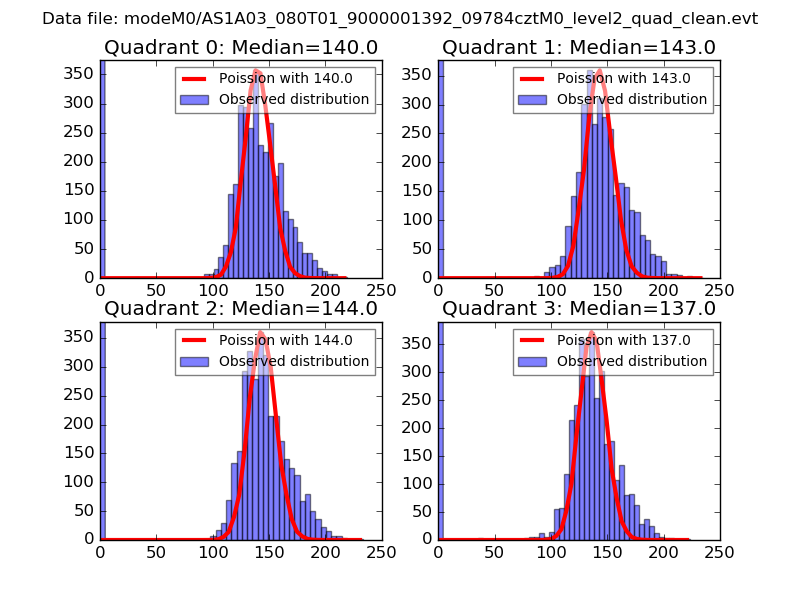
| Comparison with Poisson distribution Blue bars denote a histogram of data divided into 1 sec bins. Red curve is a Poisson curve with rate = median count rate of data. |
 |
 |
| Quadrant-wise count rates Data is divided into 100 sec bins |
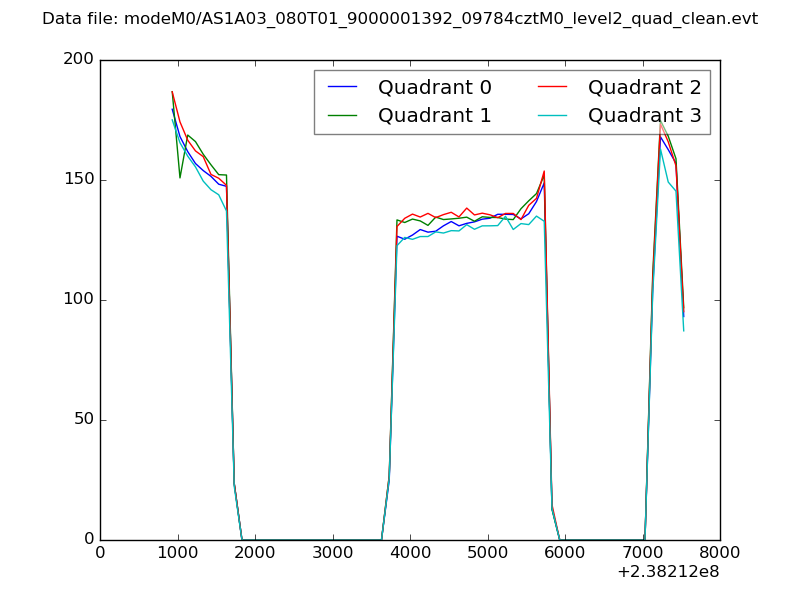 |
|
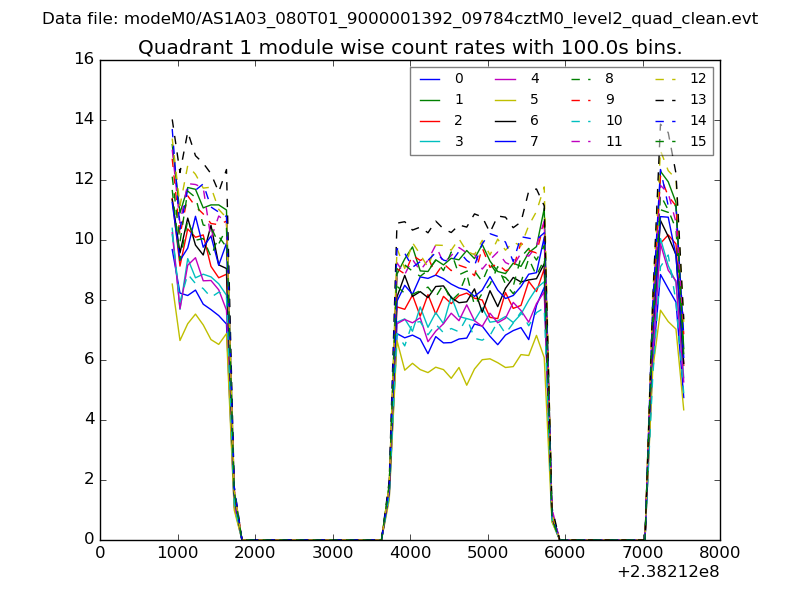
| Module-wise count rates for Quadrant A Data is divided into 100 sec bins |
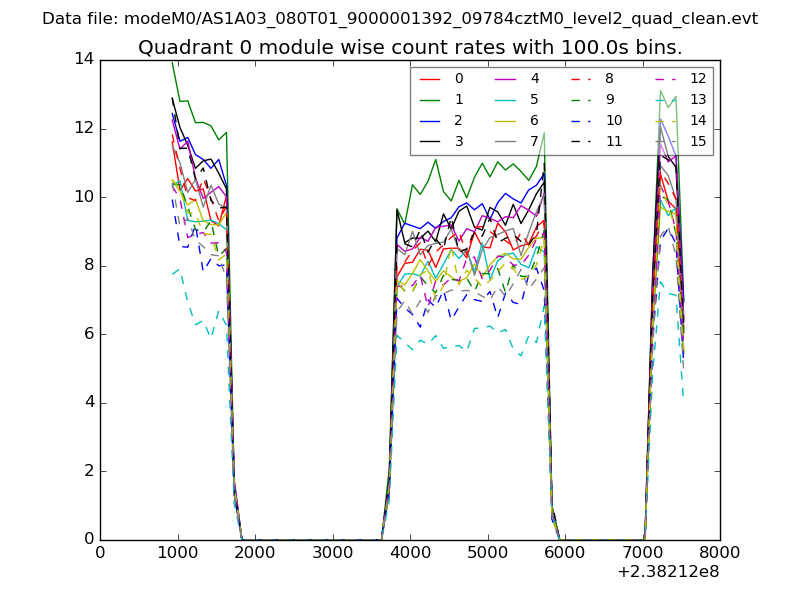 |
 |
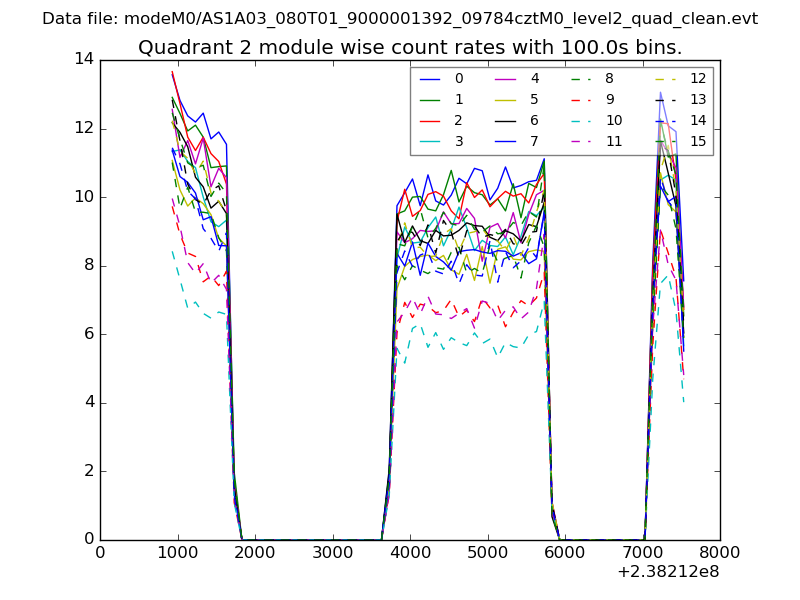
| Module-wise count rates for Quadrant B Data is divided into 100 sec bins |
 |
 |
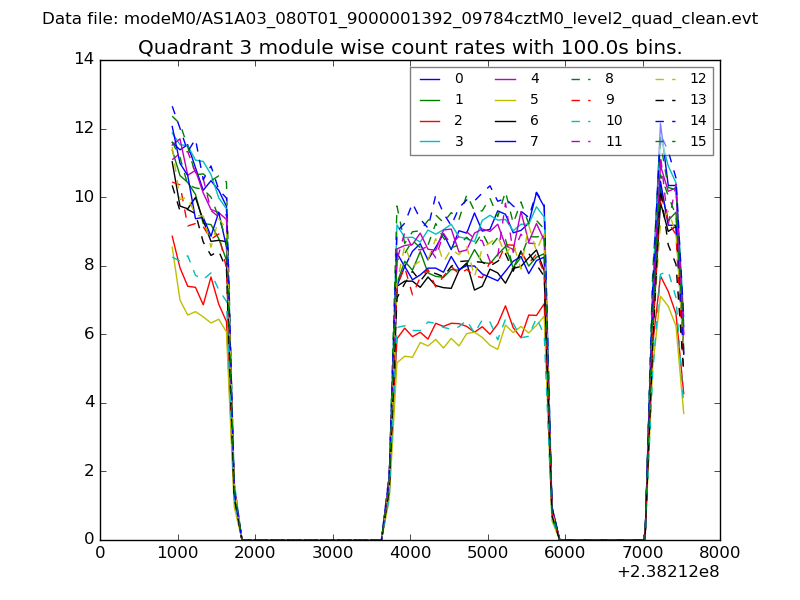
| Module-wise count rates for Quadrant C Data is divided into 100 sec bins |
 |
 |
| Module-wise count rates for Quadrant D Data is divided into 100 sec bins |
 |
 |
| Parameter | Plot |
|---|---|
| CZT HV Monitor |  |
| D_VDD | 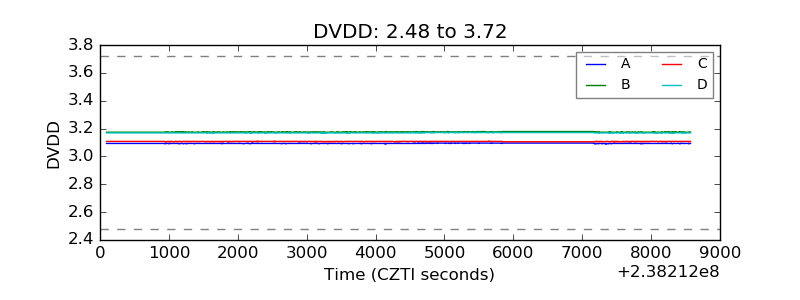 |
| Temperature 1 | 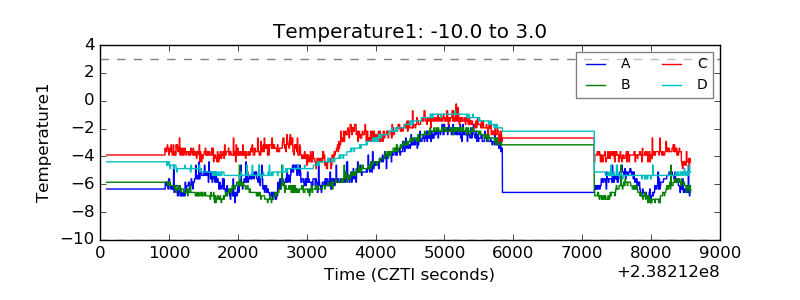 |
| Veto HV Monitor | 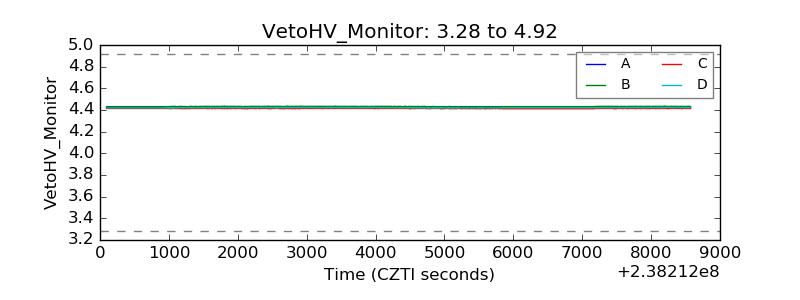 |
| Veto LLD | 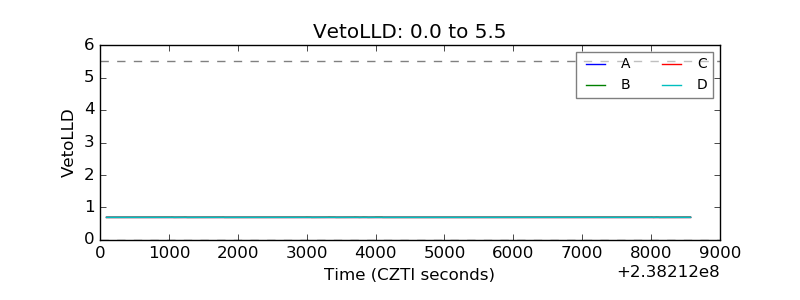 |
| Alpha Counter | 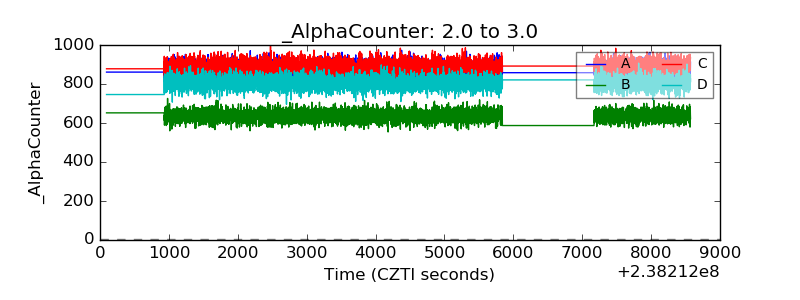 |
| _CPM_Rate | 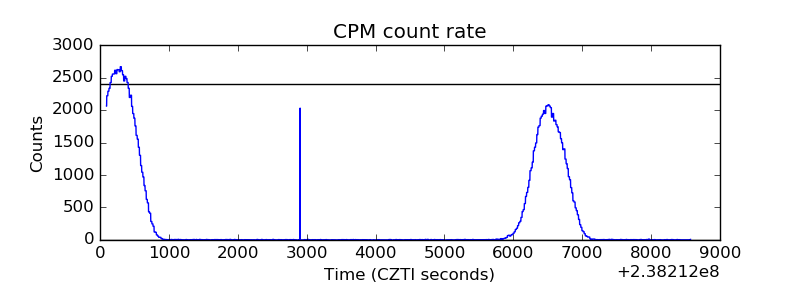 |
| CZT Counter |  |
| +2.5 Volts monitor |  |
| +5 Volts monitor | 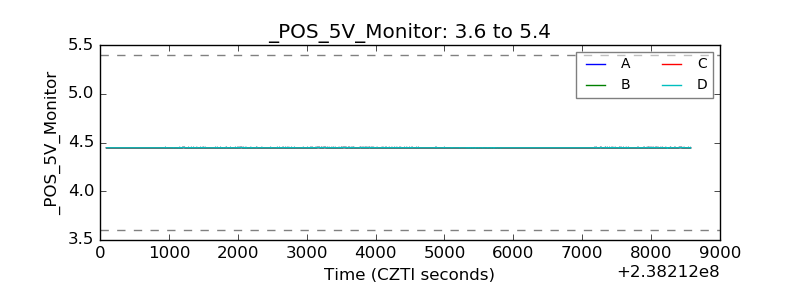 |
| _ROLL_ROT | 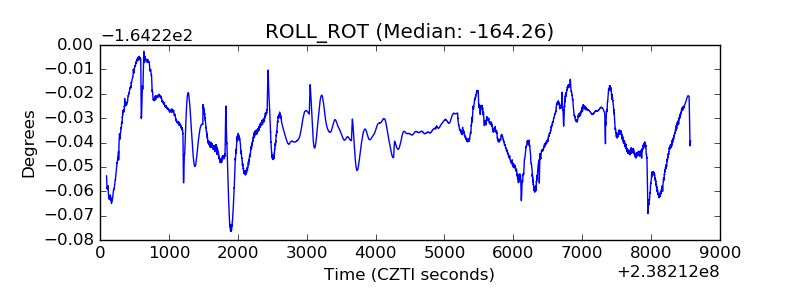 |
| _Roll_DEC | 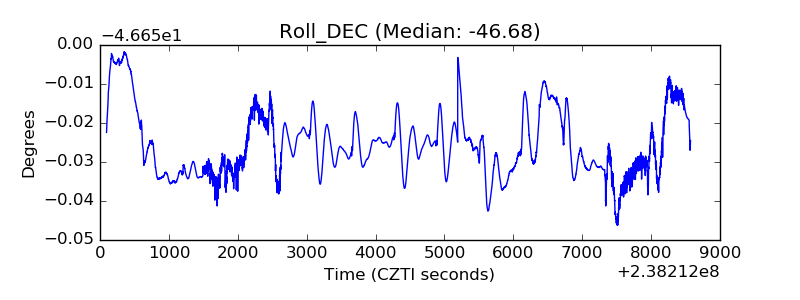 |
| _Roll_RA | 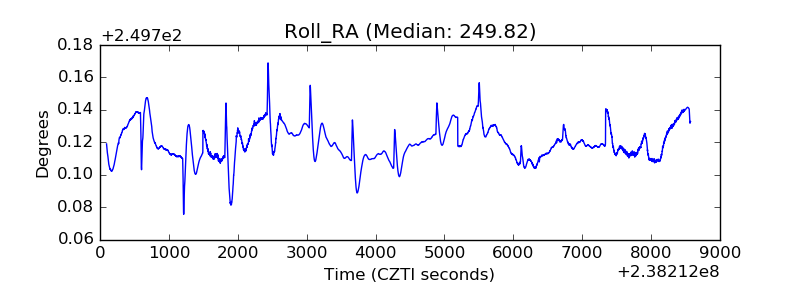 |
| Veto Counter | 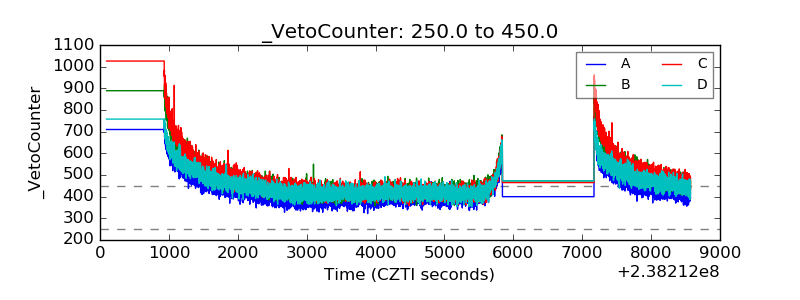 |