| Param | Original file | Final file |
|---|---|---|
| Filename | modeM0/AS1A03_080T01_9000001392_09785cztM0_level2.evt | modeM0/AS1A03_080T01_9000001392_09785cztM0_level2_quad_clean.evt |
| Size (bytes) | 446,022,720 | 66,911,040 |
| Size | 425.4 MB | 63.8 MB |
| Events in quadrant A | 3,008,397 | 395,709 |
| Events in quadrant B | 3,140,410 | 405,078 |
| Events in quadrant C | 3,051,238 | 404,955 |
| Events in quadrant D | 3,883,432 | 384,214 |
| Mode M0 | |||
|---|---|---|---|
| Quadrant | BADHDUFLAG | Total packets | Discarded packets |
| A | 0 | 12794 | 3 |
| B | 0 | 13070 | 2 |
| C | 0 | 12932 | 2 |
| D | 0 | 15627 | 2 |
| Mode M9 | |||
|---|---|---|---|
| Quadrant | BADHDUFLAG | Total packets | Discarded packets |
| A | 0 | 18 | 0 |
| B | 0 | 18 | 0 |
| C | 0 | 18 | 0 |
| D | 0 | 19 | 0 |
| Mode SS | |||
|---|---|---|---|
| Quadrant | BADHDUFLAG | Total packets | Discarded packets |
| A | 0 | 128 | 0 |
| B | 0 | 128 | 0 |
| C | 0 | 128 | 0 |
| D | 0 | 128 | 0 |
| Quadrant | Total seconds | Saturated seconds | Saturation percentage |
|---|---|---|---|
| A | 6240 | 61 | 0.977564% |
| B | 6240 | 78 | 1.250000% |
| C | 6240 | 66 | 1.057692% |
| D | 6240 | 131 | 2.099359% |
Noise dominated data is calculated using 1-second bins in cleaned event files. If a bin has >2000 counts, and if more than 50% of those come from <1% of pixels, then it is considered to be noise-dominated and hence unusable.
| Quadrant | # 1 sec bins | Bins with >0 counts | Bins with >2000 counts | High rate bins dominated by noise | Noise dominated (total time) | Noise dominated (detector-on time) | Marked lightcurve |
|---|---|---|---|---|---|---|---|
| A | 7530 | 6241 | 0 | 0 | 0.00% | 0.00% | 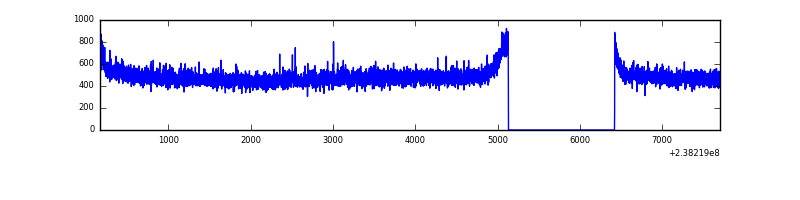 |
| B | 7530 | 6241 | 2 | 2 | 0.03% | 0.03% | 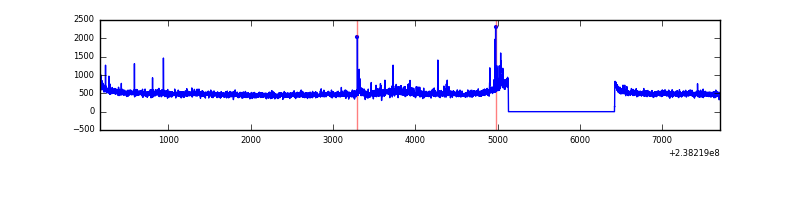 |
| C | 7530 | 6241 | 7 | 7 | 0.09% | 0.11% | 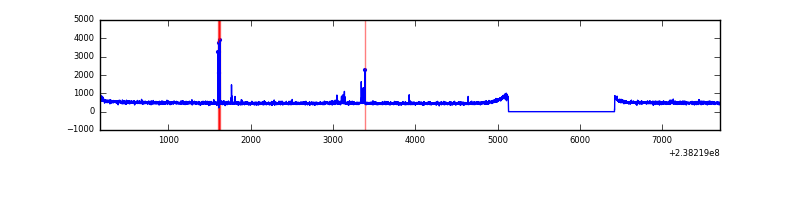 |
| D | 7530 | 6241 | 62 | 62 | 0.82% | 0.99% | 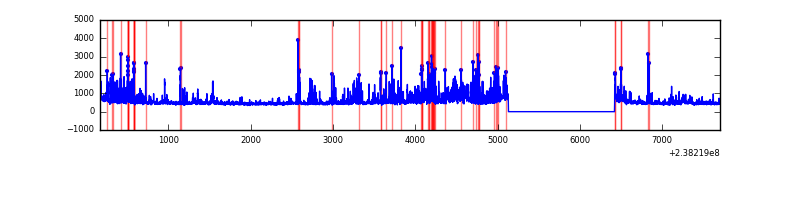 |
Top three noisy pixels from each quadrant. If the there are fewer than three noisy pixels in the level2.evt file, extra rows are filled as -1
| Pixel properties | Quadrant properties | ||||||
|---|---|---|---|---|---|---|---|
| Quadrant | DetID | PixID | Counts | Sigma | Mean | Median | Sigma |
| A | 8 | 15 | 7882 | 45.85 | 778 | 763 | 155.3 |
| A | 0 | 226 | 7178 | 41.32 | 778 | 763 | 155.3 |
| A | 15 | 239 | 6775 | 38.72 | 778 | 763 | 155.3 |
| B | 4 | 239 | 34556 | 231.17 | 784 | 766 | 146.2 |
| B | 0 | 187 | 30161 | 201.1 | 784 | 766 | 146.2 |
| B | 0 | 214 | 22756 | 150.44 | 784 | 766 | 146.2 |
| C | 14 | 234 | 49149 | 274.62 | 769 | 775 | 176.1 |
| C | 13 | 61 | 5816 | 28.62 | 769 | 775 | 176.1 |
| C | 14 | 67 | 3728 | 16.76 | 769 | 775 | 176.1 |
| D | 1 | 52 | 525514 | 2868.55 | 755 | 737 | 182.9 |
| D | 2 | 152 | 163273 | 888.46 | 755 | 737 | 182.9 |
| D | 1 | 239 | 131154 | 712.89 | 755 | 737 | 182.9 |
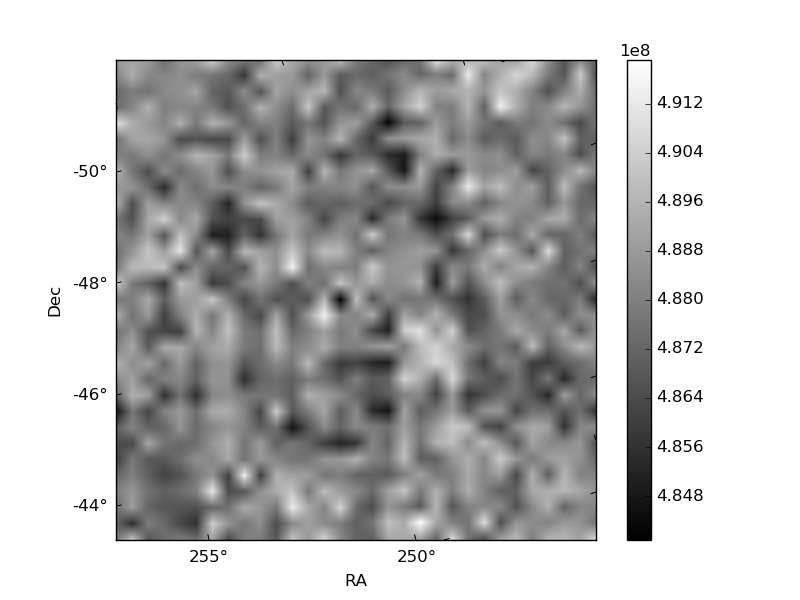
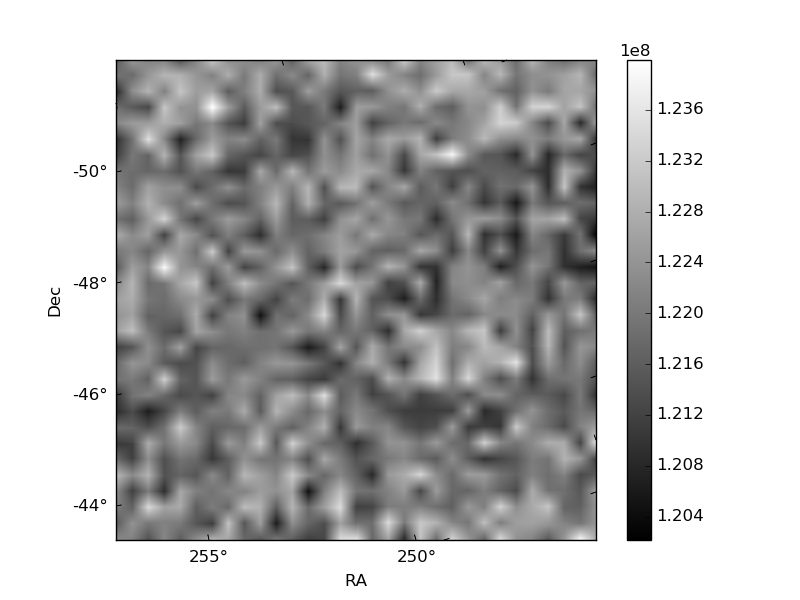
Histogram calculated using DETX and DETY for each event in the final _common_clean file
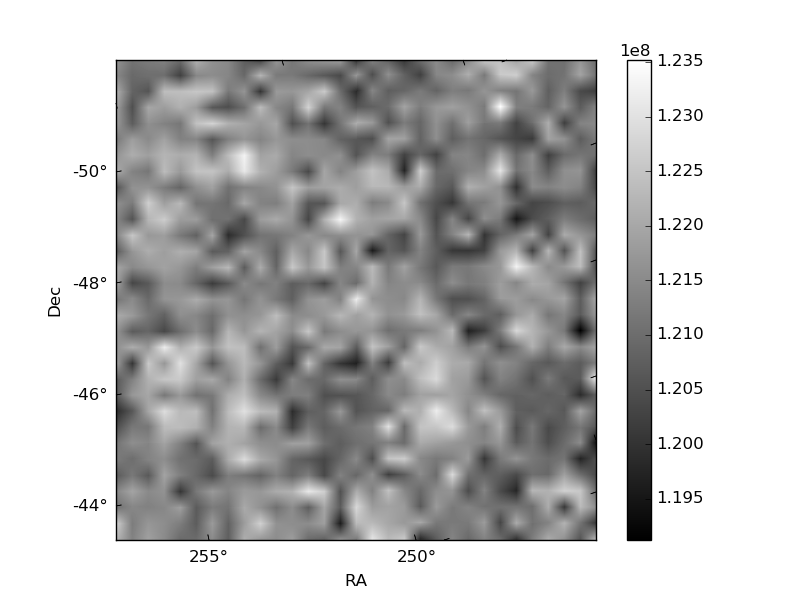
| Quadrant A |  |
 |
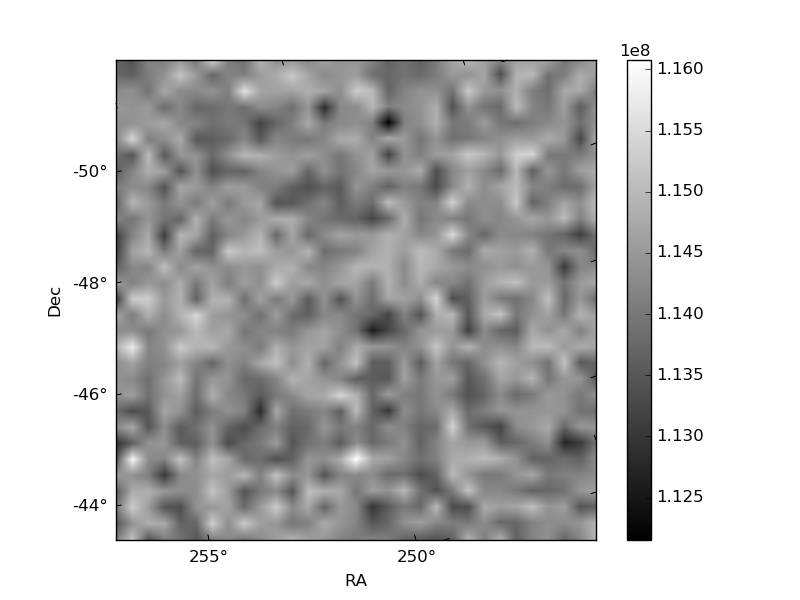
Quadrant B |
|---|---|---|---|
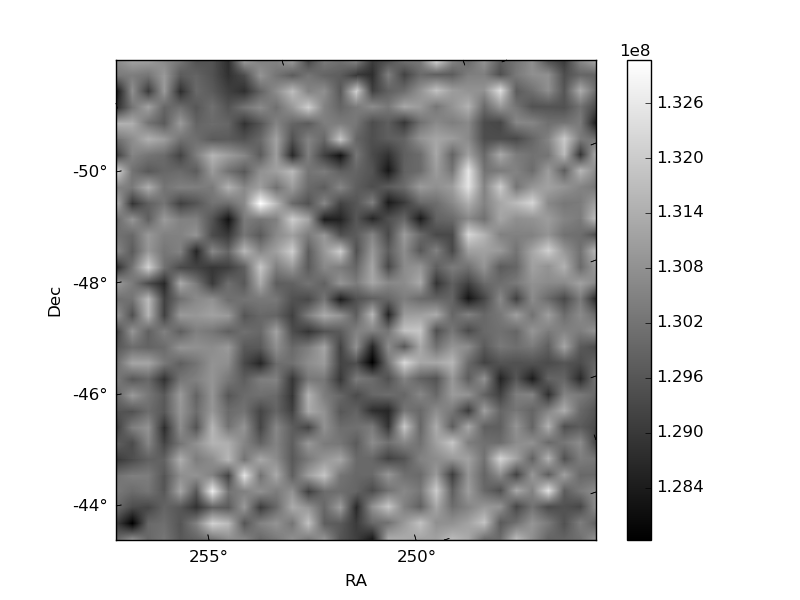
| Quadrant D |  |
 |
Quadrant C |
| Plot type | Count rate plots | Images |
|---|---|---|
| Comparison with Poisson distribution Blue bars denote a histogram of data divided into 1 sec bins. Red curve is a Poisson curve with rate = median count rate of data. |
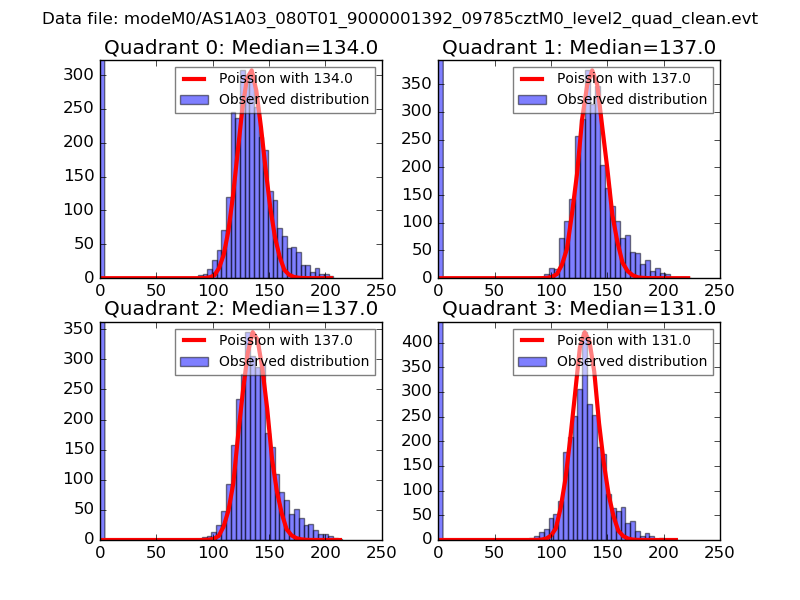 |
 |
| Quadrant-wise count rates Data is divided into 100 sec bins |
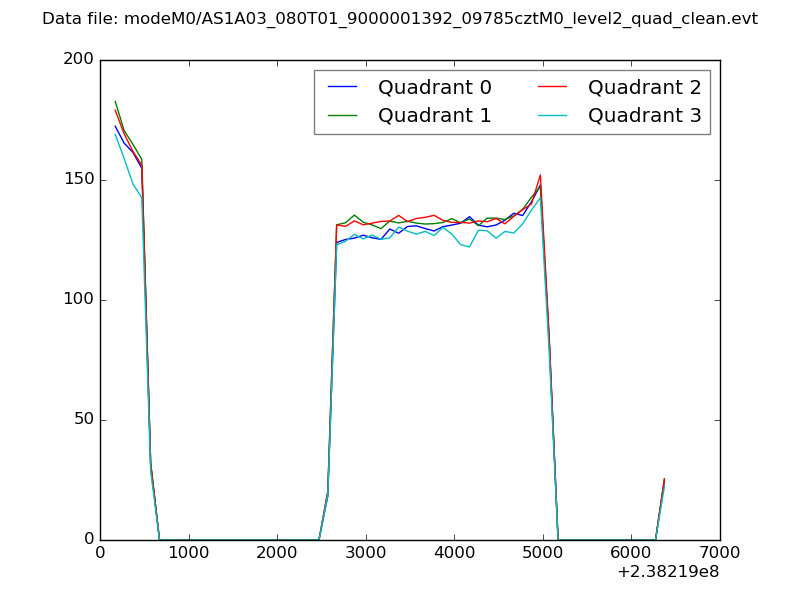 |
|
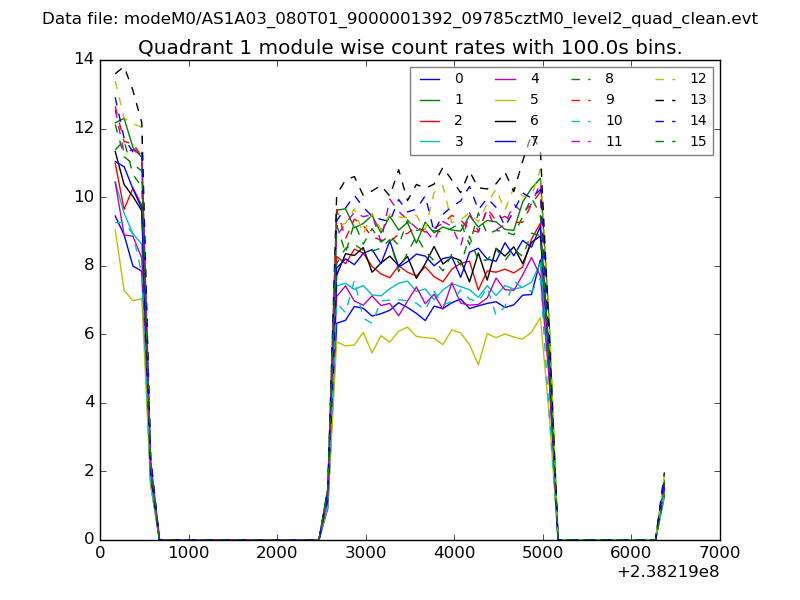
| Module-wise count rates for Quadrant A Data is divided into 100 sec bins |
 |
 |
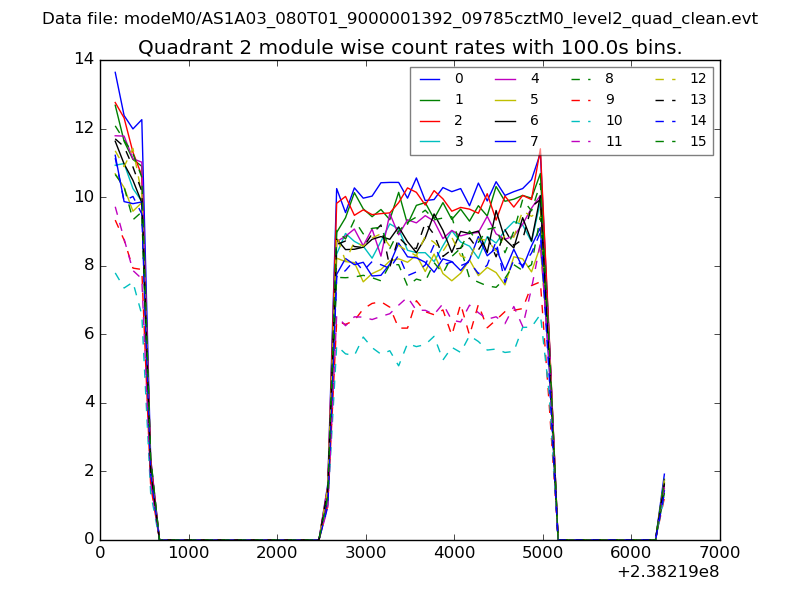
| Module-wise count rates for Quadrant B Data is divided into 100 sec bins |
 |
 |
| Module-wise count rates for Quadrant C Data is divided into 100 sec bins |
 |
 |
| Module-wise count rates for Quadrant D Data is divided into 100 sec bins |
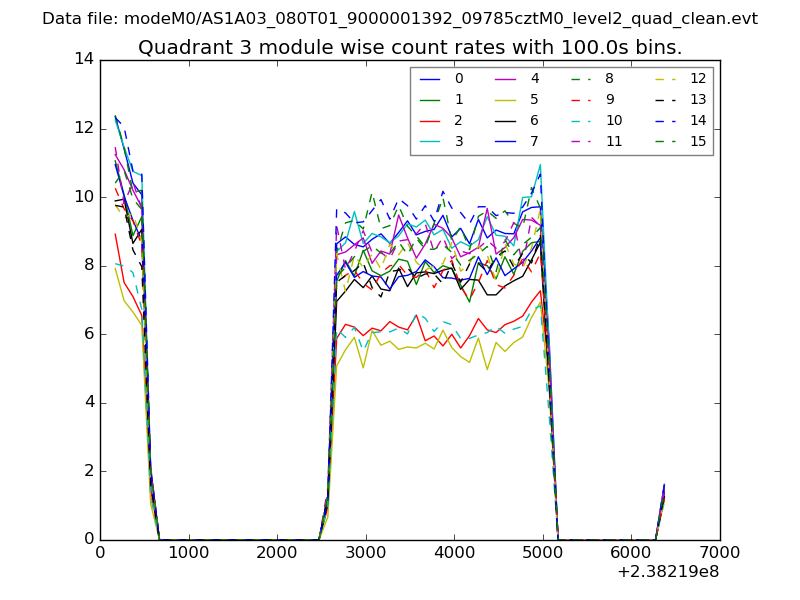 |
 |
| Parameter | Plot |
|---|---|
| CZT HV Monitor | 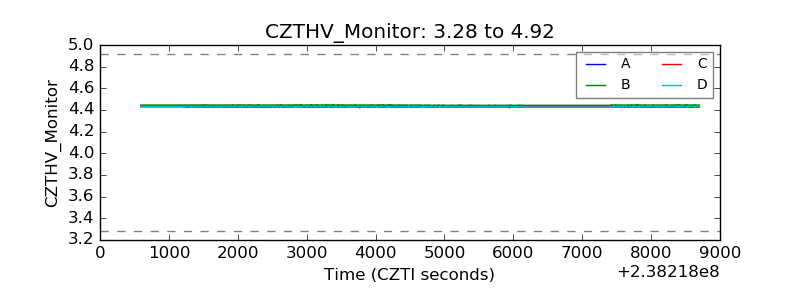 |
| D_VDD | 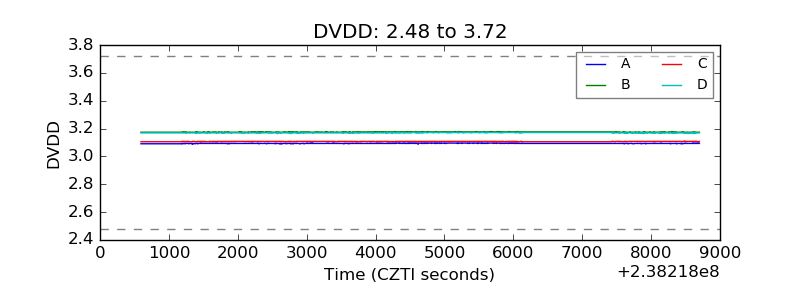 |
| Temperature 1 | 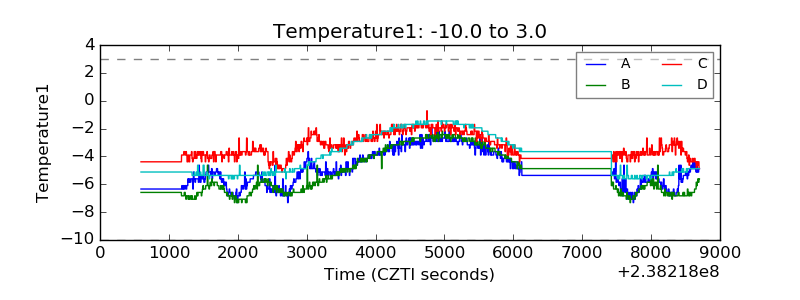 |
| Veto HV Monitor | 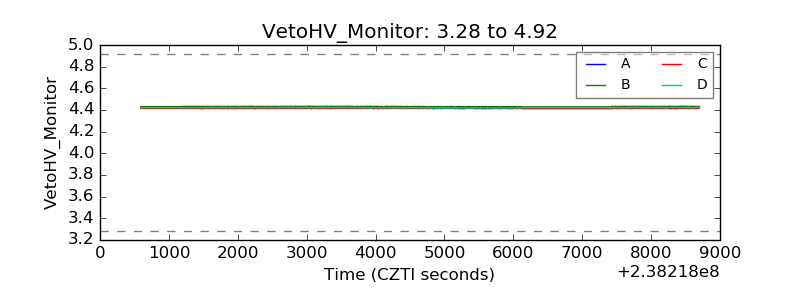 |
| Veto LLD | 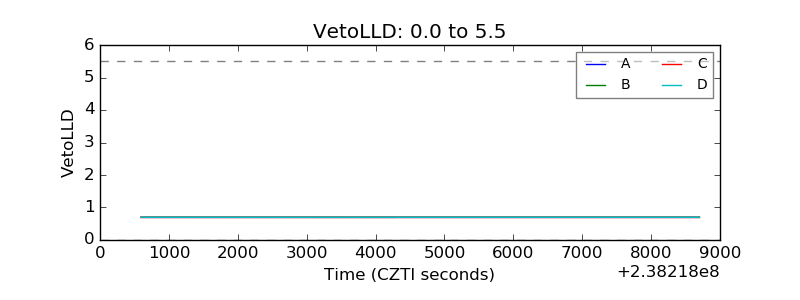 |
| Alpha Counter | 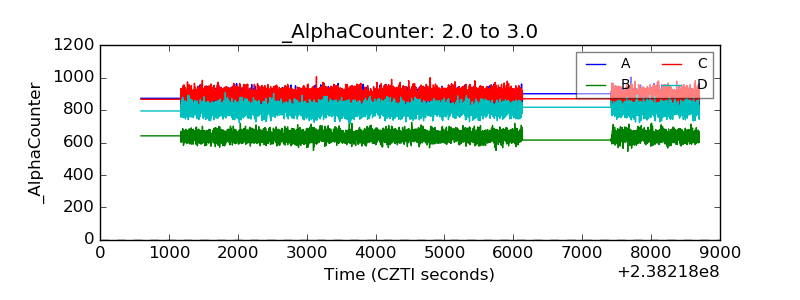 |
| _CPM_Rate | 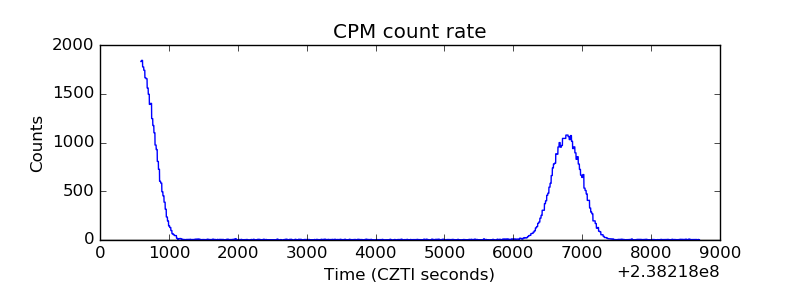 |
| CZT Counter |  |
| +2.5 Volts monitor |  |
| +5 Volts monitor |  |
| _ROLL_ROT | 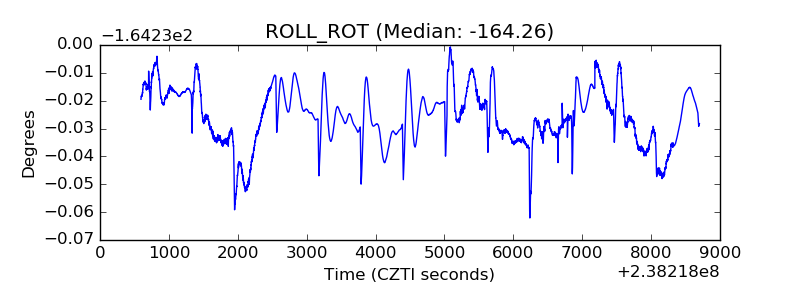 |
| _Roll_DEC | 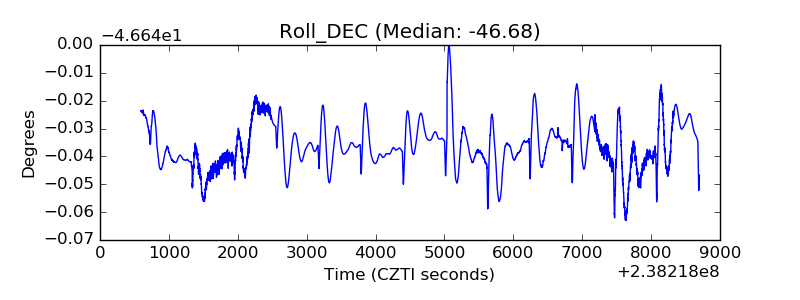 |
| _Roll_RA | 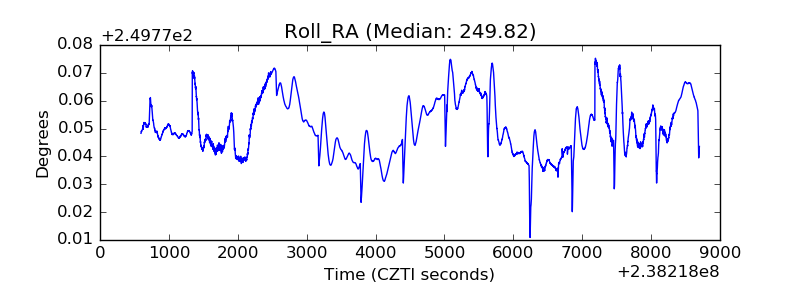 |
| Veto Counter | 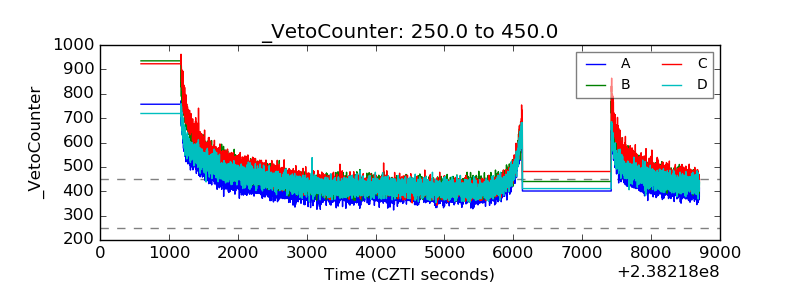 |