| Param | Original file | Final file |
|---|---|---|
| Filename | modeM0/AS1G05_218T01_9000001394_09787cztM0_level2.evt | modeM0/AS1G05_218T01_9000001394_09787cztM0_level2_quad_clean.evt |
| Size (bytes) | 454,276,800 | 72,262,080 |
| Size | 433.2 MB | 68.9 MB |
| Events in quadrant A | 3,115,695 | 432,896 |
| Events in quadrant B | 3,241,290 | 440,557 |
| Events in quadrant C | 3,071,032 | 431,818 |
| Events in quadrant D | 3,873,954 | 415,264 |
| Mode SS | |||
|---|---|---|---|
| Quadrant | BADHDUFLAG | Total packets | Discarded packets |
| A | 0 | 136 | 0 |
| B | 0 | 136 | 0 |
| C | 0 | 136 | 0 |
| D | 0 | 136 | 0 |
| Mode M0 | |||
|---|---|---|---|
| Quadrant | BADHDUFLAG | Total packets | Discarded packets |
| A | 0 | 13729 | 8 |
| B | 0 | 13907 | 3 |
| C | 0 | 13724 | 7 |
| D | 0 | 15952 | 7 |
| Mode M9 | |||
|---|---|---|---|
| Quadrant | BADHDUFLAG | Total packets | Discarded packets |
| A | 0 | 7 | 0 |
| B | 0 | 7 | 0 |
| C | 0 | 7 | 0 |
| D | 0 | 7 | 0 |
| Quadrant | Total seconds | Saturated seconds | Saturation percentage |
|---|---|---|---|
| A | 6705 | 103 | 1.536167% |
| B | 6706 | 122 | 1.819266% |
| C | 6704 | 68 | 1.014320% |
| D | 6704 | 162 | 2.416468% |
Noise dominated data is calculated using 1-second bins in cleaned event files. If a bin has >2000 counts, and if more than 50% of those come from <1% of pixels, then it is considered to be noise-dominated and hence unusable.
| Quadrant | # 1 sec bins | Bins with >0 counts | Bins with >2000 counts | High rate bins dominated by noise | Noise dominated (total time) | Noise dominated (detector-on time) | Marked lightcurve |
|---|---|---|---|---|---|---|---|
| A | 7414 | 6710 | 0 | 0 | 0.00% | 0.00% | 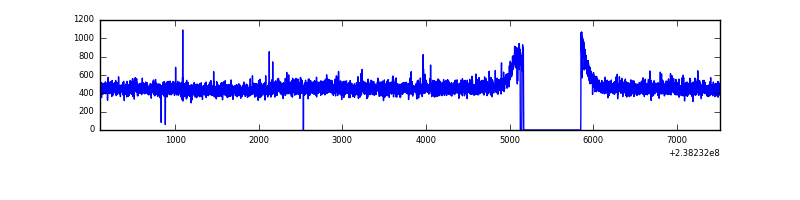 |
| B | 7414 | 6710 | 7 | 7 | 0.09% | 0.10% | 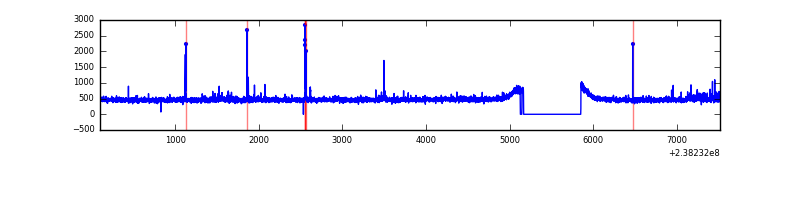 |
| C | 7414 | 6710 | 3 | 3 | 0.04% | 0.04% | 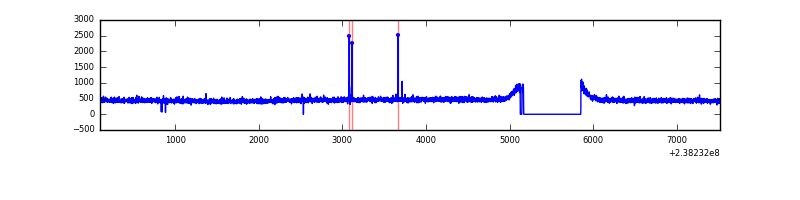 |
| D | 7414 | 6710 | 56 | 56 | 0.76% | 0.83% | 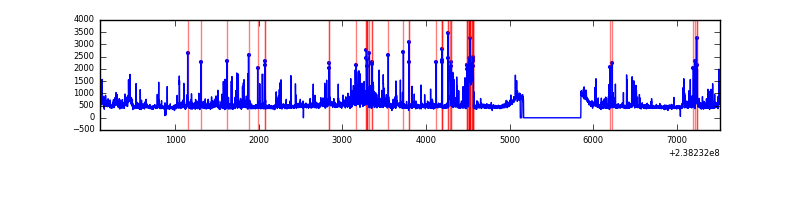 |
Top three noisy pixels from each quadrant. If the there are fewer than three noisy pixels in the level2.evt file, extra rows are filled as -1
| Pixel properties | Quadrant properties | ||||||
|---|---|---|---|---|---|---|---|
| Quadrant | DetID | PixID | Counts | Sigma | Mean | Median | Sigma |
| A | 0 | 226 | 7431 | 40.15 | 807 | 787 | 165.5 |
| A | 12 | 194 | 6600 | 35.13 | 807 | 787 | 165.5 |
| A | 13 | 253 | 5246 | 26.95 | 807 | 787 | 165.5 |
| B | 0 | 214 | 53735 | 338.94 | 807 | 788 | 156.2 |
| B | 4 | 239 | 34651 | 216.77 | 807 | 788 | 156.2 |
| B | 12 | 111 | 17621 | 107.76 | 807 | 788 | 156.2 |
| C | 14 | 234 | 19508 | 102.7 | 781 | 786 | 182.3 |
| C | 13 | 61 | 5841 | 27.73 | 781 | 786 | 182.3 |
| C | 8 | 222 | 4283 | 19.18 | 781 | 786 | 182.3 |
| D | 1 | 52 | 525403 | 2684.05 | 778 | 757 | 195.5 |
| D | 2 | 152 | 254319 | 1297.21 | 778 | 757 | 195.5 |
| D | 2 | 14 | 91775 | 465.64 | 778 | 757 | 195.5 |
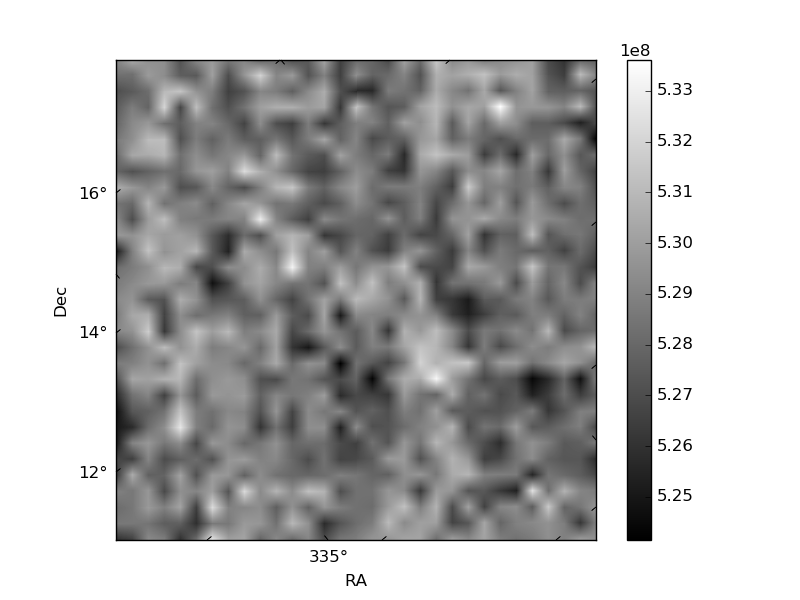
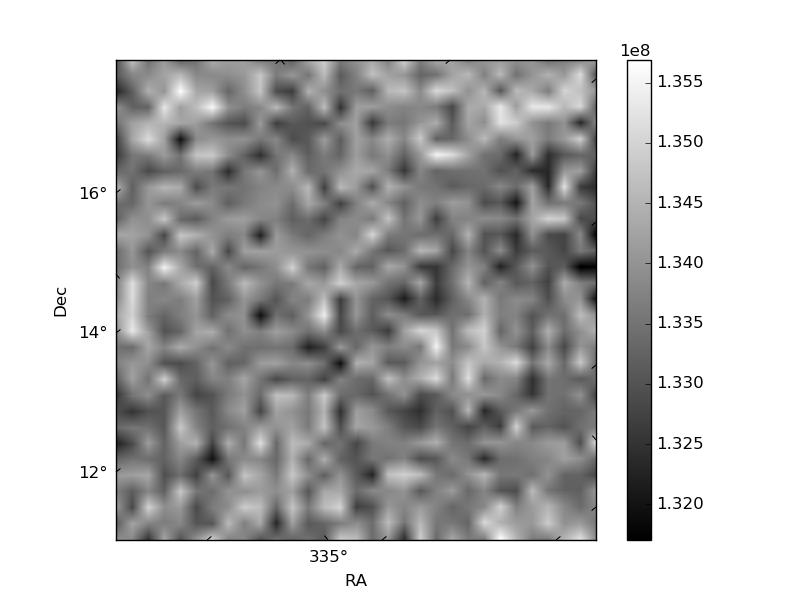
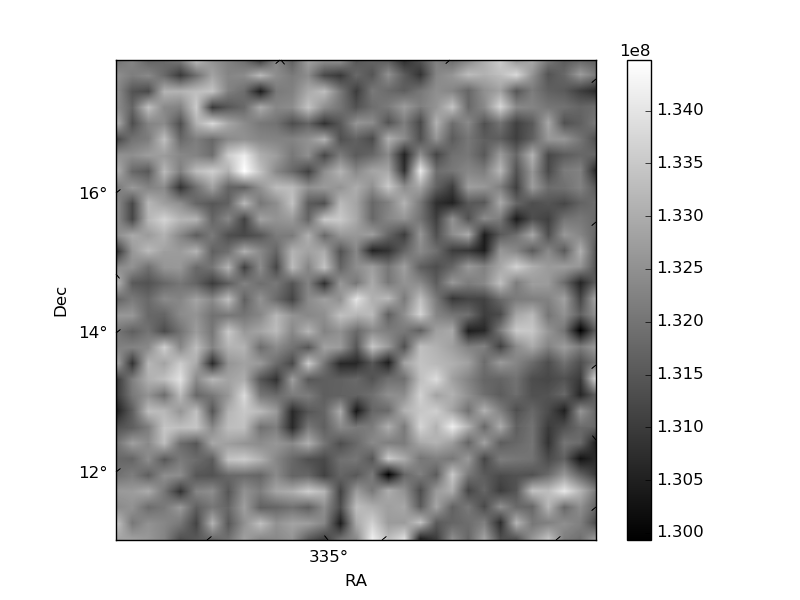
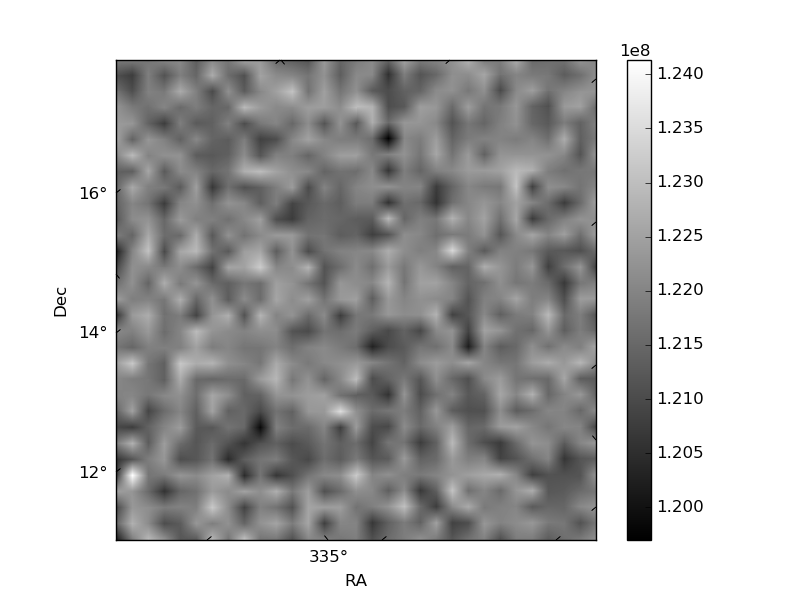
Histogram calculated using DETX and DETY for each event in the final _common_clean file
| Quadrant A | 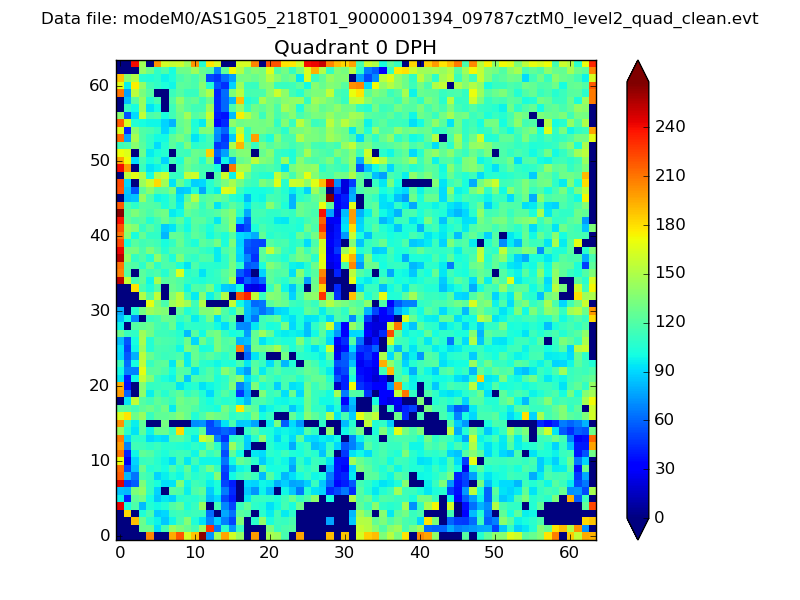 |
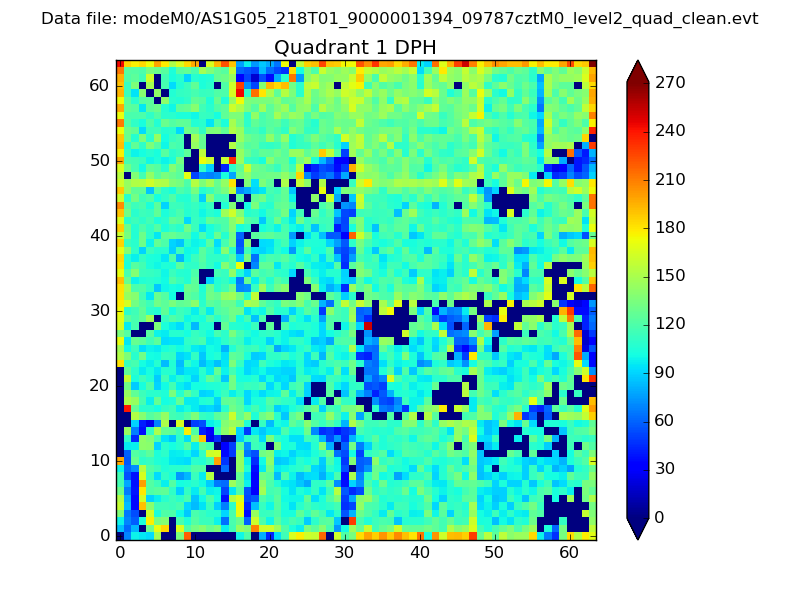 |
Quadrant B |
|---|---|---|---|
| Quadrant D | 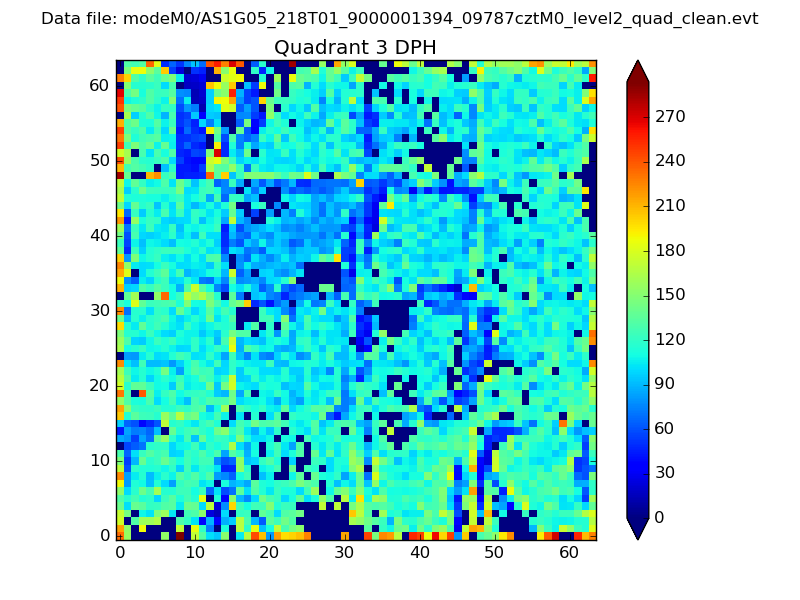 |
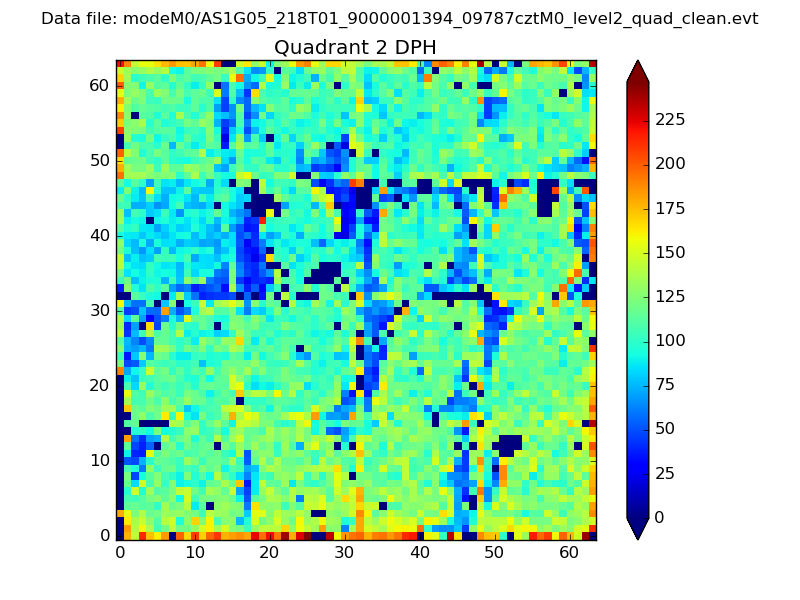 |
Quadrant C |
| Plot type | Count rate plots | Images |
|---|---|---|
| Comparison with Poisson distribution Blue bars denote a histogram of data divided into 1 sec bins. Red curve is a Poisson curve with rate = median count rate of data. |
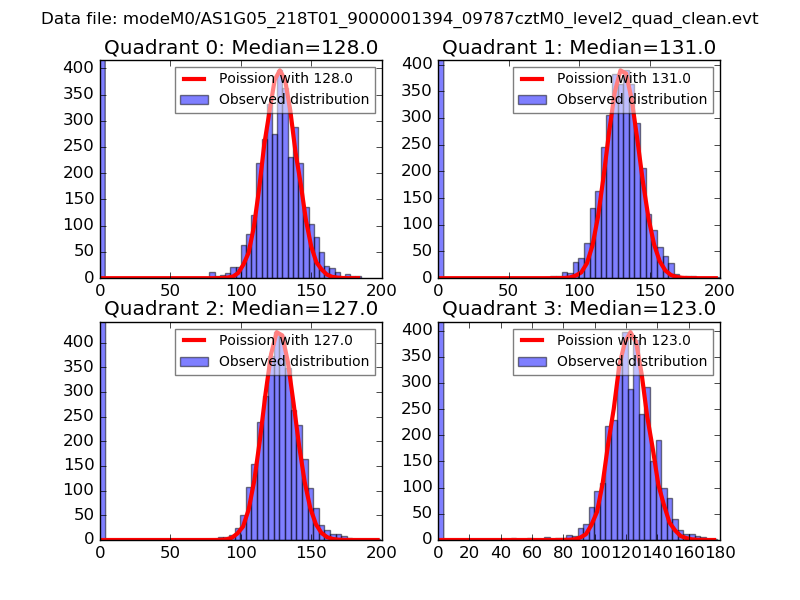 |
 |
| Quadrant-wise count rates Data is divided into 100 sec bins |
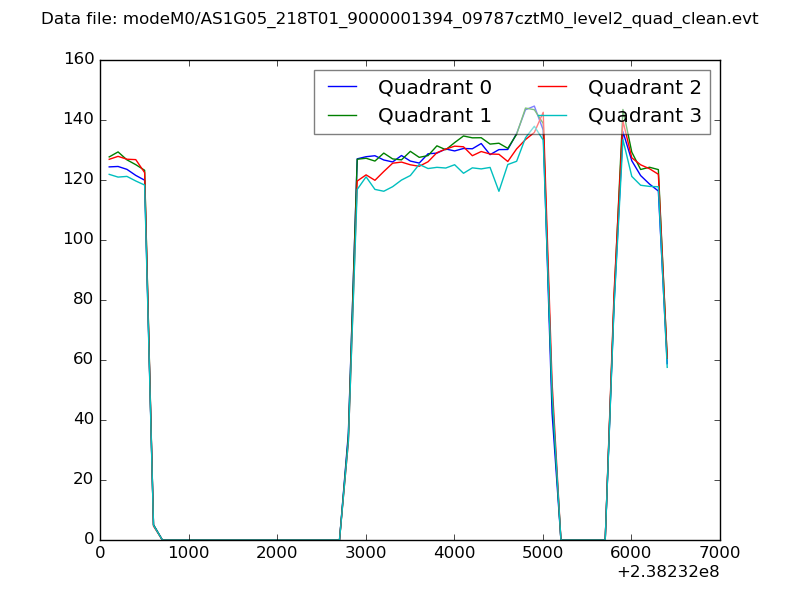 |
|
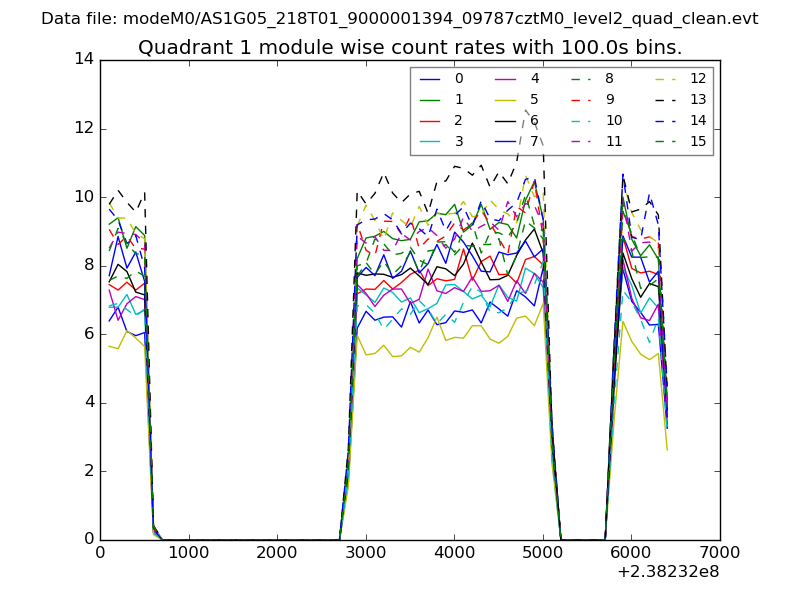
| Module-wise count rates for Quadrant A Data is divided into 100 sec bins |
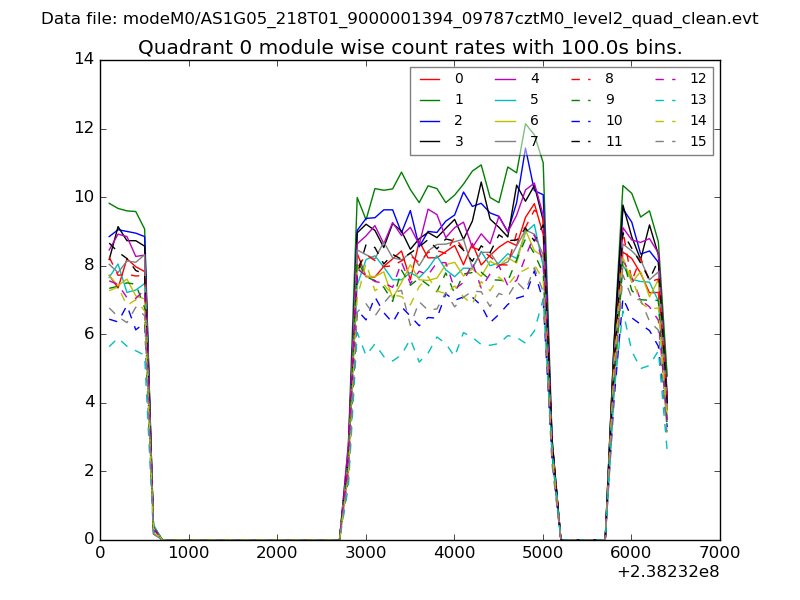 |
 |
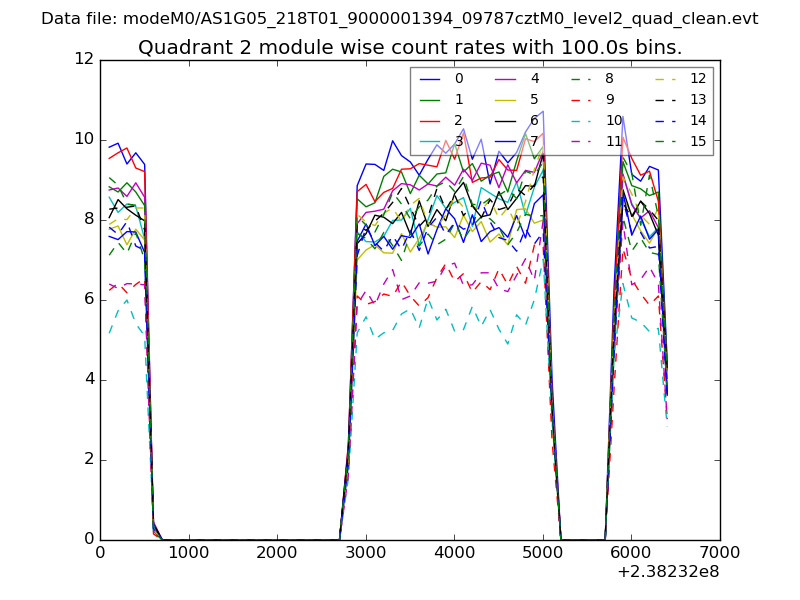
| Module-wise count rates for Quadrant B Data is divided into 100 sec bins |
 |
 |
| Module-wise count rates for Quadrant C Data is divided into 100 sec bins |
 |
 |
| Module-wise count rates for Quadrant D Data is divided into 100 sec bins |
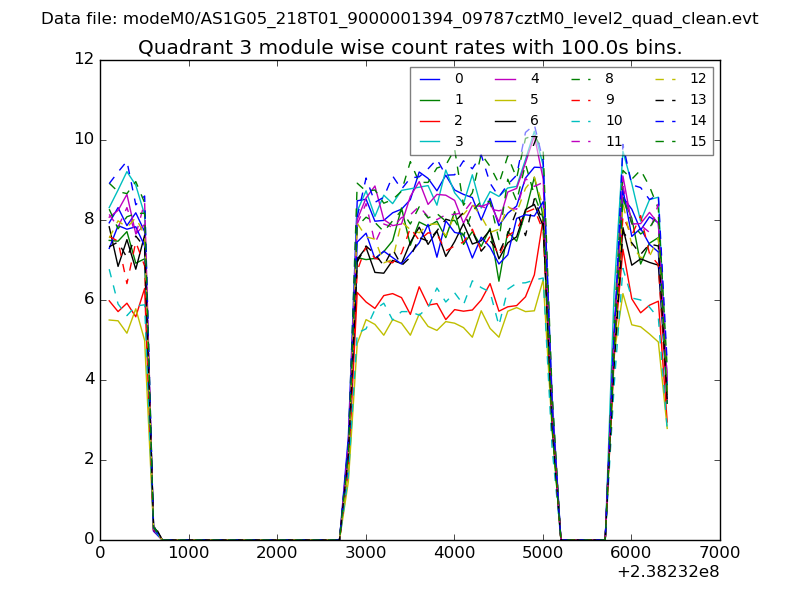 |
 |
| Parameter | Plot |
|---|---|
| CZT HV Monitor | 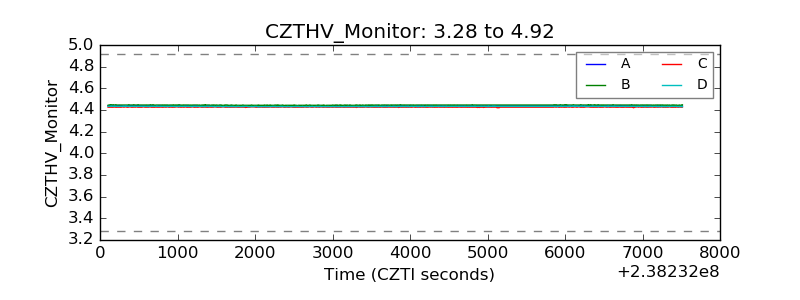 |
| D_VDD | 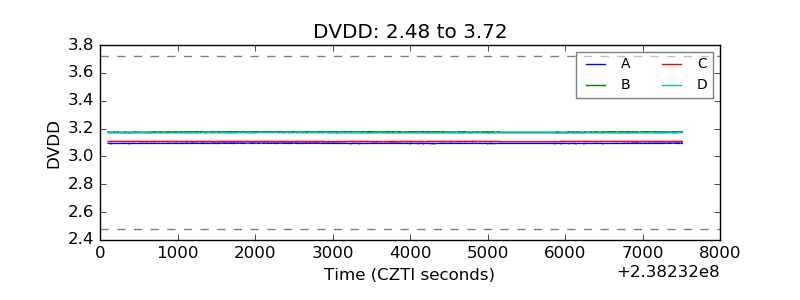 |
| Temperature 1 | 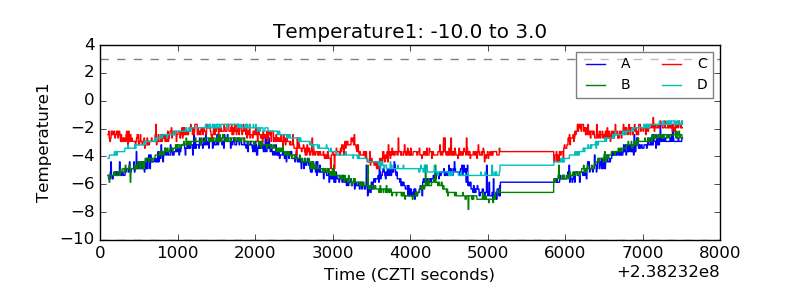 |
| Veto HV Monitor | 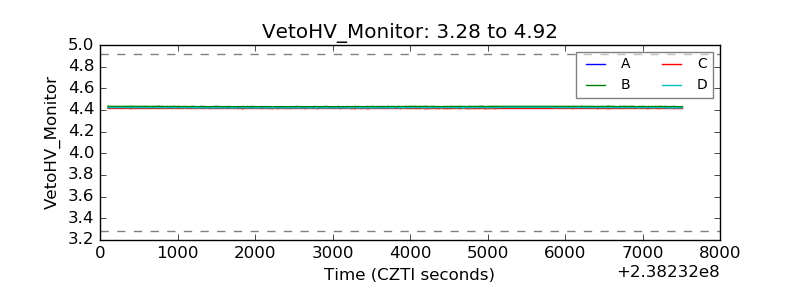 |
| Veto LLD | 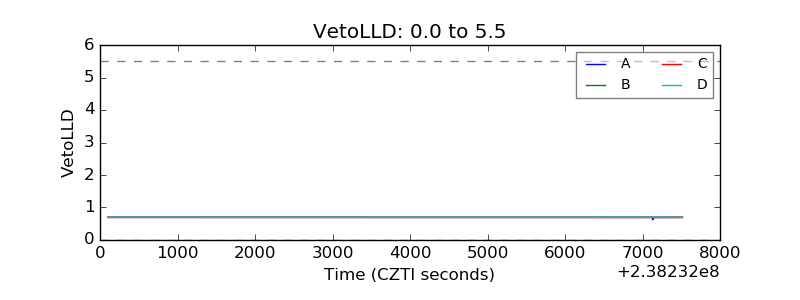 |
| Alpha Counter | 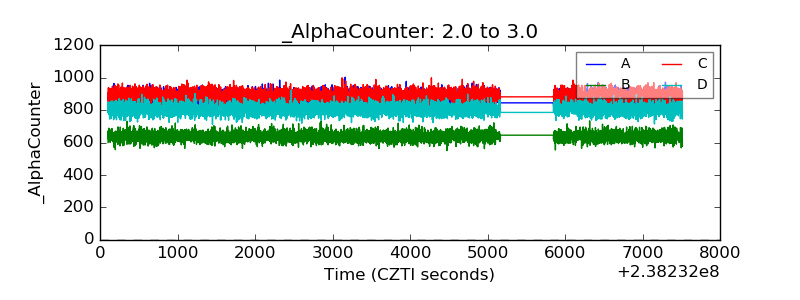 |
| _CPM_Rate | 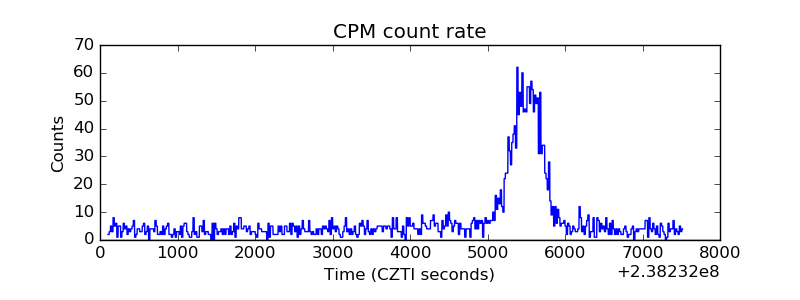 |
| CZT Counter | 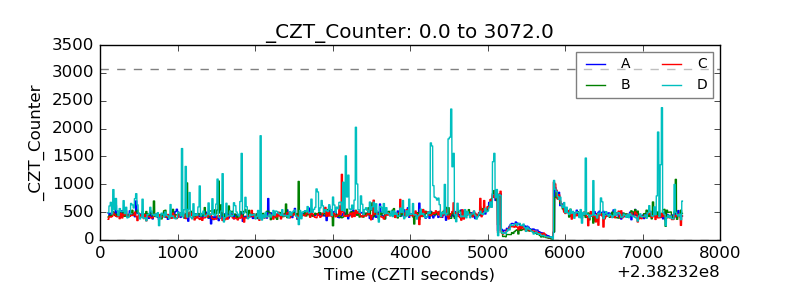 |
| +2.5 Volts monitor |  |
| +5 Volts monitor |  |
| _ROLL_ROT |  |
| _Roll_DEC |  |
| _Roll_RA | 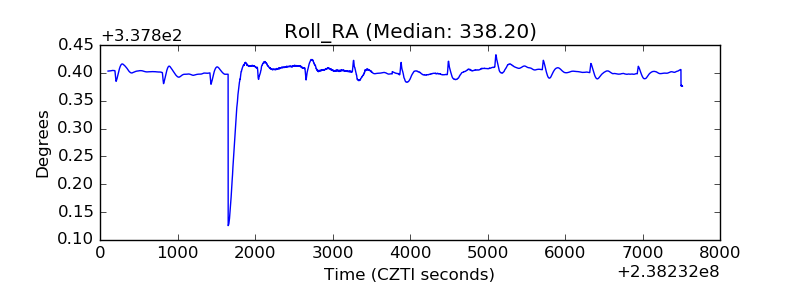 |
| Veto Counter | 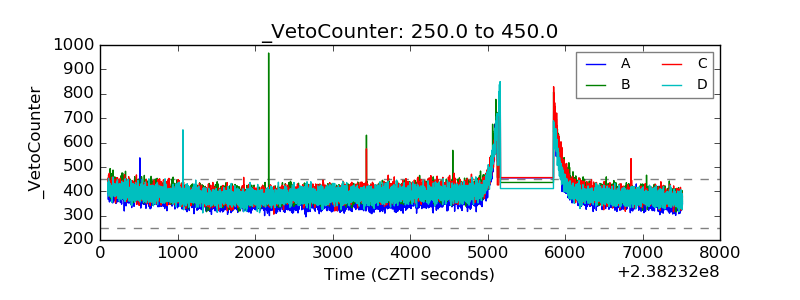 |