| Param | Original file | Final file |
|---|---|---|
| Filename | modeM0/AS1G05_218T01_9000001394_09788cztM0_level2.evt | modeM0/AS1G05_218T01_9000001394_09788cztM0_level2_quad_clean.evt |
| Size (bytes) | 447,523,200 | 71,651,520 |
| Size | 426.8 MB | 68.3 MB |
| Events in quadrant A | 3,148,982 | 432,627 |
| Events in quadrant B | 3,262,443 | 434,917 |
| Events in quadrant C | 3,052,764 | 427,338 |
| Events in quadrant D | 3,639,082 | 413,704 |
| Mode SS | |||
|---|---|---|---|
| Quadrant | BADHDUFLAG | Total packets | Discarded packets |
| A | 0 | 150 | 12 |
| B | 0 | 149 | 16 |
| C | 0 | 150 | 12 |
| D | 0 | 151 | 17 |
| Mode M0 | |||
|---|---|---|---|
| Quadrant | BADHDUFLAG | Total packets | Discarded packets |
| A | 0 | 15203 | 1369 |
| B | 0 | 15367 | 1413 |
| C | 0 | 15170 | 1457 |
| D | 0 | 17214 | 1907 |
| Mode M9 | |||
|---|---|---|---|
| Quadrant | BADHDUFLAG | Total packets | Discarded packets |
| A | 0 | 4 | 0 |
| B | 0 | 4 | 0 |
| C | 0 | 4 | 0 |
| D | 0 | 4 | 0 |
| Quadrant | Total seconds | Saturated seconds | Saturation percentage |
|---|---|---|---|
| A | 6658 | 128 | 1.922499% |
| B | 6634 | 129 | 1.944528% |
| C | 6604 | 86 | 1.302241% |
| D | 6561 | 177 | 2.697759% |
Noise dominated data is calculated using 1-second bins in cleaned event files. If a bin has >2000 counts, and if more than 50% of those come from <1% of pixels, then it is considered to be noise-dominated and hence unusable.
| Quadrant | # 1 sec bins | Bins with >0 counts | Bins with >2000 counts | High rate bins dominated by noise | Noise dominated (total time) | Noise dominated (detector-on time) | Marked lightcurve |
|---|---|---|---|---|---|---|---|
| A | 7711 | 6987 | 0 | 0 | 0.00% | 0.00% | 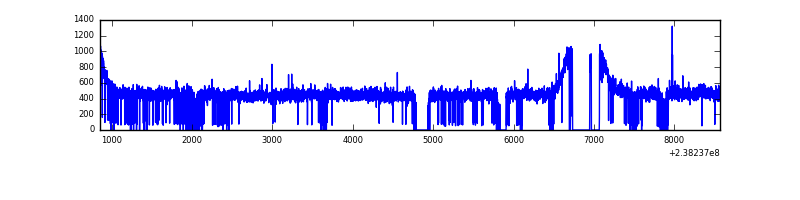 |
| B | 7711 | 6980 | 1 | 1 | 0.01% | 0.01% | 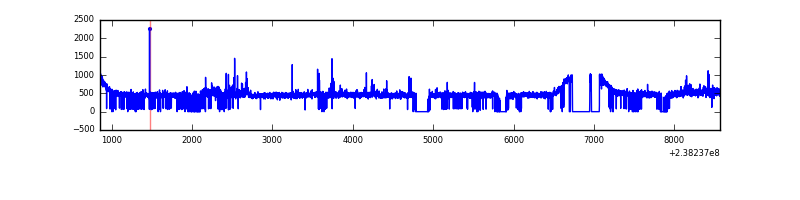 |
| C | 7711 | 6956 | 0 | 0 | 0.00% | 0.00% | 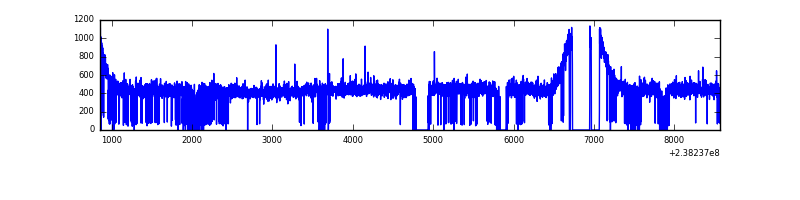 |
| D | 7710 | 6939 | 41 | 41 | 0.53% | 0.59% | 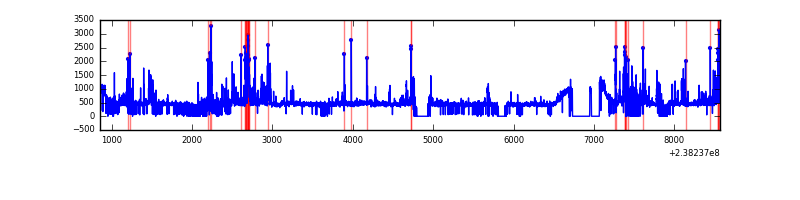 |
Top three noisy pixels from each quadrant. If the there are fewer than three noisy pixels in the level2.evt file, extra rows are filled as -1
| Pixel properties | Quadrant properties | ||||||
|---|---|---|---|---|---|---|---|
| Quadrant | DetID | PixID | Counts | Sigma | Mean | Median | Sigma |
| A | 13 | 251 | 7865 | 41.74 | 815 | 795 | 169.4 |
| A | 0 | 226 | 7603 | 40.19 | 815 | 795 | 169.4 |
| A | 12 | 194 | 6586 | 34.19 | 815 | 795 | 169.4 |
| B | 0 | 214 | 50078 | 309.65 | 810 | 790 | 159.2 |
| B | 0 | 187 | 24109 | 146.5 | 810 | 790 | 159.2 |
| B | 12 | 111 | 17987 | 108.04 | 810 | 790 | 159.2 |
| C | 13 | 61 | 5859 | 27.82 | 779 | 785 | 182.3 |
| C | 14 | 234 | 5686 | 26.87 | 779 | 785 | 182.3 |
| C | 8 | 128 | 4408 | 19.87 | 779 | 785 | 182.3 |
| D | 2 | 152 | 287944 | 1499.6 | 773 | 753 | 191.5 |
| D | 13 | 104 | 145148 | 753.97 | 773 | 753 | 191.5 |
| D | 1 | 52 | 142584 | 740.58 | 773 | 753 | 191.5 |
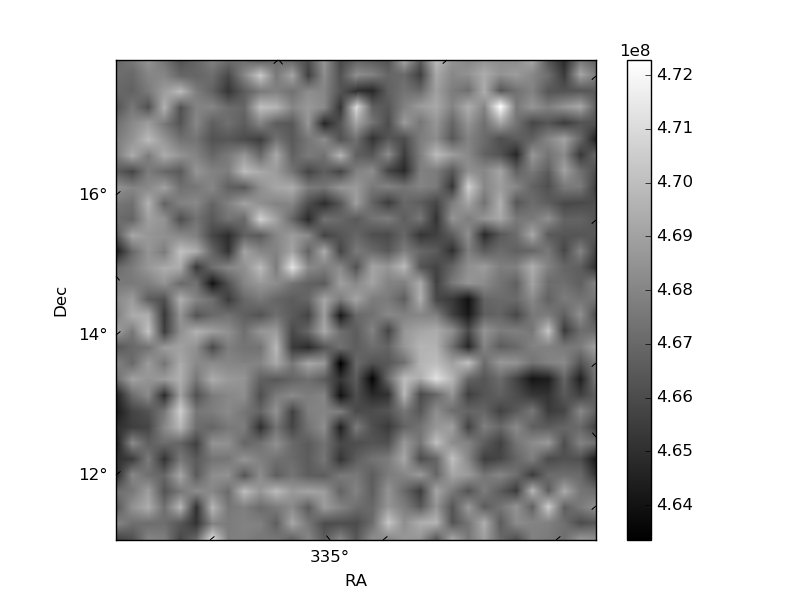
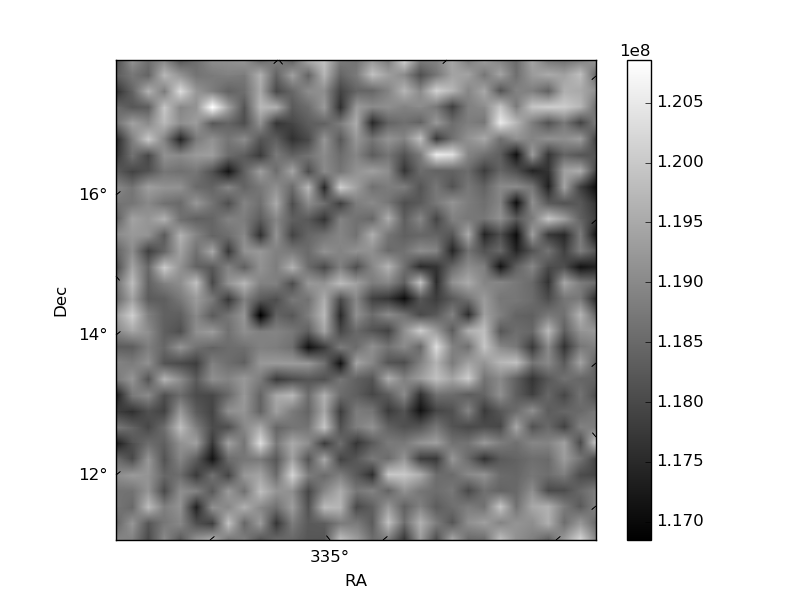
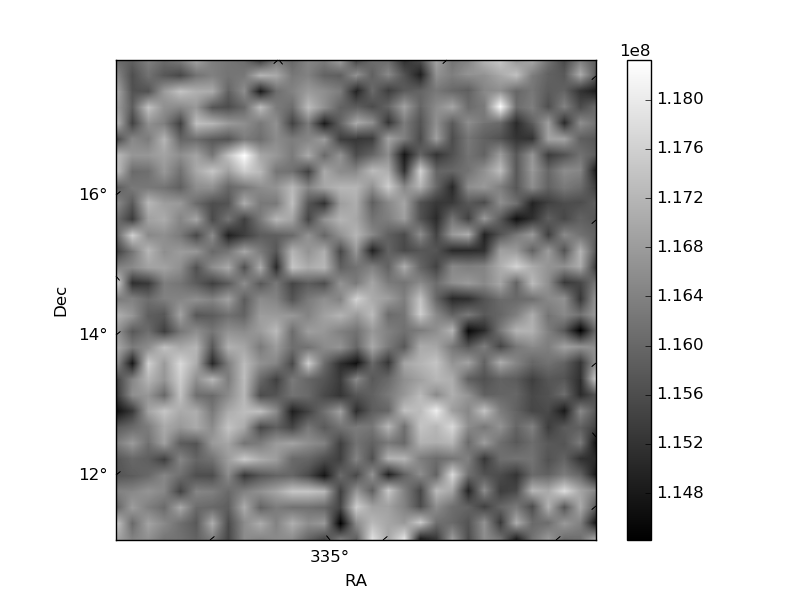
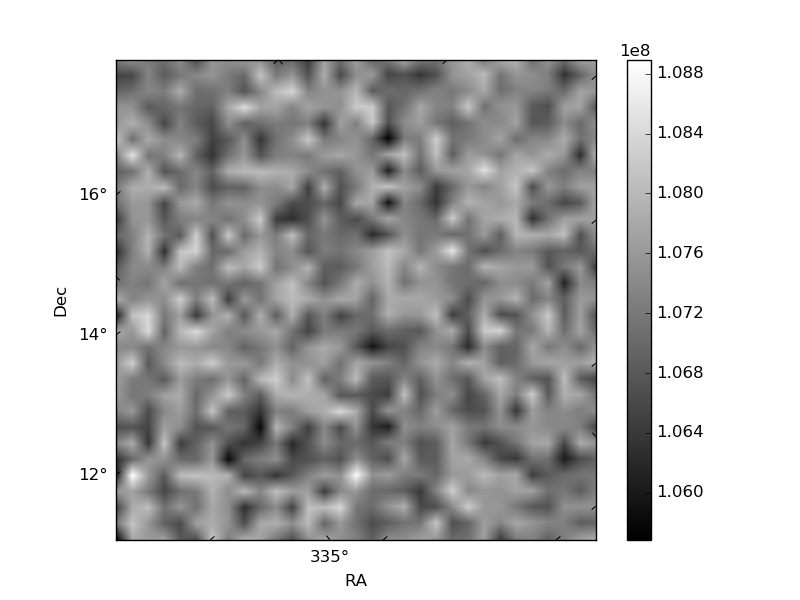
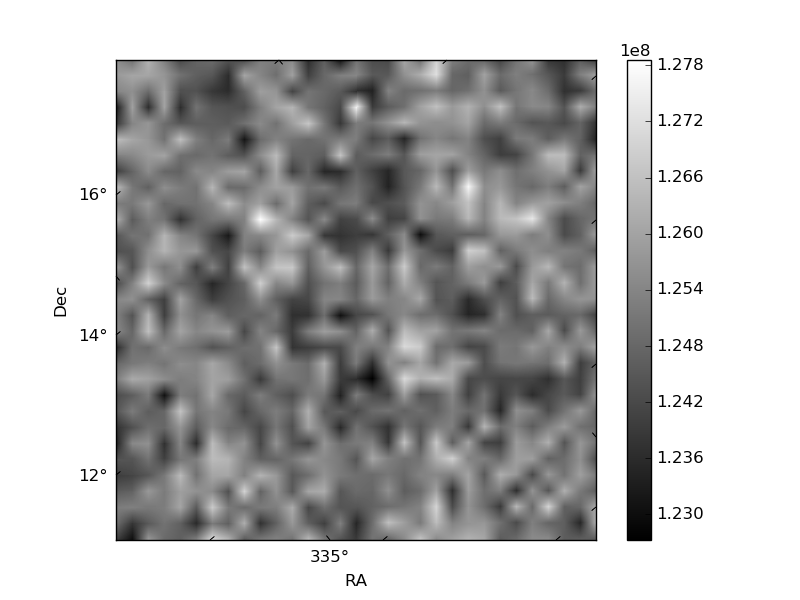
Histogram calculated using DETX and DETY for each event in the final _common_clean file
| Quadrant A | 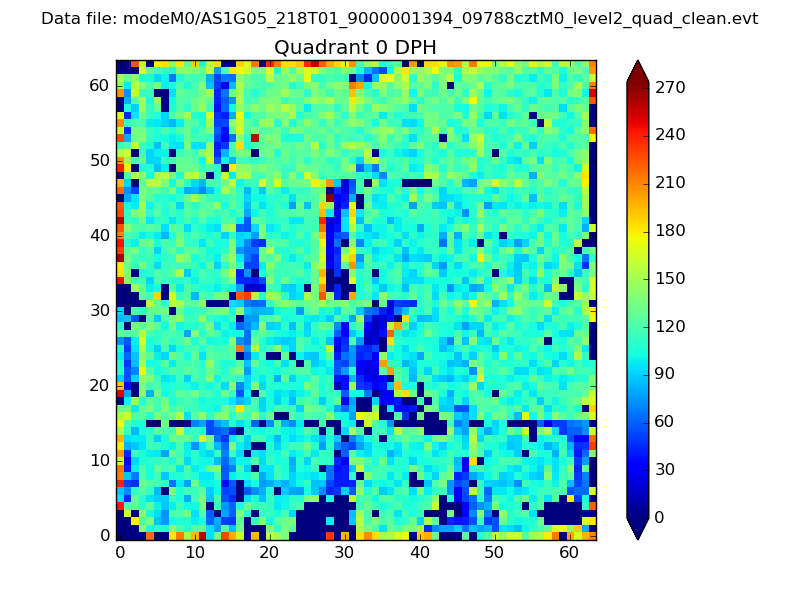 |
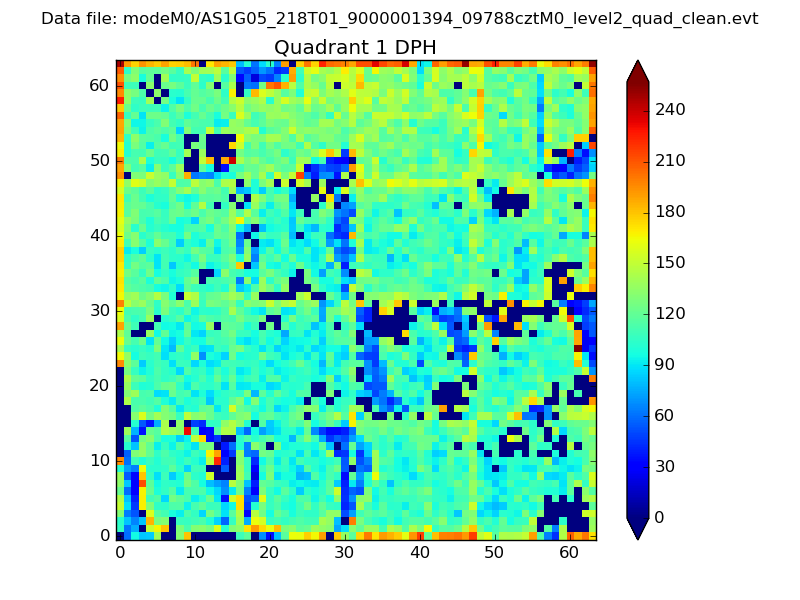 |
Quadrant B |
|---|---|---|---|
| Quadrant D | 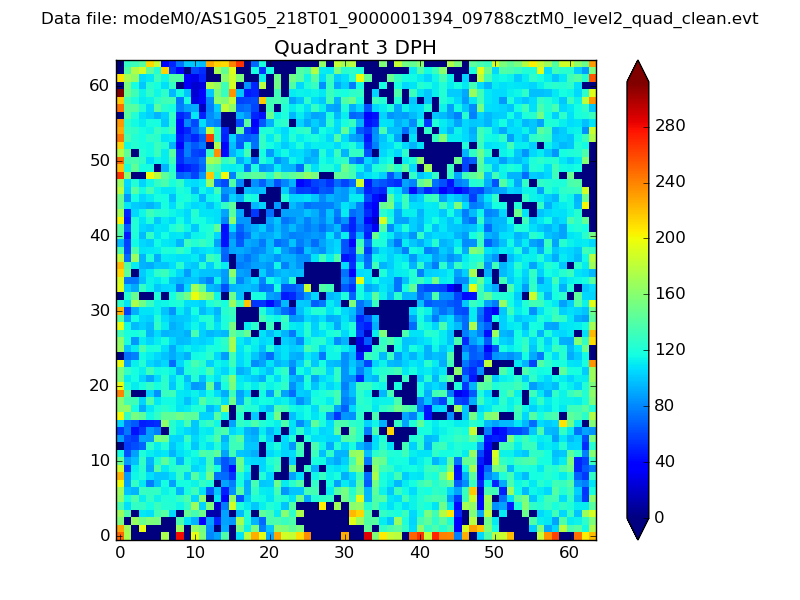 |
 |
Quadrant C |
| Plot type | Count rate plots | Images |
|---|---|---|
| Comparison with Poisson distribution Blue bars denote a histogram of data divided into 1 sec bins. Red curve is a Poisson curve with rate = median count rate of data. |
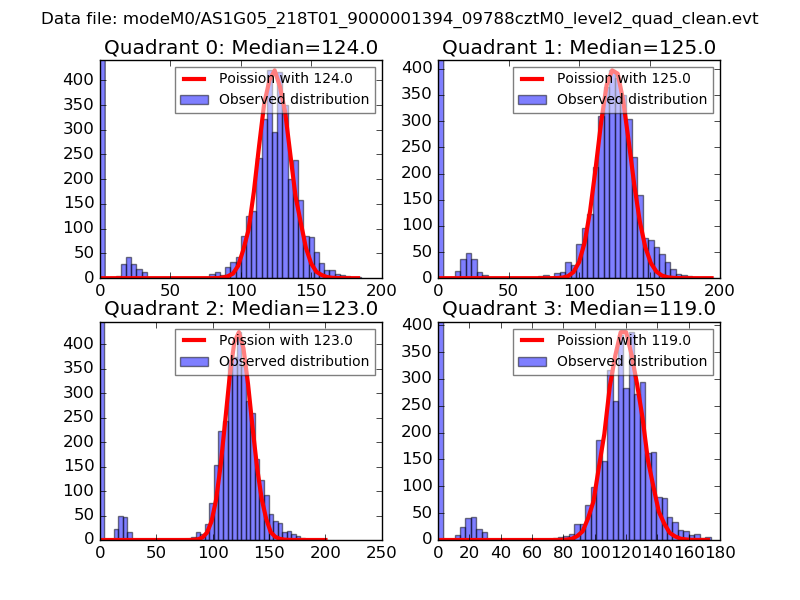 |
 |
| Quadrant-wise count rates Data is divided into 100 sec bins |
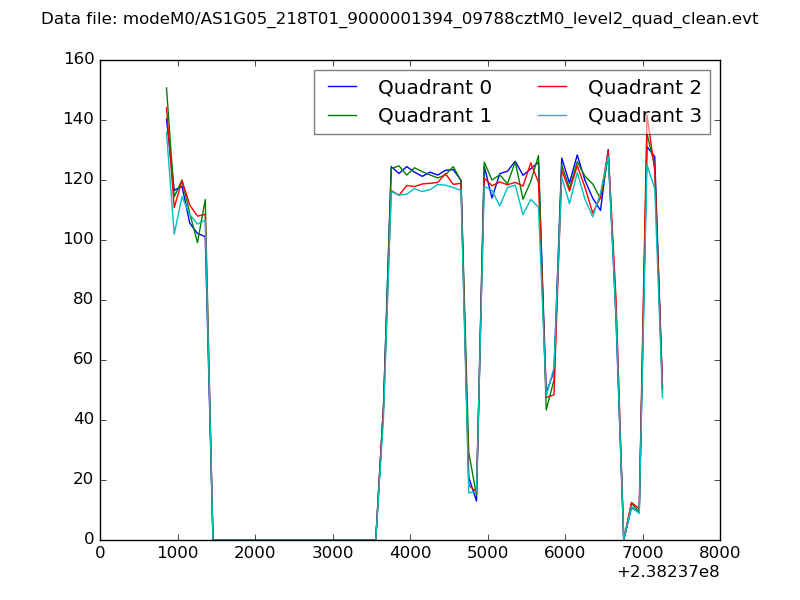 |
|
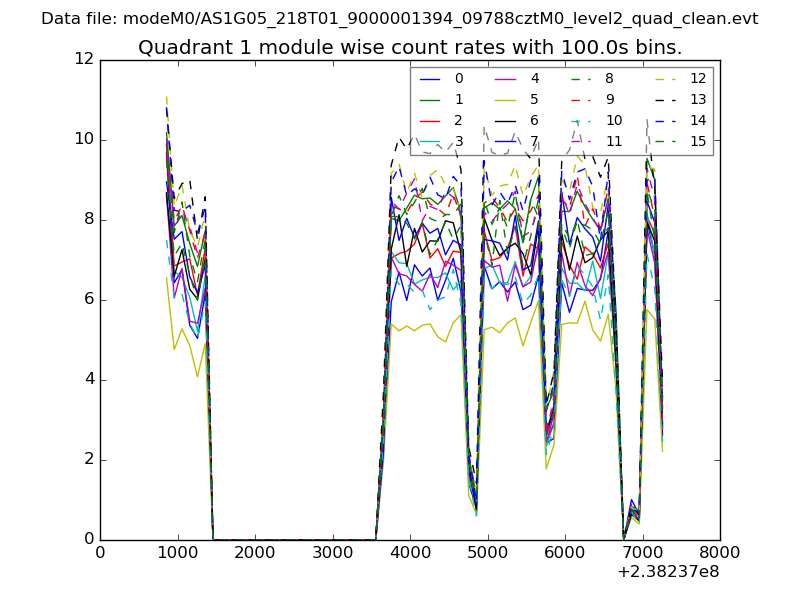
| Module-wise count rates for Quadrant A Data is divided into 100 sec bins |
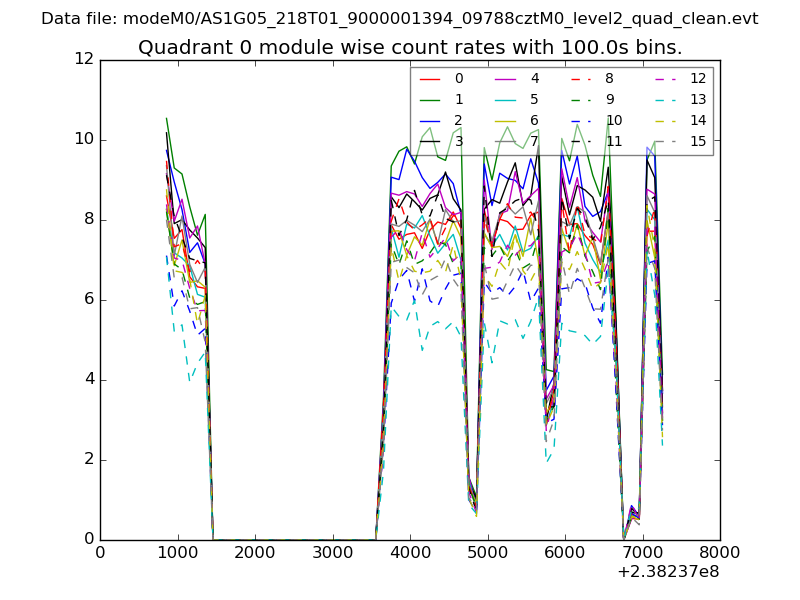 |
 |
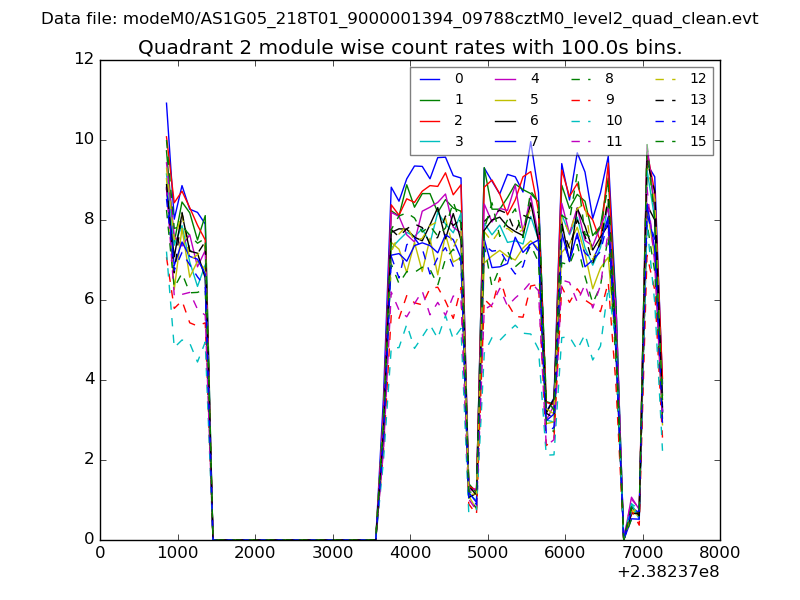
| Module-wise count rates for Quadrant B Data is divided into 100 sec bins |
 |
 |
| Module-wise count rates for Quadrant C Data is divided into 100 sec bins |
 |
 |
| Module-wise count rates for Quadrant D Data is divided into 100 sec bins |
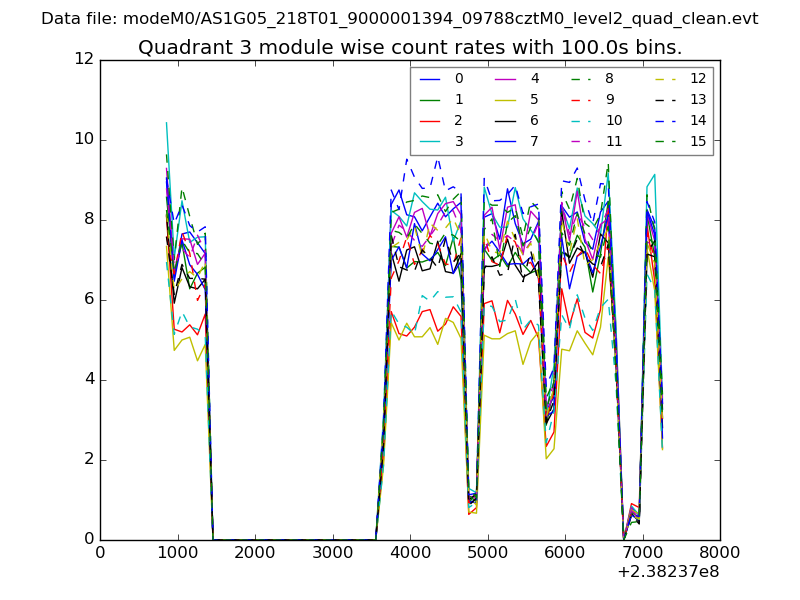 |
 |
| Parameter | Plot |
|---|---|
| CZT HV Monitor | 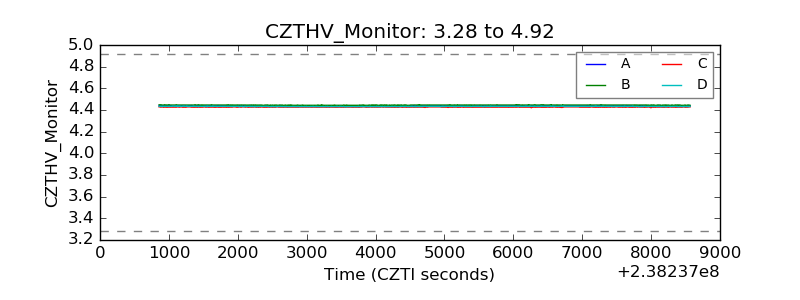 |
| D_VDD | 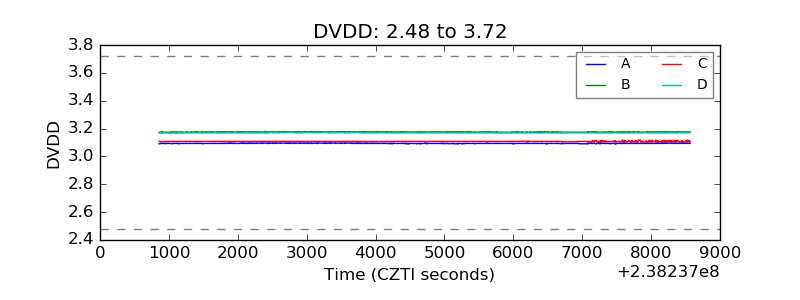 |
| Temperature 1 | 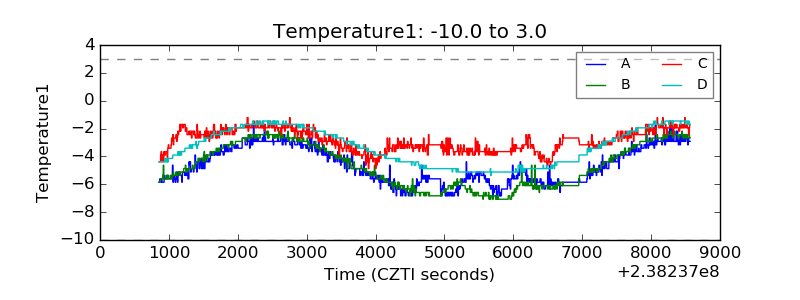 |
| Veto HV Monitor | 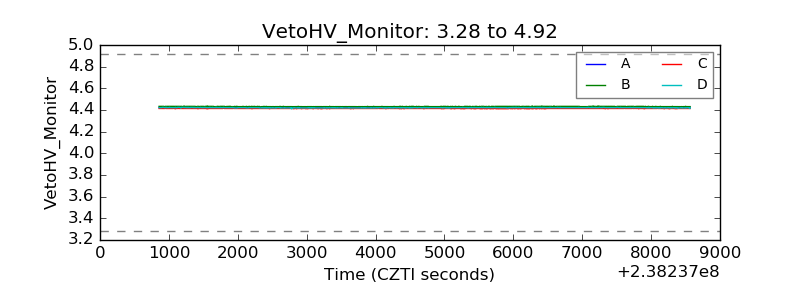 |
| Veto LLD | 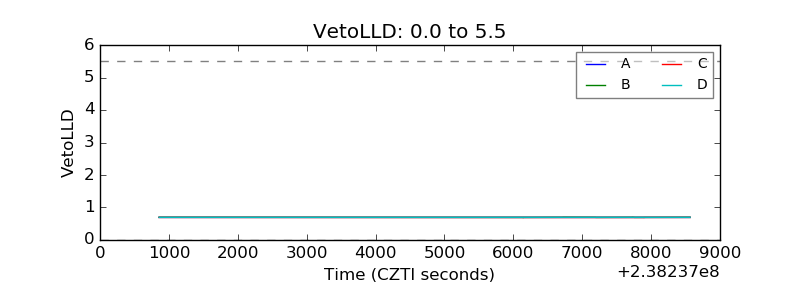 |
| Alpha Counter | 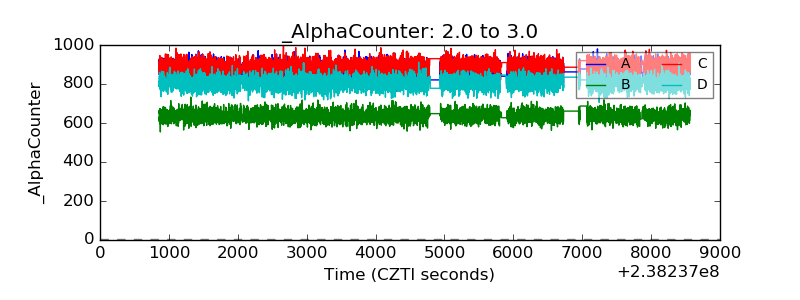 |
| _CPM_Rate |  |
| CZT Counter |  |
| +2.5 Volts monitor |  |
| +5 Volts monitor |  |
| _ROLL_ROT | 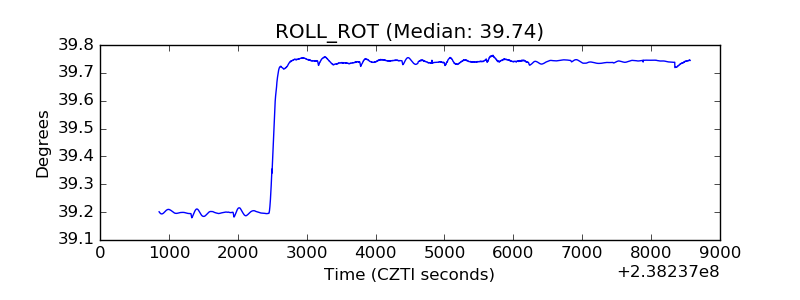 |
| _Roll_DEC | 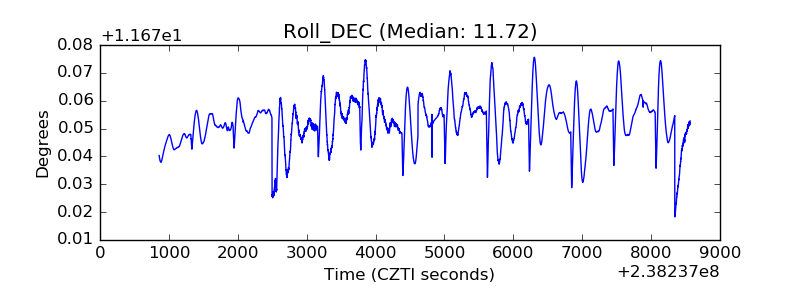 |
| _Roll_RA | 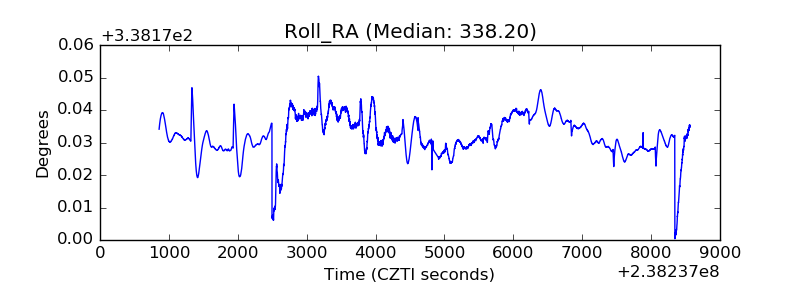 |
| Veto Counter | 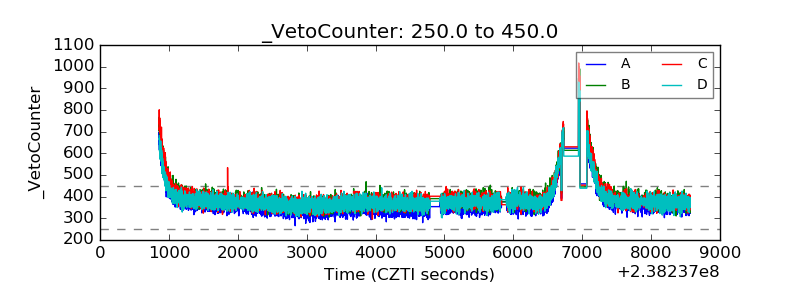 |