| Param | Original file | Final file |
|---|---|---|
| Filename | modeM0/AS1G05_218T01_9000001394_09790cztM0_level2.evt | modeM0/AS1G05_218T01_9000001394_09790cztM0_level2_quad_clean.evt |
| Size (bytes) | 185,342,400 | 31,890,240 |
| Size | 176.8 MB | 30.4 MB |
| Events in quadrant A | 1,314,049 | 194,937 |
| Events in quadrant B | 1,371,585 | 196,605 |
| Events in quadrant C | 1,293,053 | 184,237 |
| Events in quadrant D | 1,430,975 | 179,753 |
| Mode SS | |||
|---|---|---|---|
| Quadrant | BADHDUFLAG | Total packets | Discarded packets |
| A | 0 | 160 | 94 |
| B | 0 | 160 | 110 |
| C | 0 | 160 | 92 |
| D | 0 | 159 | 94 |
| Mode M0 | |||
|---|---|---|---|
| Quadrant | BADHDUFLAG | Total packets | Discarded packets |
| A | 0 | 15932 | 10016 |
| B | 0 | 16256 | 10218 |
| C | 0 | 16046 | 10153 |
| D | 0 | 17241 | 10986 |
| Mode M9 | |||
|---|---|---|---|
| Quadrant | BADHDUFLAG | Total packets | Discarded packets |
| A | 0 | 5 | 4 |
| B | 0 | 6 | 6 |
| C | 0 | 6 | 5 |
| D | 0 | 4 | 2 |
| Quadrant | Total seconds | Saturated seconds | Saturation percentage |
|---|---|---|---|
| A | 2914 | 29 | 0.995196% |
| B | 2931 | 35 | 1.194132% |
| C | 2891 | 20 | 0.691802% |
| D | 2904 | 34 | 1.170799% |
Noise dominated data is calculated using 1-second bins in cleaned event files. If a bin has >2000 counts, and if more than 50% of those come from <1% of pixels, then it is considered to be noise-dominated and hence unusable.
| Quadrant | # 1 sec bins | Bins with >0 counts | Bins with >2000 counts | High rate bins dominated by noise | Noise dominated (total time) | Noise dominated (detector-on time) | Marked lightcurve |
|---|---|---|---|---|---|---|---|
| A | 8417 | 3968 | 0 | 0 | 0.00% | 0.00% | 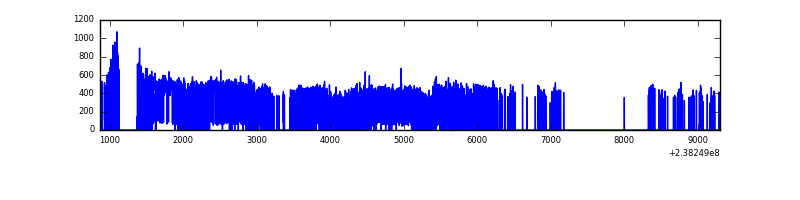 |
| B | 8402 | 3988 | 0 | 0 | 0.00% | 0.00% | 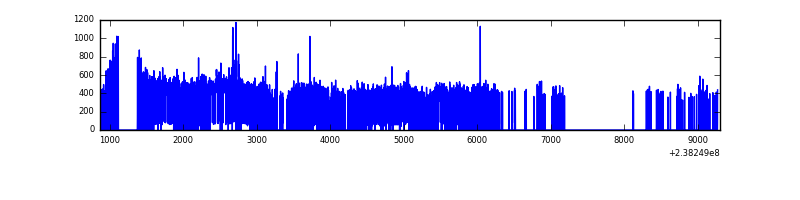 |
| C | 8428 | 3959 | 0 | 0 | 0.00% | 0.00% | 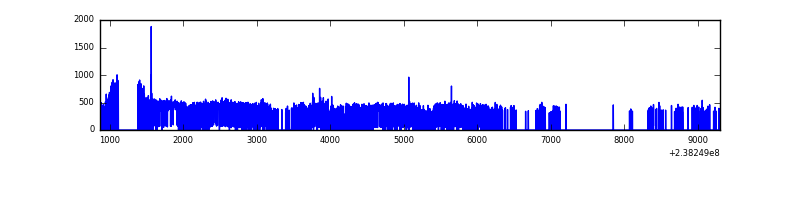 |
| D | 8433 | 3969 | 7 | 7 | 0.08% | 0.18% | 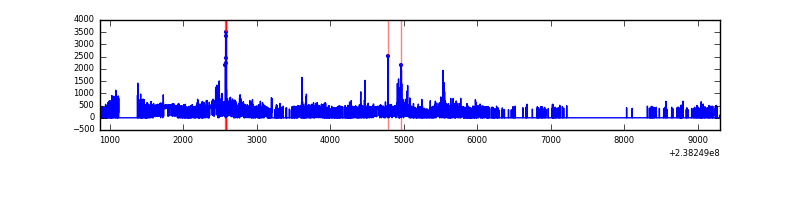 |
Top three noisy pixels from each quadrant. If the there are fewer than three noisy pixels in the level2.evt file, extra rows are filled as -1
| Pixel properties | Quadrant properties | ||||||
|---|---|---|---|---|---|---|---|
| Quadrant | DetID | PixID | Counts | Sigma | Mean | Median | Sigma |
| A | 13 | 253 | 3145 | 39.39 | 340 | 334 | 71.4 |
| A | 0 | 226 | 3002 | 37.38 | 340 | 334 | 71.4 |
| A | 12 | 194 | 2987 | 37.17 | 340 | 334 | 71.4 |
| B | 0 | 214 | 18334 | 263.95 | 343 | 335 | 68.2 |
| B | 4 | 239 | 8349 | 117.52 | 343 | 335 | 68.2 |
| B | 12 | 111 | 7408 | 103.72 | 343 | 335 | 68.2 |
| C | 9 | 54 | 5689 | 69.18 | 328 | 330 | 77.5 |
| C | 14 | 234 | 3459 | 40.39 | 328 | 330 | 77.5 |
| C | 13 | 61 | 2385 | 26.53 | 328 | 330 | 77.5 |
| D | 2 | 152 | 83173 | 983.81 | 327 | 319 | 84.2 |
| D | 1 | 52 | 40578 | 478.04 | 327 | 319 | 84.2 |
| D | 13 | 104 | 26681 | 313.02 | 327 | 319 | 84.2 |
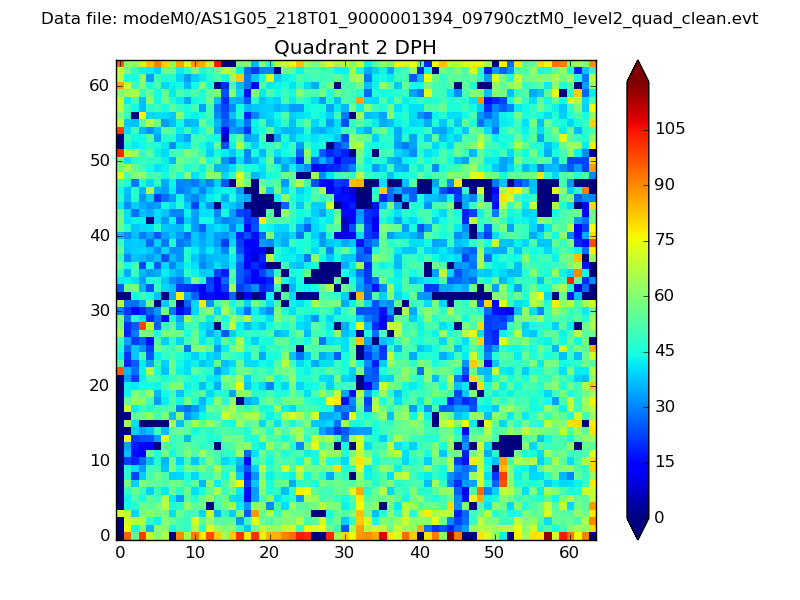
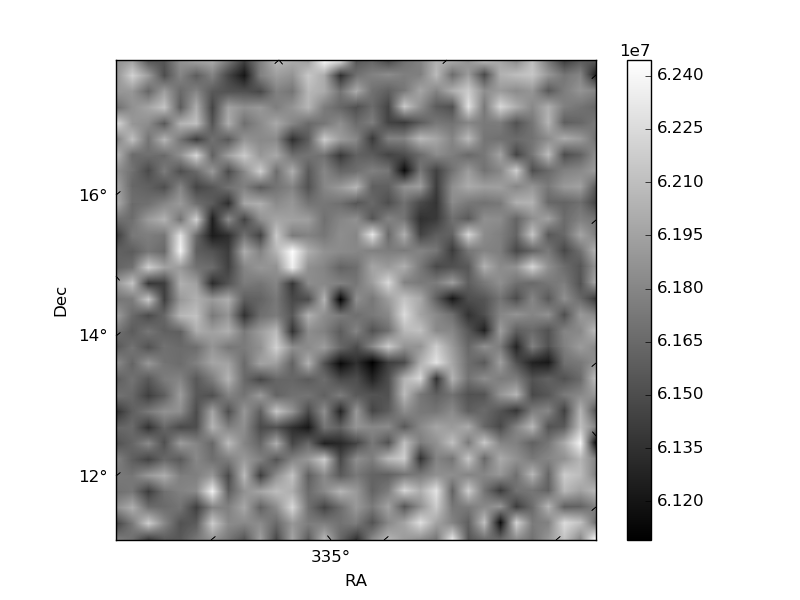
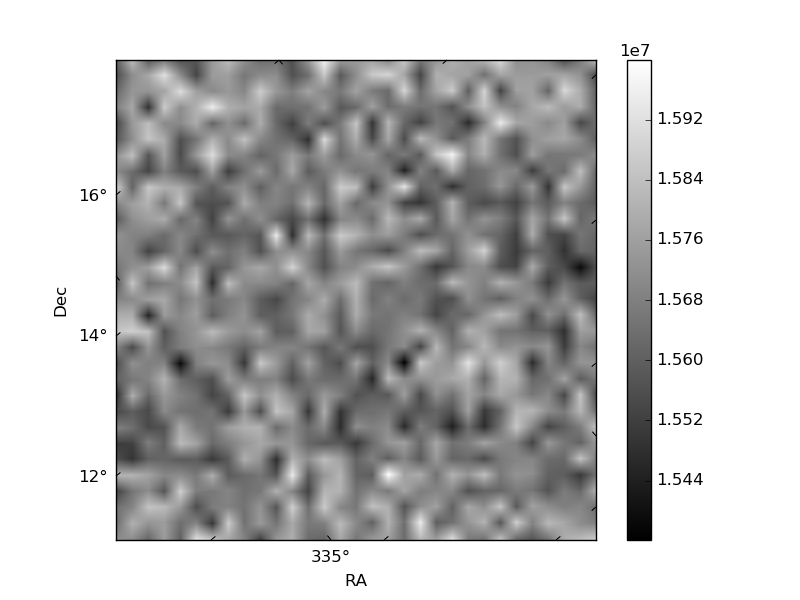
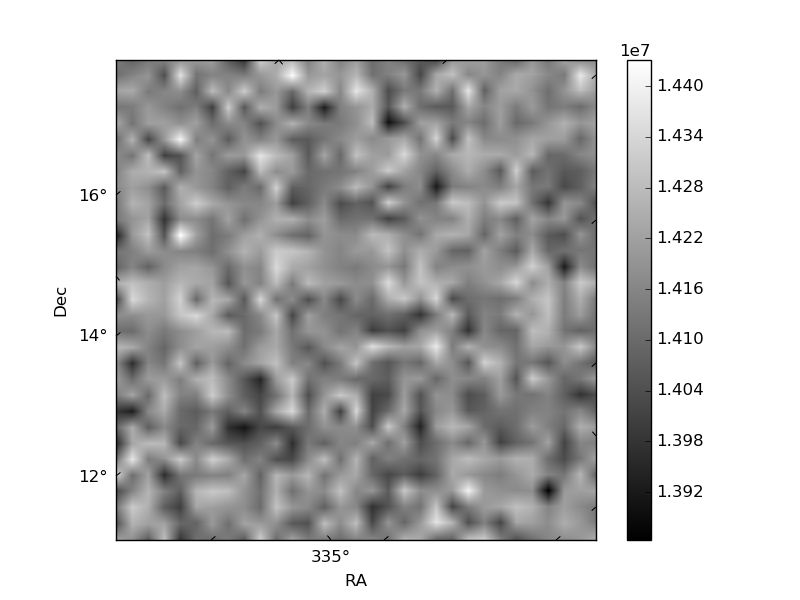
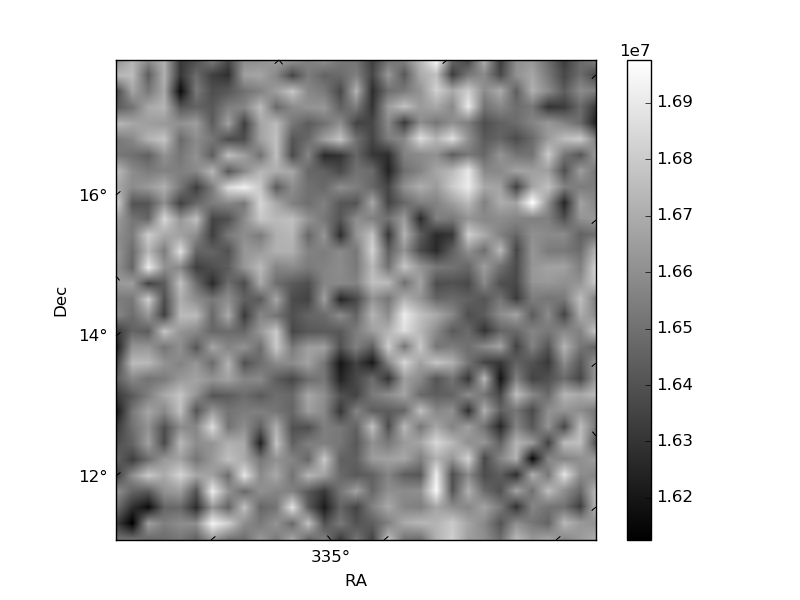
Histogram calculated using DETX and DETY for each event in the final _common_clean file
| Quadrant A | 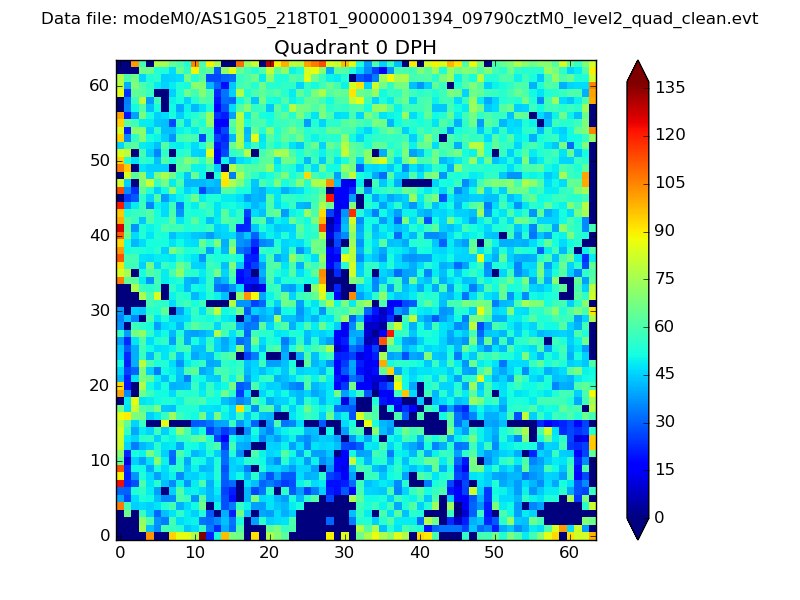 |
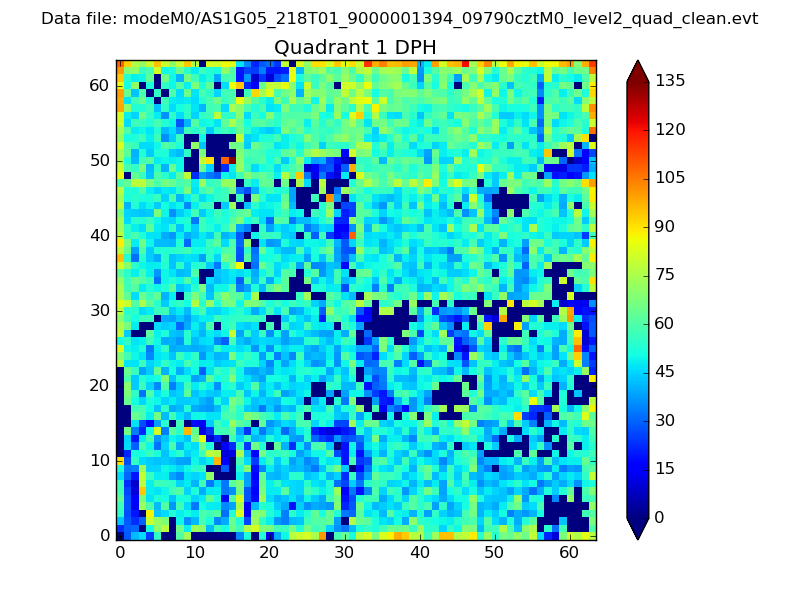 |
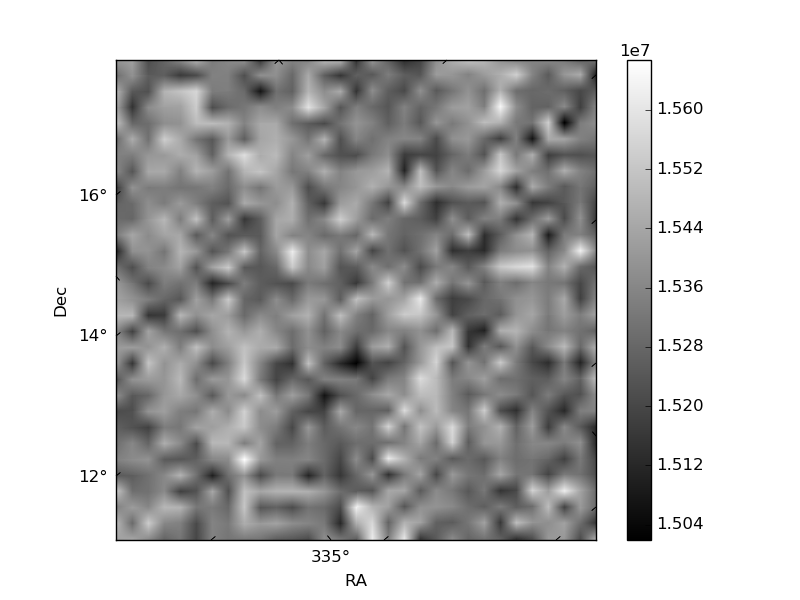
Quadrant B |
|---|---|---|---|
| Quadrant D | 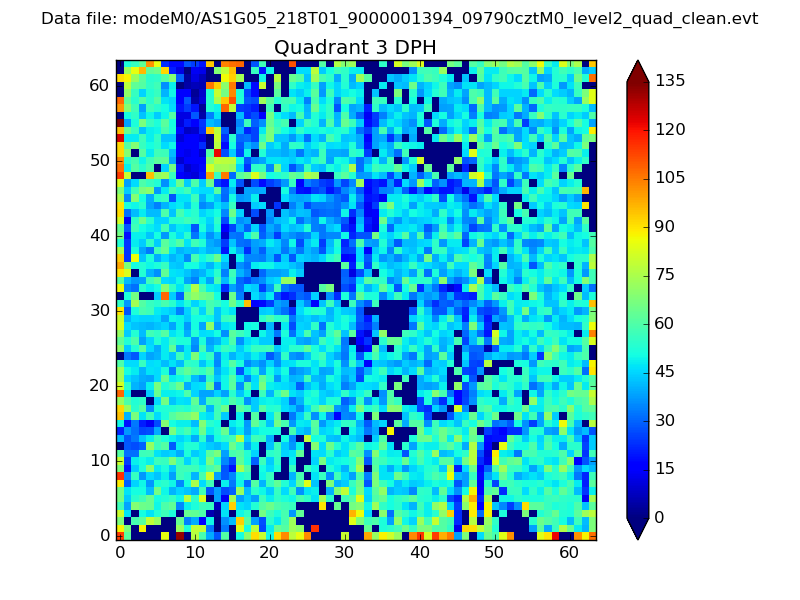 |
 |
Quadrant C |
| Plot type | Count rate plots | Images |
|---|---|---|
| Comparison with Poisson distribution Blue bars denote a histogram of data divided into 1 sec bins. Red curve is a Poisson curve with rate = median count rate of data. |
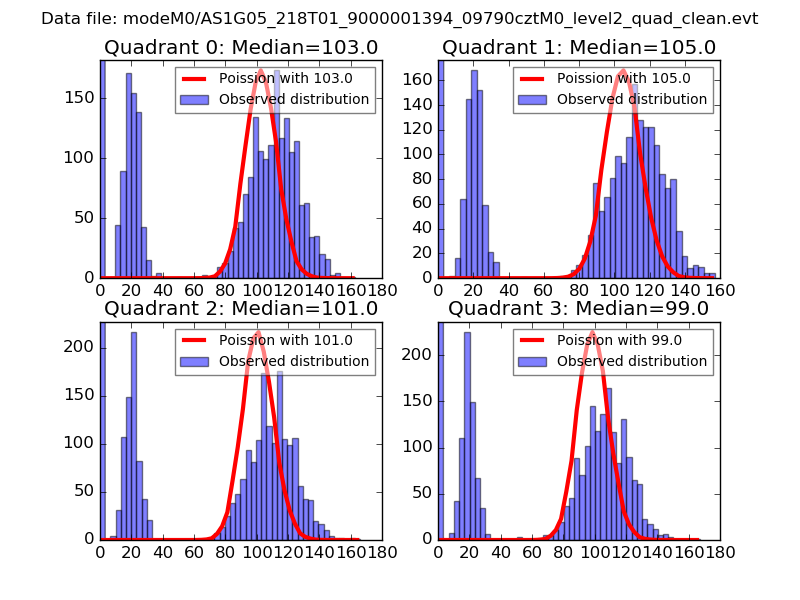 |
 |
| Quadrant-wise count rates Data is divided into 100 sec bins |
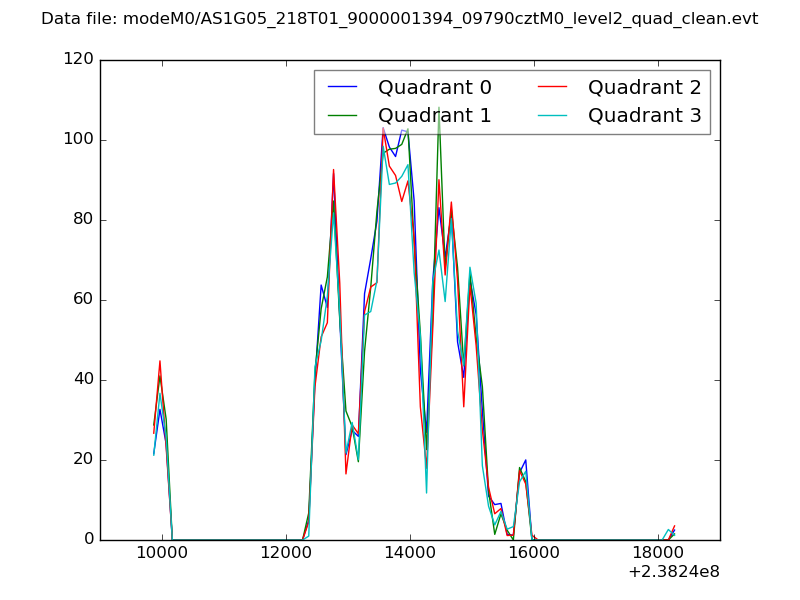 |
|
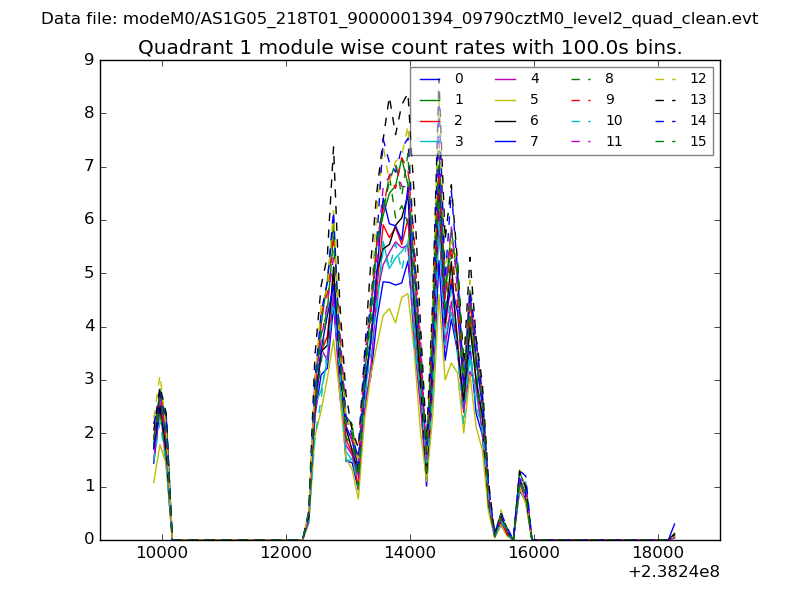
| Module-wise count rates for Quadrant A Data is divided into 100 sec bins |
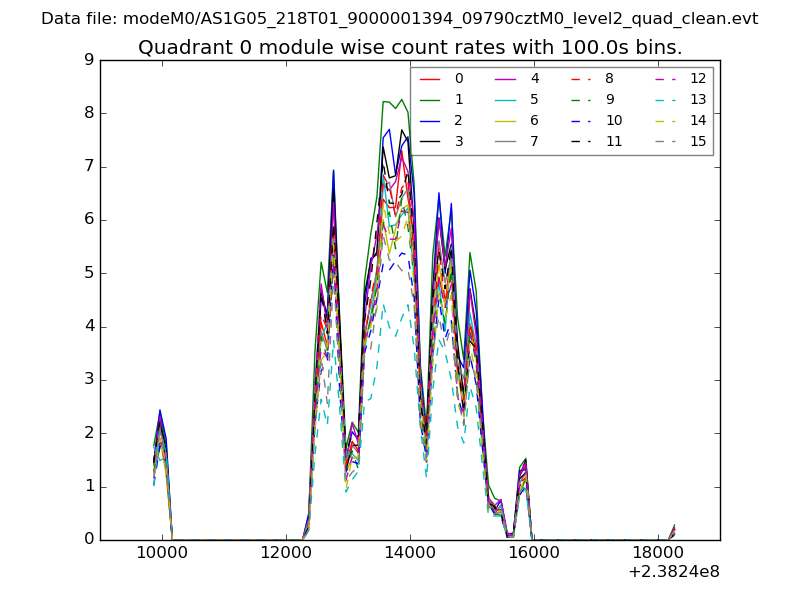 |
 |
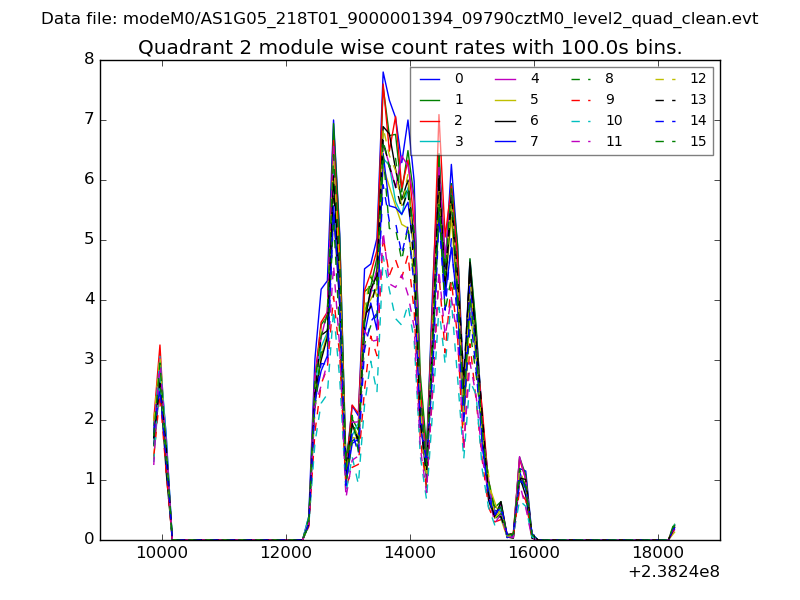
| Module-wise count rates for Quadrant B Data is divided into 100 sec bins |
 |
 |
| Module-wise count rates for Quadrant C Data is divided into 100 sec bins |
 |
 |
| Module-wise count rates for Quadrant D Data is divided into 100 sec bins |
 |
 |
| Parameter | Plot |
|---|---|
| CZT HV Monitor | 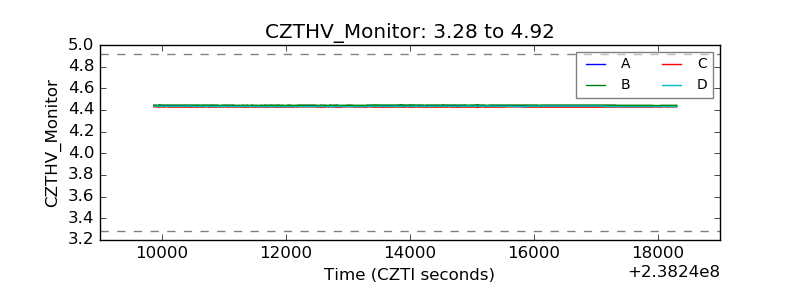 |
| D_VDD |  |
| Temperature 1 | 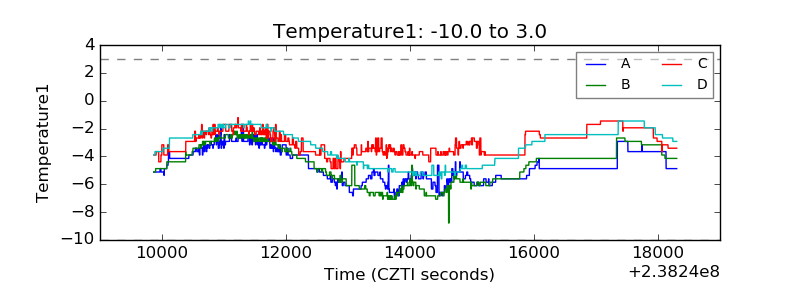 |
| Veto HV Monitor | 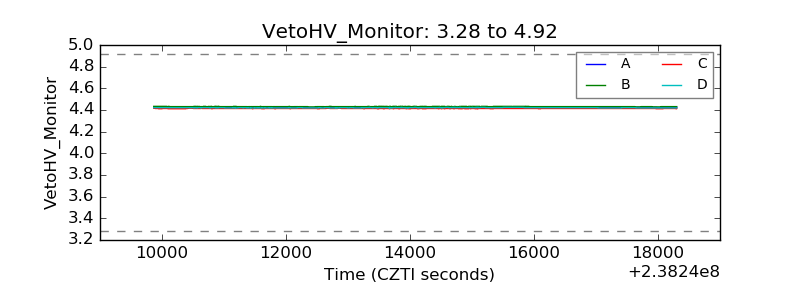 |
| Veto LLD |  |
| Alpha Counter | 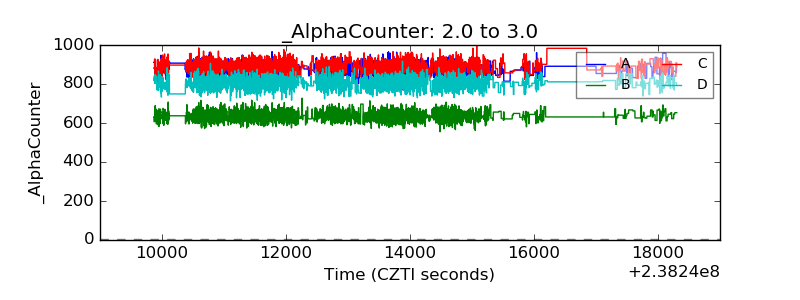 |
| _CPM_Rate | 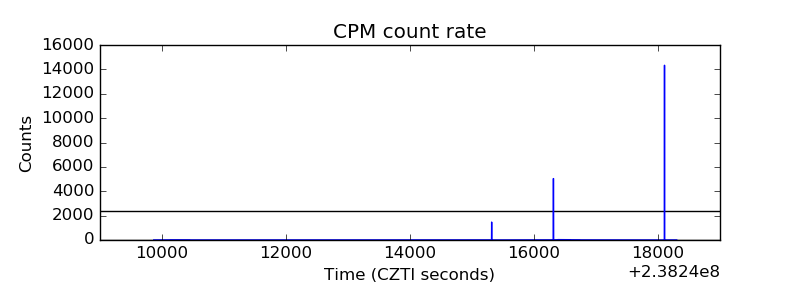 |
| CZT Counter | 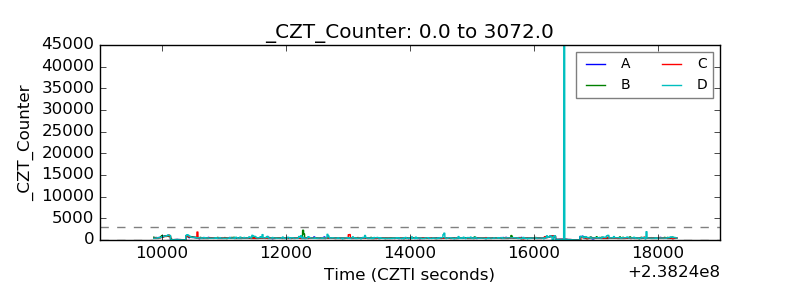 |
| +2.5 Volts monitor |  |
| +5 Volts monitor |  |
| _ROLL_ROT |  |
| _Roll_DEC | 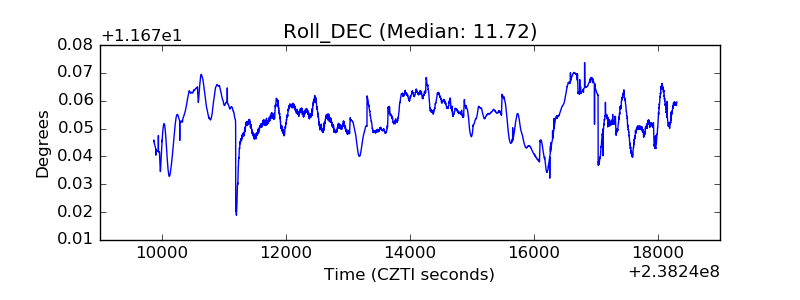 |
| _Roll_RA | 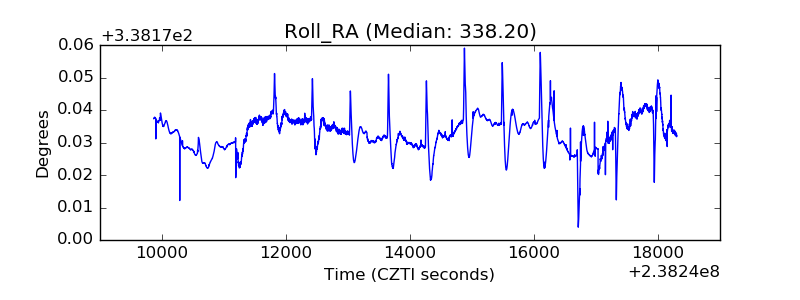 |
| Veto Counter |  |