| Param | Original file | Final file |
|---|---|---|
| Filename | modeM0/AS1G05_218T01_9000001394_09792cztM0_level2.evt | modeM0/AS1G05_218T01_9000001394_09792cztM0_level2_quad_clean.evt |
| Size (bytes) | 125,737,920 | 13,553,280 |
| Size | 119.9 MB | 12.9 MB |
| Events in quadrant A | 863,969 | 69,882 |
| Events in quadrant B | 911,672 | 70,829 |
| Events in quadrant C | 844,192 | 67,214 |
| Events in quadrant D | 1,058,823 | 65,859 |
| Mode SS | |||
|---|---|---|---|
| Quadrant | BADHDUFLAG | Total packets | Discarded packets |
| A | 0 | 38 | 2 |
| B | 0 | 38 | 2 |
| C | 0 | 38 | 0 |
| D | 0 | 38 | 2 |
| Mode M0 | |||
|---|---|---|---|
| Quadrant | BADHDUFLAG | Total packets | Discarded packets |
| A | 0 | 3827 | 83 |
| B | 0 | 3913 | 76 |
| C | 0 | 3828 | 94 |
| D | 0 | 4494 | 135 |
| Quadrant | Total seconds | Saturated seconds | Saturation percentage |
|---|---|---|---|
| A | 1867 | 1 | 0.053562% |
| B | 1870 | 3 | 0.160428% |
| C | 1861 | 0 | 0.000000% |
| D | 1854 | 21 | 1.132686% |
Noise dominated data is calculated using 1-second bins in cleaned event files. If a bin has >2000 counts, and if more than 50% of those come from <1% of pixels, then it is considered to be noise-dominated and hence unusable.
| Quadrant | # 1 sec bins | Bins with >0 counts | Bins with >2000 counts | High rate bins dominated by noise | Noise dominated (total time) | Noise dominated (detector-on time) | Marked lightcurve |
|---|---|---|---|---|---|---|---|
| A | 1908 | 1906 | 0 | 0 | 0.00% | 0.00% | 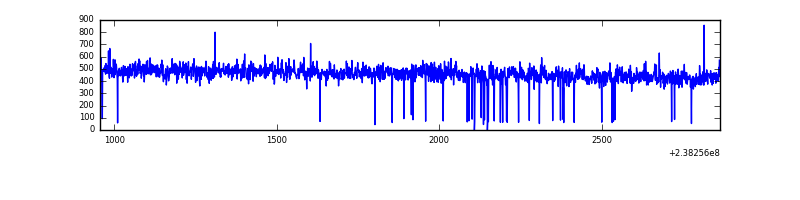 |
| B | 1908 | 1903 | 0 | 0 | 0.00% | 0.00% | 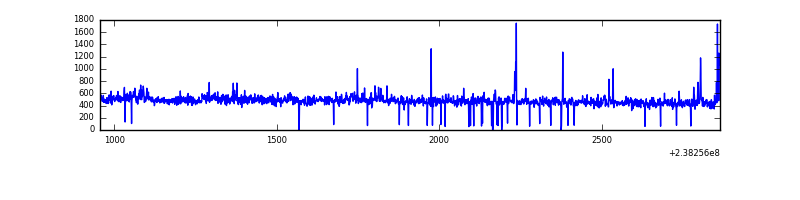 |
| C | 1908 | 1907 | 0 | 0 | 0.00% | 0.00% | 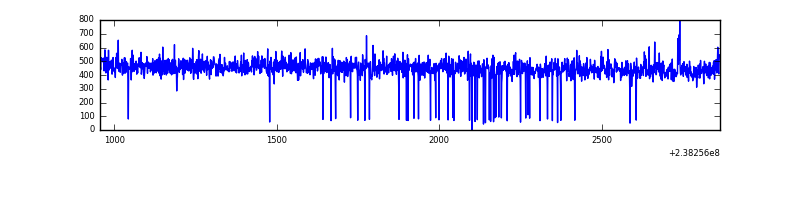 |
| D | 1908 | 1905 | 16 | 16 | 0.84% | 0.84% | 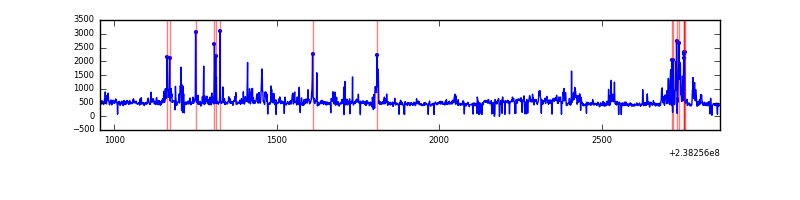 |
Top three noisy pixels from each quadrant. If the there are fewer than three noisy pixels in the level2.evt file, extra rows are filled as -1
| Pixel properties | Quadrant properties | ||||||
|---|---|---|---|---|---|---|---|
| Quadrant | DetID | PixID | Counts | Sigma | Mean | Median | Sigma |
| A | 0 | 226 | 2059 | 38.33 | 224 | 219 | 48.0 |
| A | 12 | 194 | 1864 | 34.27 | 224 | 219 | 48.0 |
| A | 13 | 253 | 1376 | 24.1 | 224 | 219 | 48.0 |
| B | 0 | 214 | 13812 | 299.22 | 224 | 218 | 45.4 |
| B | 4 | 239 | 12329 | 266.58 | 224 | 218 | 45.4 |
| B | 10 | 245 | 5672 | 120.05 | 224 | 218 | 45.4 |
| C | 8 | 128 | 4545 | 83.91 | 213 | 213 | 51.6 |
| C | 14 | 234 | 2935 | 52.73 | 213 | 213 | 51.6 |
| C | 8 | 112 | 2107 | 36.69 | 213 | 213 | 51.6 |
| D | 2 | 152 | 149559 | 2658.97 | 213 | 206 | 56.2 |
| D | 8 | 195 | 23696 | 418.19 | 213 | 206 | 56.2 |
| D | 7 | 71 | 22750 | 401.35 | 213 | 206 | 56.2 |
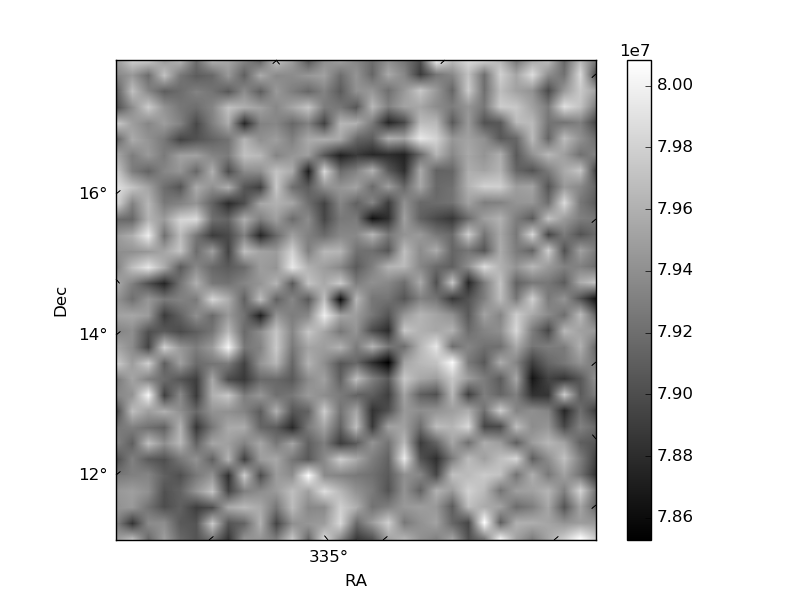
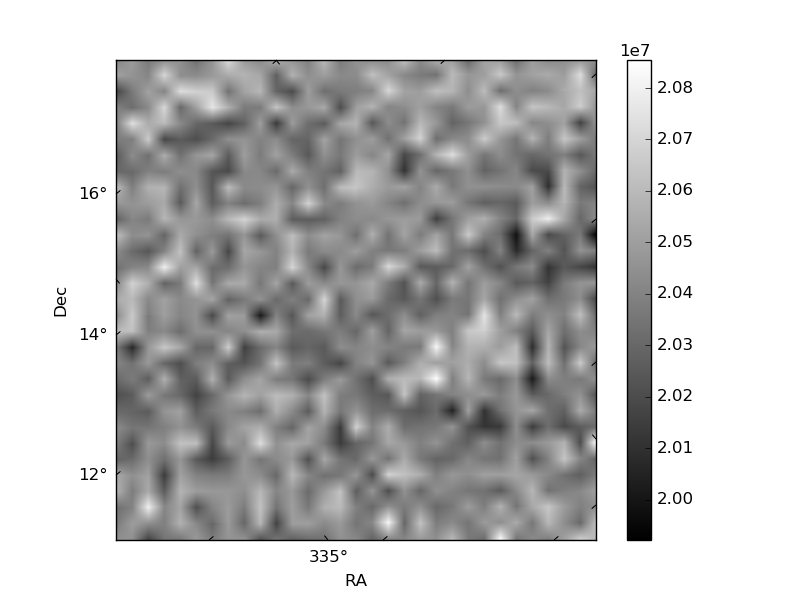
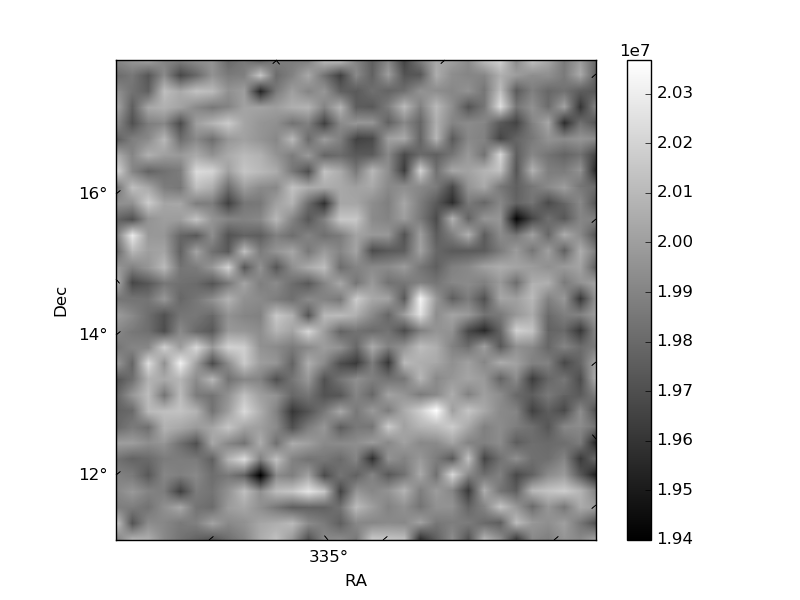
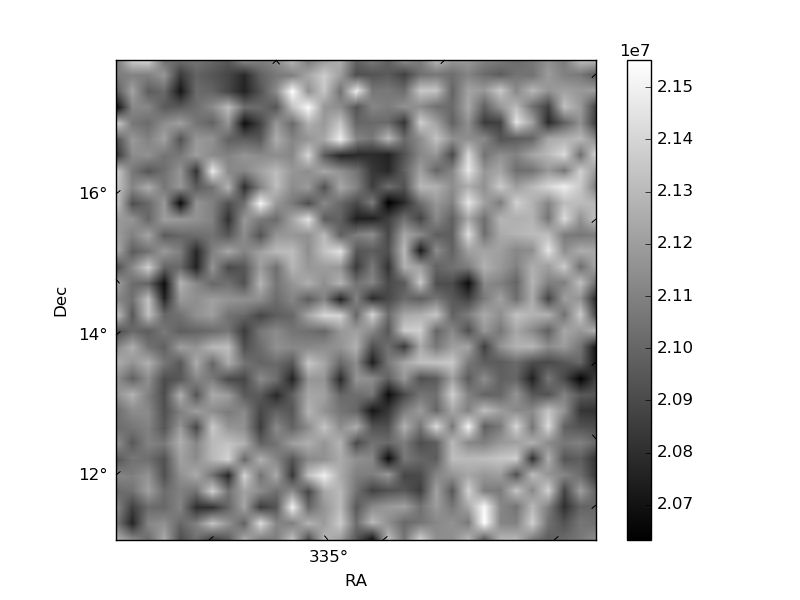
Histogram calculated using DETX and DETY for each event in the final _common_clean file
| Quadrant A | 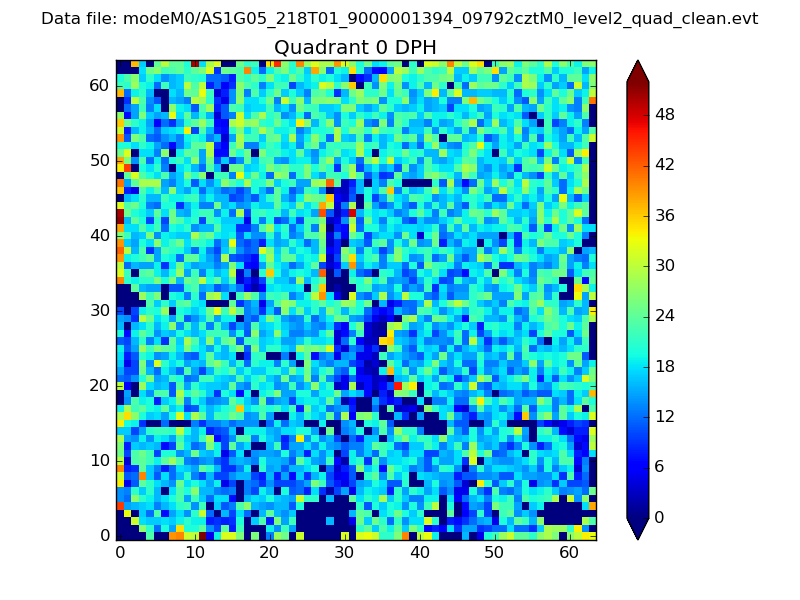 |
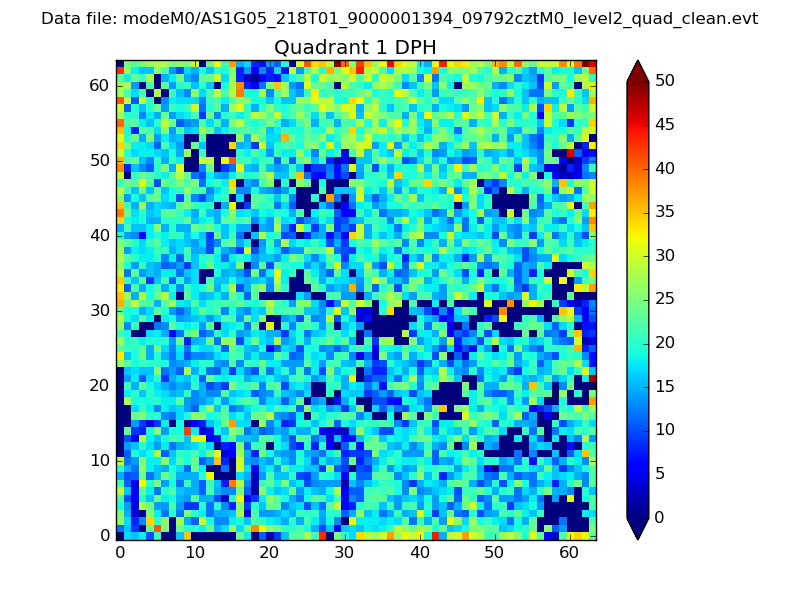 |
Quadrant B |
|---|---|---|---|
| Quadrant D | 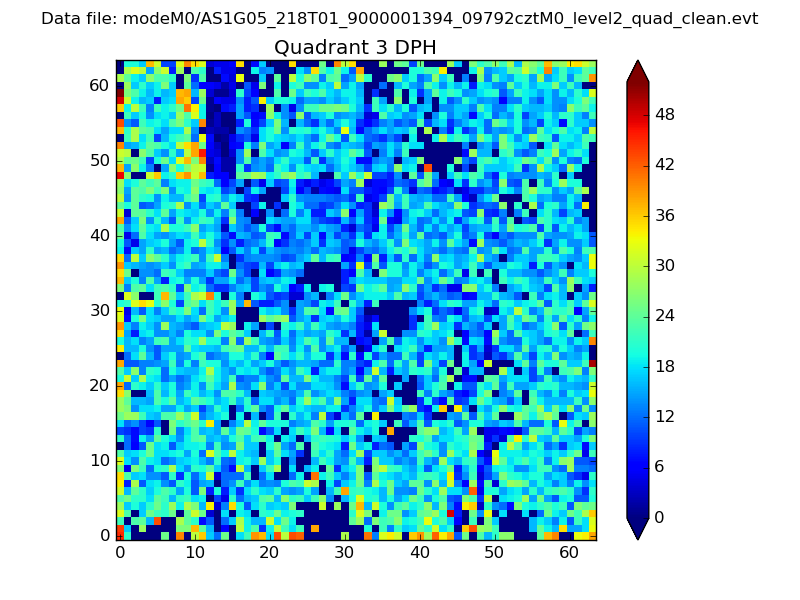 |
 |
Quadrant C |
| Plot type | Count rate plots | Images |
|---|---|---|
| Comparison with Poisson distribution Blue bars denote a histogram of data divided into 1 sec bins. Red curve is a Poisson curve with rate = median count rate of data. |
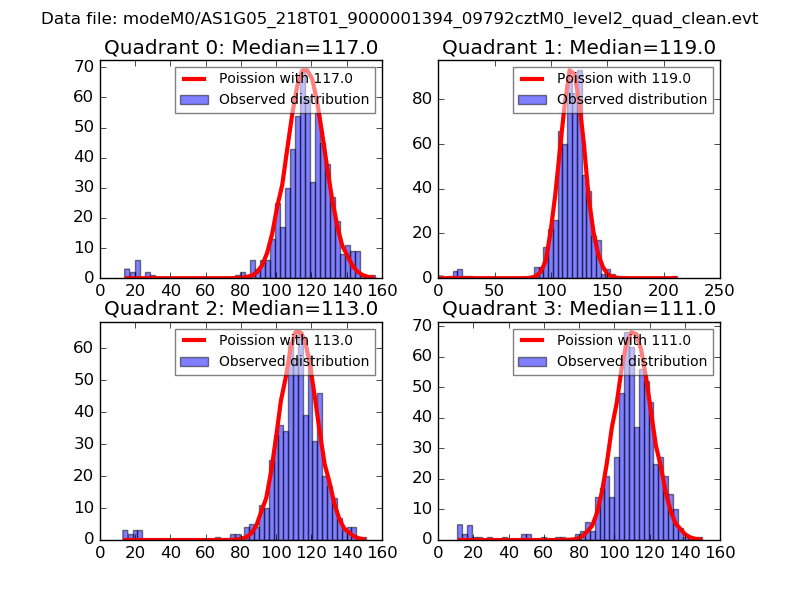 |
 |
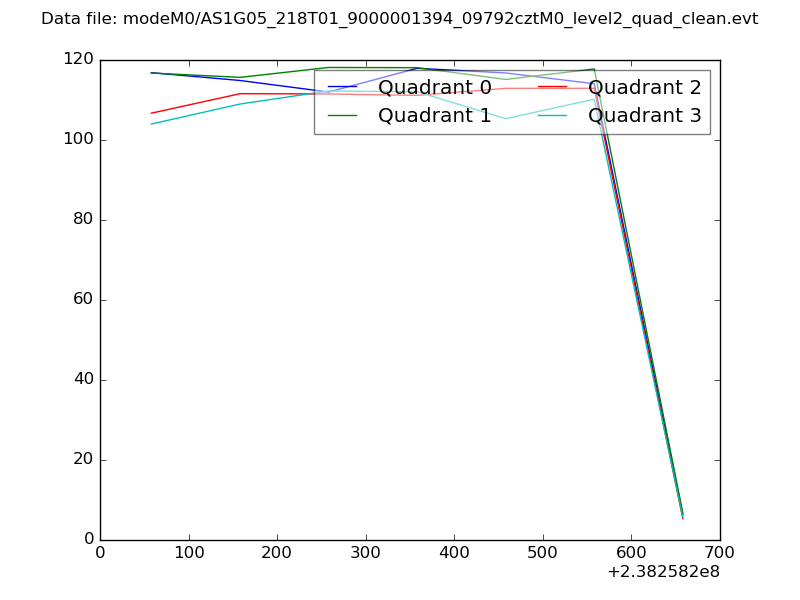
| Quadrant-wise count rates Data is divided into 100 sec bins |
 |
|
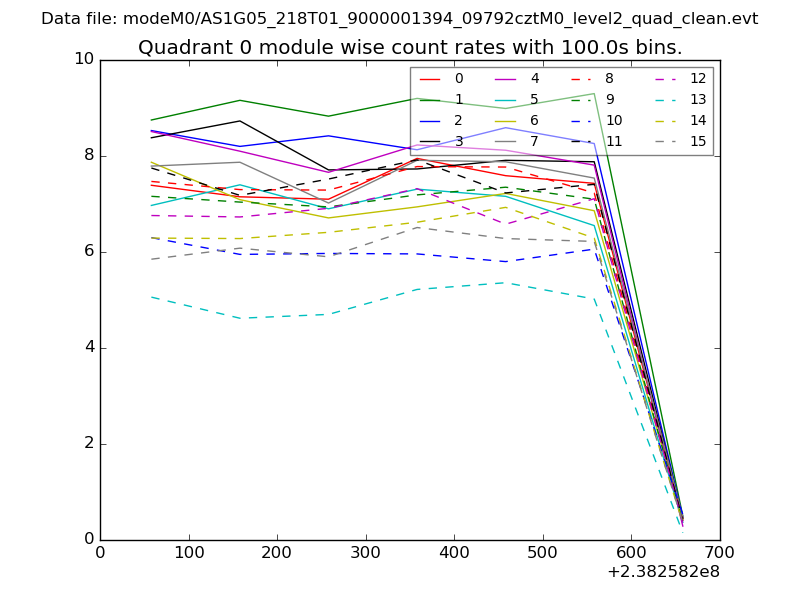
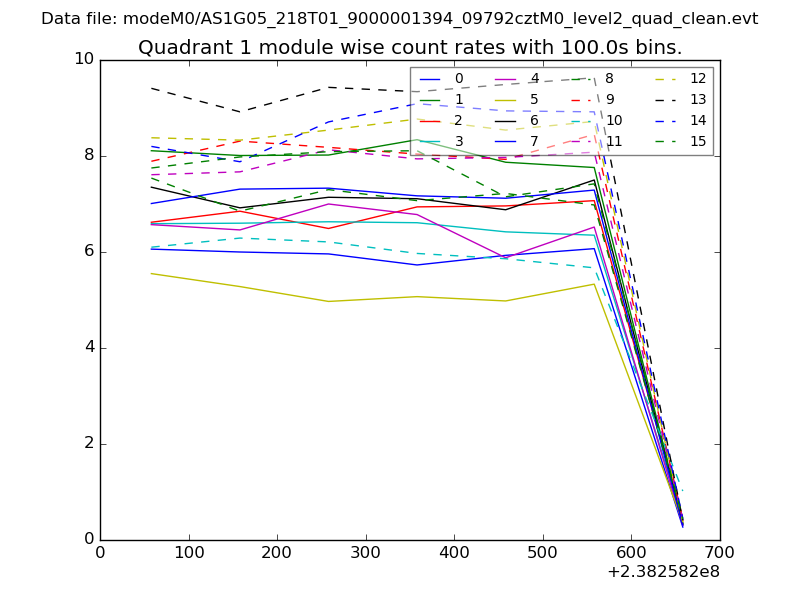
| Module-wise count rates for Quadrant A Data is divided into 100 sec bins |
 |
 |
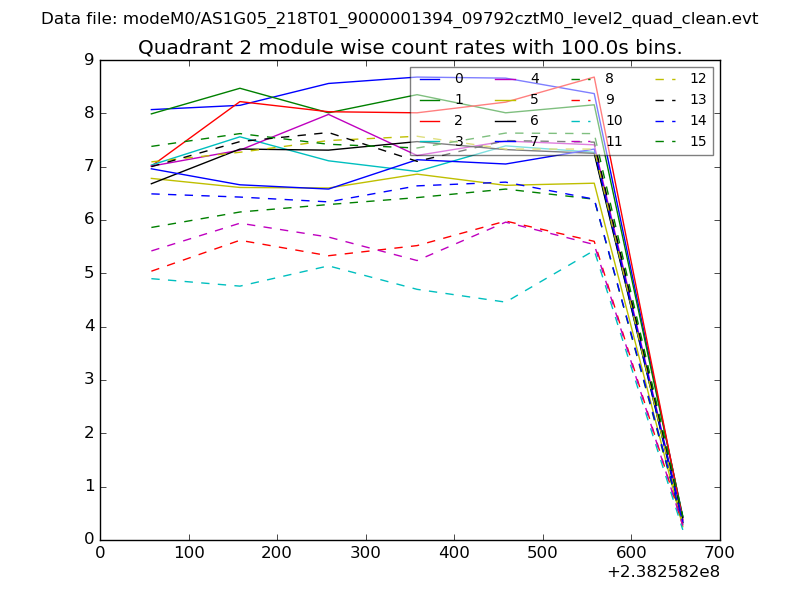
| Module-wise count rates for Quadrant B Data is divided into 100 sec bins |
 |
 |
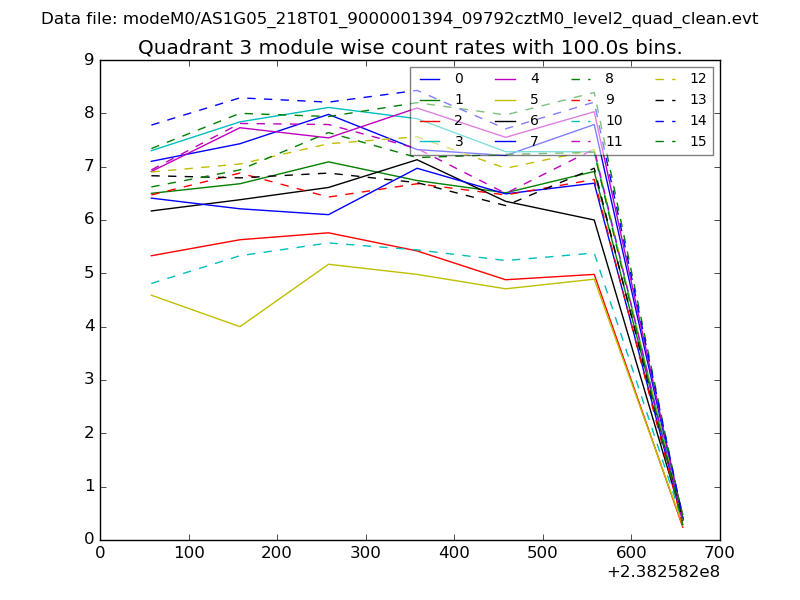
| Module-wise count rates for Quadrant C Data is divided into 100 sec bins |
 |
 |
| Module-wise count rates for Quadrant D Data is divided into 100 sec bins |
 |
 |
| Parameter | Plot |
|---|---|
| CZT HV Monitor | 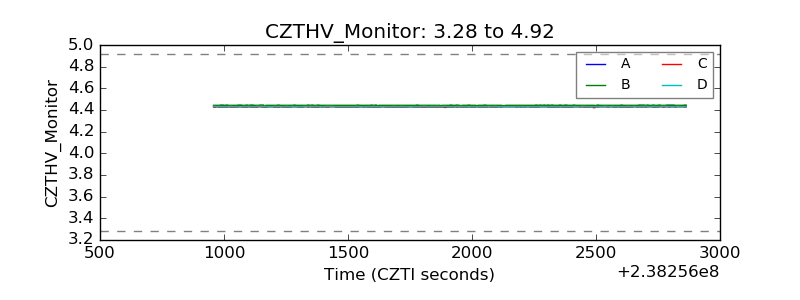 |
| D_VDD | 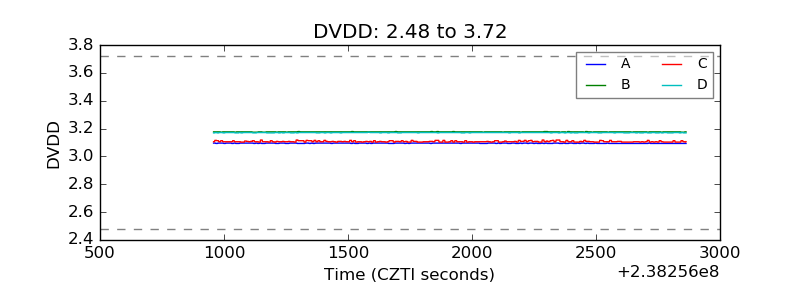 |
| Temperature 1 | 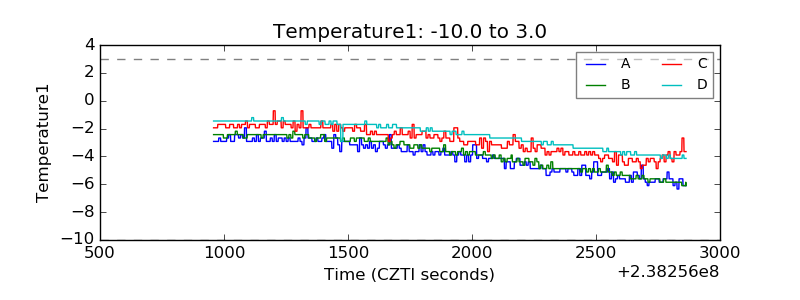 |
| Veto HV Monitor | 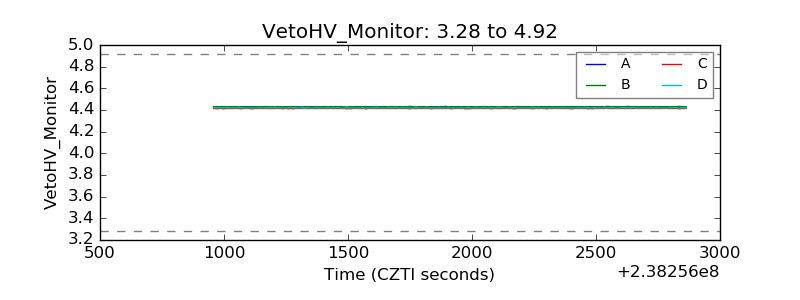 |
| Veto LLD | 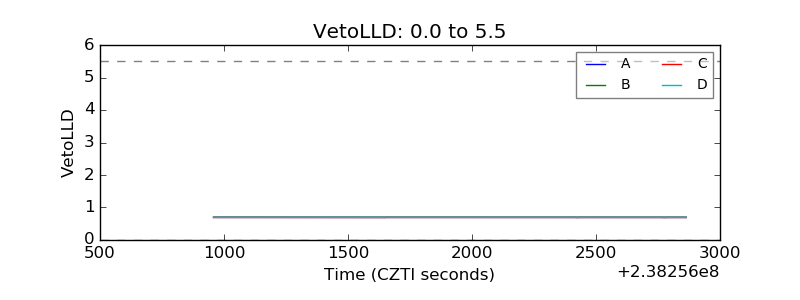 |
| Alpha Counter | 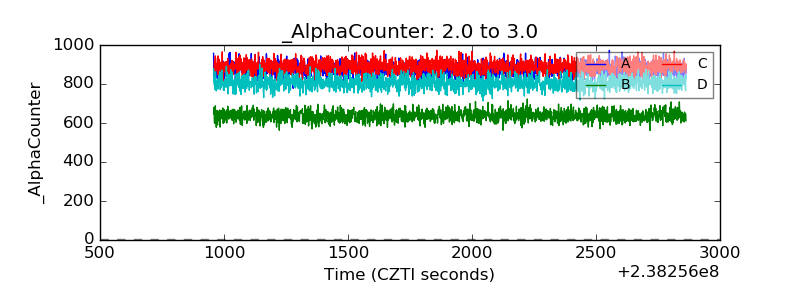 |
| _CPM_Rate | 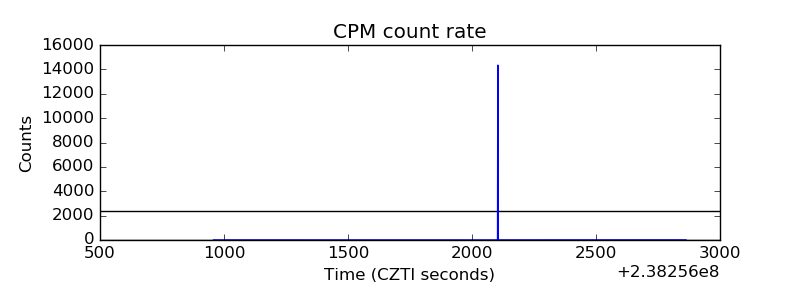 |
| CZT Counter |  |
| +2.5 Volts monitor |  |
| +5 Volts monitor |  |
| _ROLL_ROT | 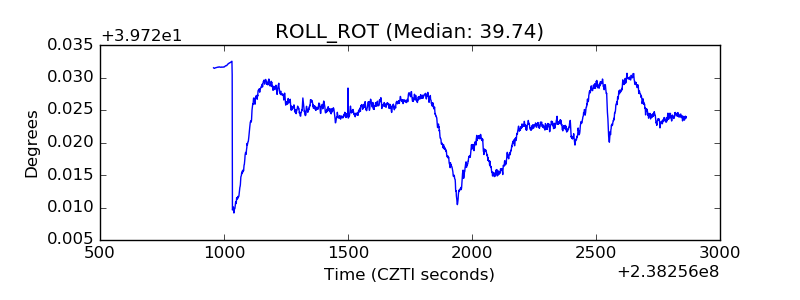 |
| _Roll_DEC | 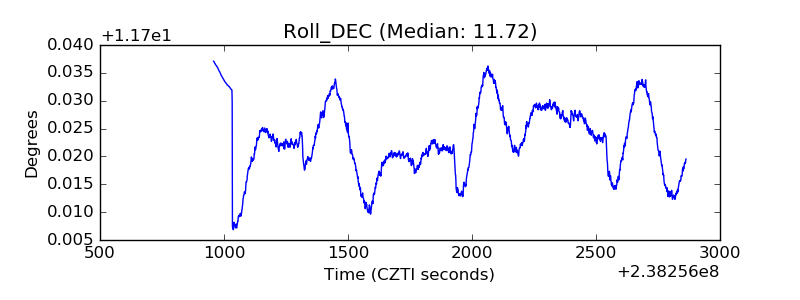 |
| _Roll_RA | 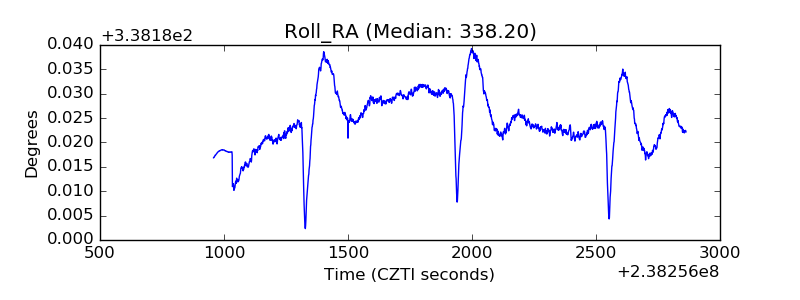 |
| Veto Counter | 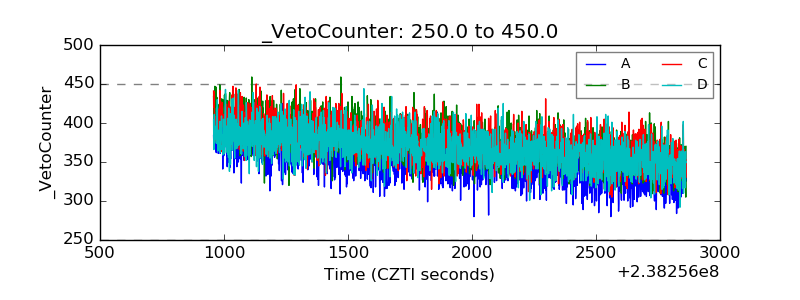 |