| Param | Original file | Final file |
|---|---|---|
| Filename | modeM0/AS1G05_218T01_9000001394_09793cztM0_level2.evt | modeM0/AS1G05_218T01_9000001394_09793cztM0_level2_quad_clean.evt |
| Size (bytes) | 1,079,544,960 | 208,581,120 |
| Size | 1.0 GB | 198.9 MB |
| Events in quadrant A | 7,217,920 | 1,325,111 |
| Events in quadrant B | 7,390,302 | 1,353,244 |
| Events in quadrant C | 7,002,887 | 1,313,263 |
| Events in quadrant D | 10,027,974 | 1,250,846 |
| Mode SS | |||
|---|---|---|---|
| Quadrant | BADHDUFLAG | Total packets | Discarded packets |
| A | 0 | 332 | 16 |
| B | 0 | 332 | 26 |
| C | 0 | 332 | 8 |
| D | 0 | 332 | 18 |
| Mode M0 | |||
|---|---|---|---|
| Quadrant | BADHDUFLAG | Total packets | Discarded packets |
| A | 0 | 33729 | 1557 |
| B | 0 | 34084 | 1492 |
| C | 0 | 33271 | 1564 |
| D | 0 | 42652 | 2207 |
| Mode M9 | |||
|---|---|---|---|
| Quadrant | BADHDUFLAG | Total packets | Discarded packets |
| A | 0 | 23 | 1 |
| B | 0 | 23 | 0 |
| C | 0 | 23 | 0 |
| D | 0 | 23 | 0 |
| Quadrant | Total seconds | Saturated seconds | Saturation percentage |
|---|---|---|---|
| A | 15581 | 154 | 0.988383% |
| B | 15626 | 154 | 0.985537% |
| C | 15581 | 88 | 0.564790% |
| D | 15512 | 523 | 3.371583% |
Noise dominated data is calculated using 1-second bins in cleaned event files. If a bin has >2000 counts, and if more than 50% of those come from <1% of pixels, then it is considered to be noise-dominated and hence unusable.
| Quadrant | # 1 sec bins | Bins with >0 counts | Bins with >2000 counts | High rate bins dominated by noise | Noise dominated (total time) | Noise dominated (detector-on time) | Marked lightcurve |
|---|---|---|---|---|---|---|---|
| A | 18657 | 16231 | 60 | 60 | 0.32% | 0.37% | 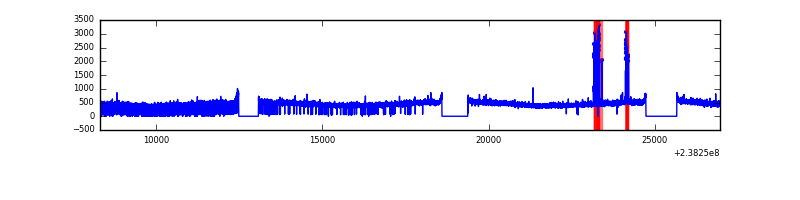 |
| B | 18657 | 16245 | 9 | 9 | 0.05% | 0.06% | 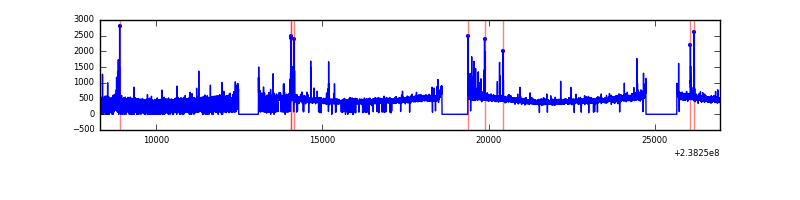 |
| C | 18657 | 16219 | 6 | 6 | 0.03% | 0.04% | 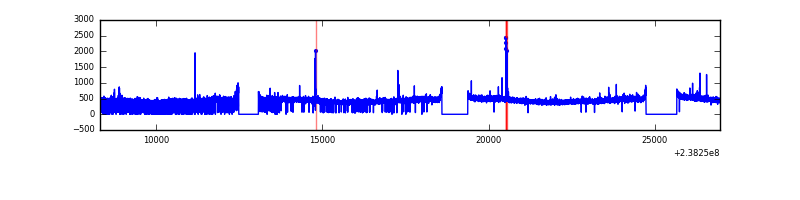 |
| D | 18657 | 16232 | 390 | 390 | 2.09% | 2.40% | 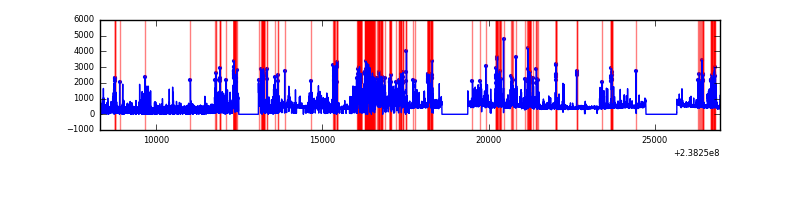 |
Top three noisy pixels from each quadrant. If the there are fewer than three noisy pixels in the level2.evt file, extra rows are filled as -1
| Pixel properties | Quadrant properties | ||||||
|---|---|---|---|---|---|---|---|
| Quadrant | DetID | PixID | Counts | Sigma | Mean | Median | Sigma |
| A | 12 | 210 | 221677 | 597.37 | 1817 | 1776 | 368.1 |
| A | 0 | 226 | 16670 | 40.46 | 1817 | 1776 | 368.1 |
| A | 12 | 194 | 14965 | 35.83 | 1817 | 1776 | 368.1 |
| B | 4 | 239 | 102409 | 286.57 | 1832 | 1790 | 351.1 |
| B | 0 | 214 | 51221 | 140.78 | 1832 | 1790 | 351.1 |
| B | 12 | 111 | 39971 | 108.74 | 1832 | 1790 | 351.1 |
| C | 14 | 234 | 51088 | 120.47 | 1772 | 1780 | 409.3 |
| C | 5 | 128 | 16304 | 35.49 | 1772 | 1780 | 409.3 |
| C | 13 | 61 | 13084 | 27.62 | 1772 | 1780 | 409.3 |
| D | 1 | 52 | 1231043 | 2851.77 | 1739 | 1694 | 431.1 |
| D | 12 | 233 | 919294 | 2128.6 | 1739 | 1694 | 431.1 |
| D | 10 | 199 | 479703 | 1108.86 | 1739 | 1694 | 431.1 |
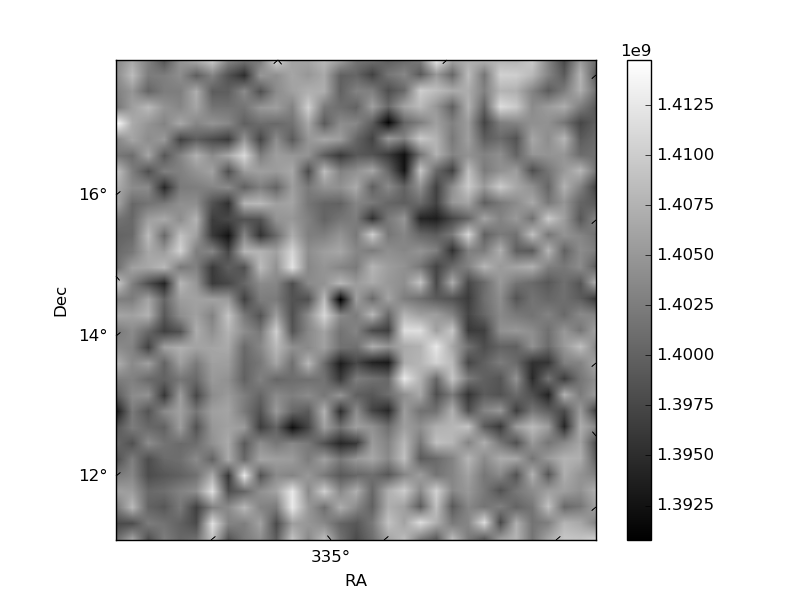
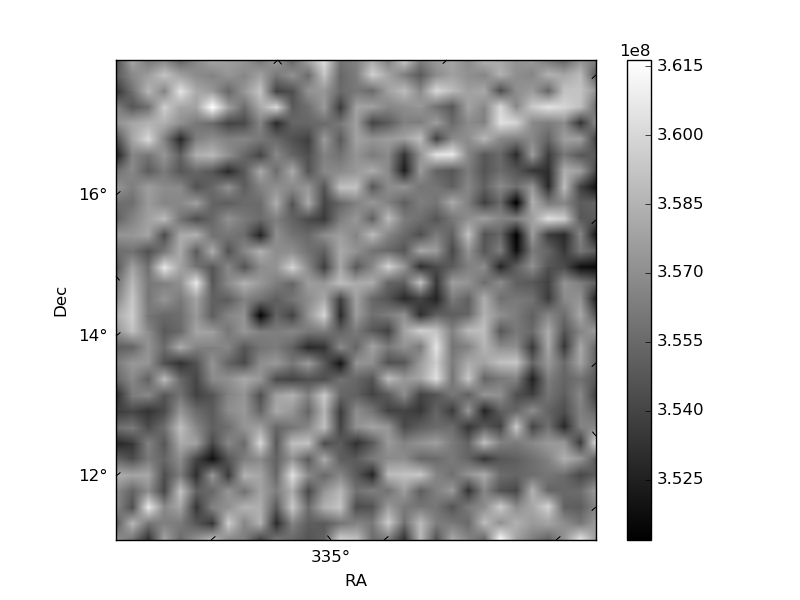
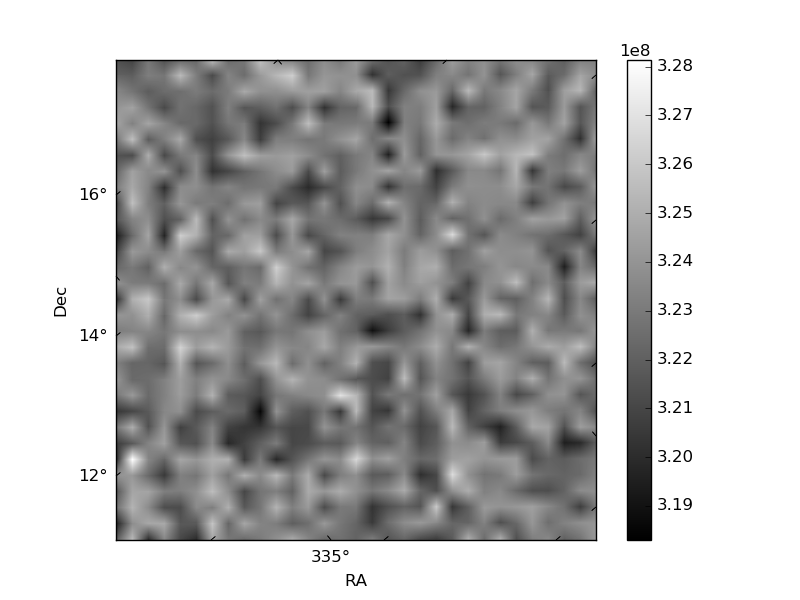
Histogram calculated using DETX and DETY for each event in the final _common_clean file
| Quadrant A | 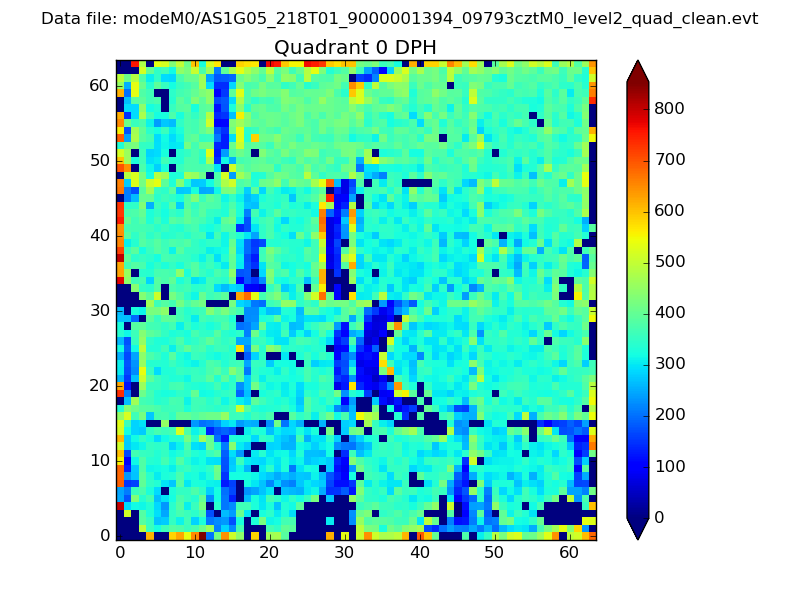 |
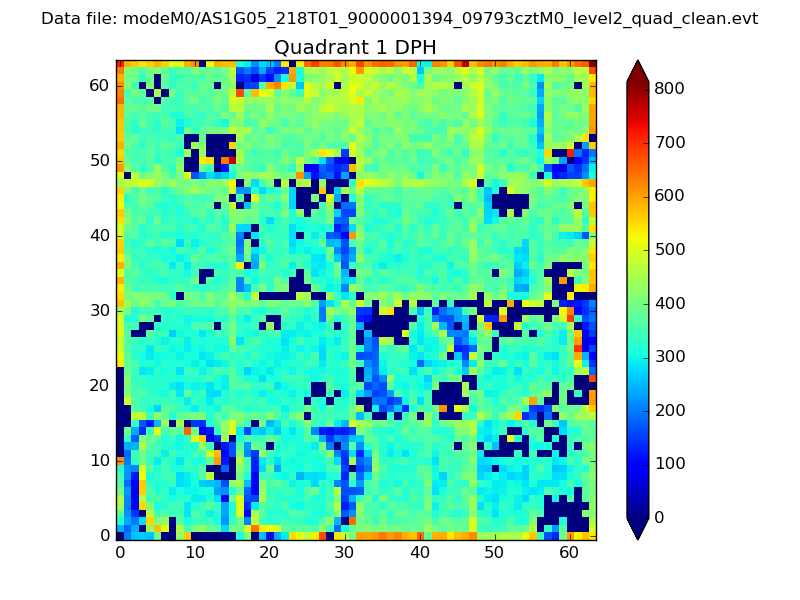 |
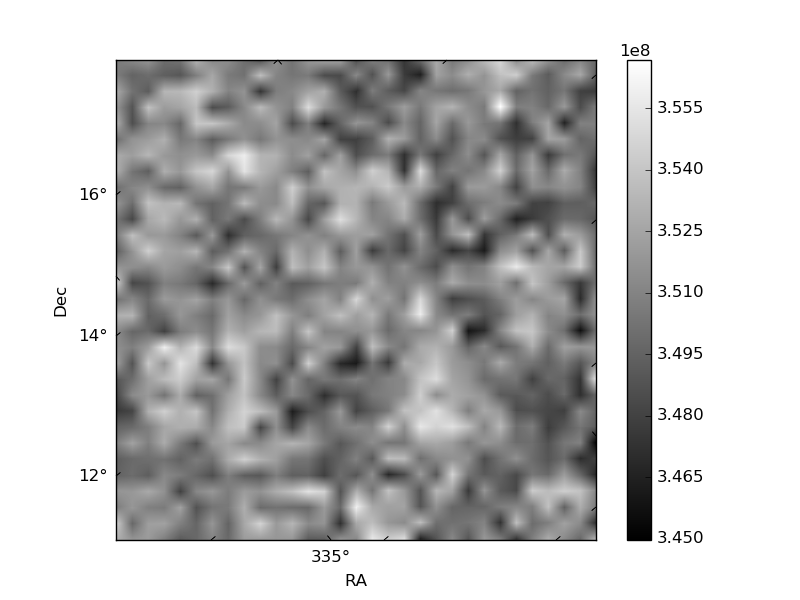
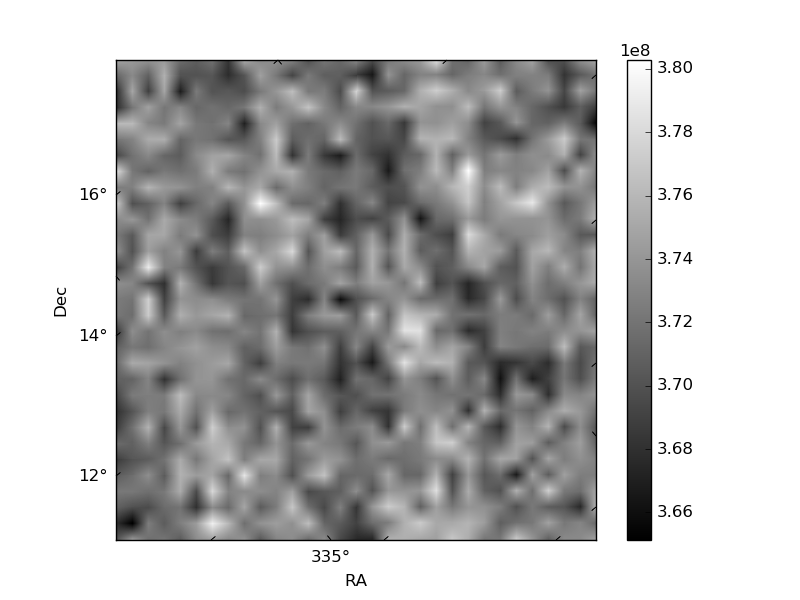
Quadrant B |
|---|---|---|---|
| Quadrant D | 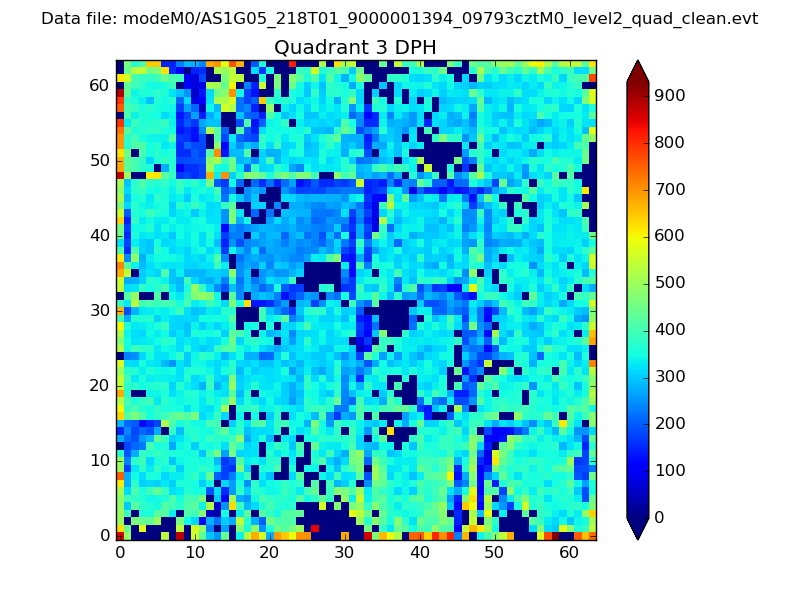 |
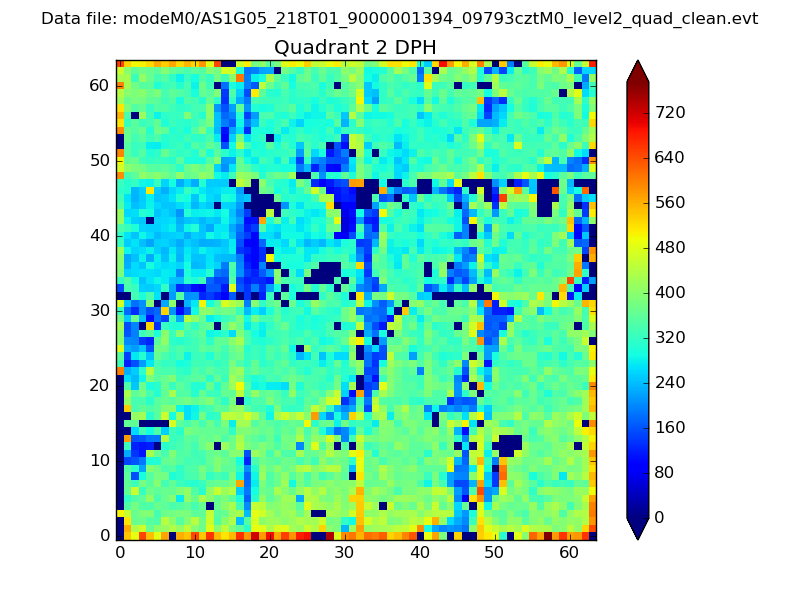 |
Quadrant C |
| Plot type | Count rate plots | Images |
|---|---|---|
| Comparison with Poisson distribution Blue bars denote a histogram of data divided into 1 sec bins. Red curve is a Poisson curve with rate = median count rate of data. |
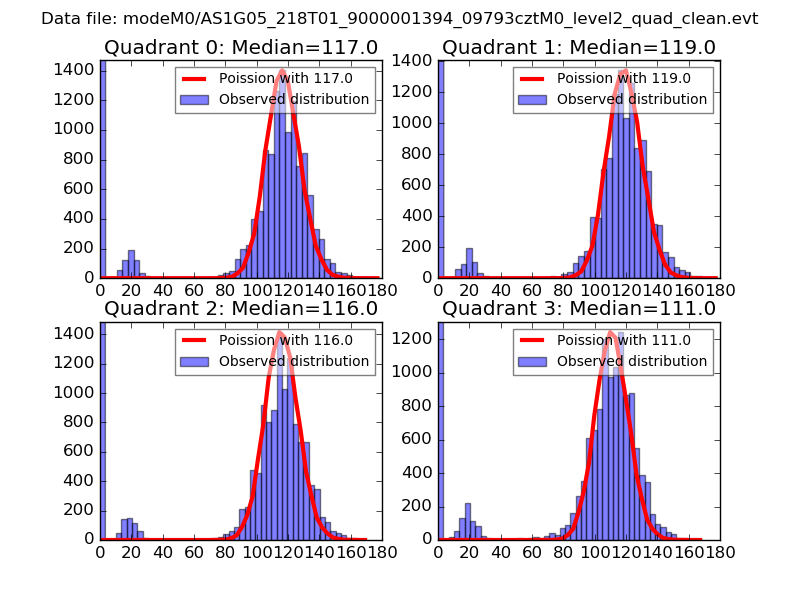 |
 |
| Quadrant-wise count rates Data is divided into 100 sec bins |
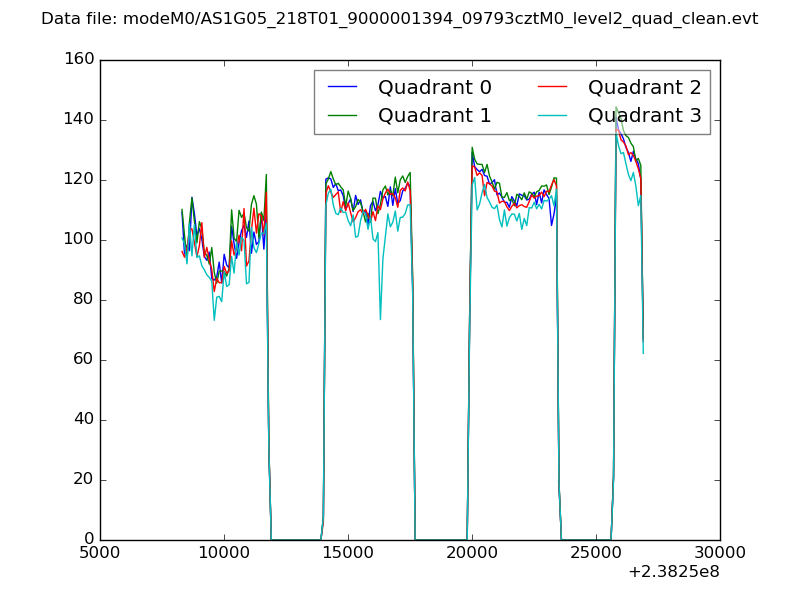 |
|
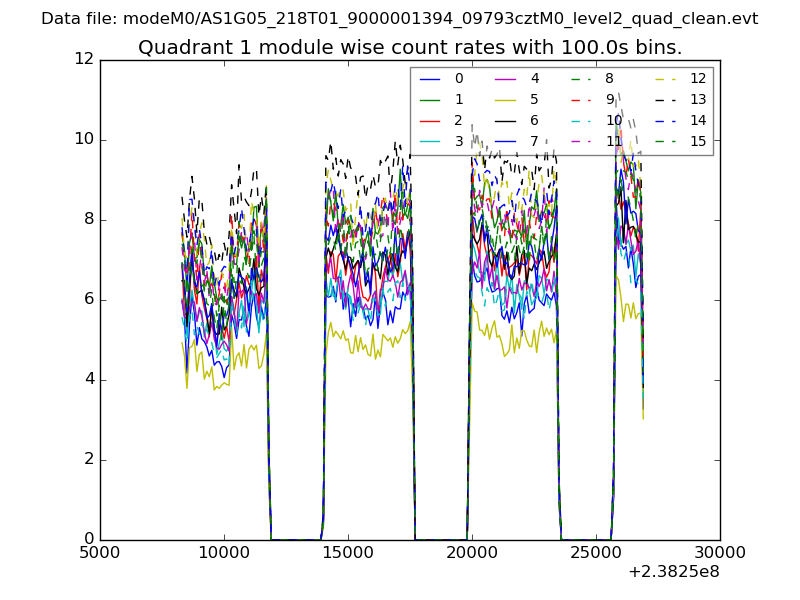
| Module-wise count rates for Quadrant A Data is divided into 100 sec bins |
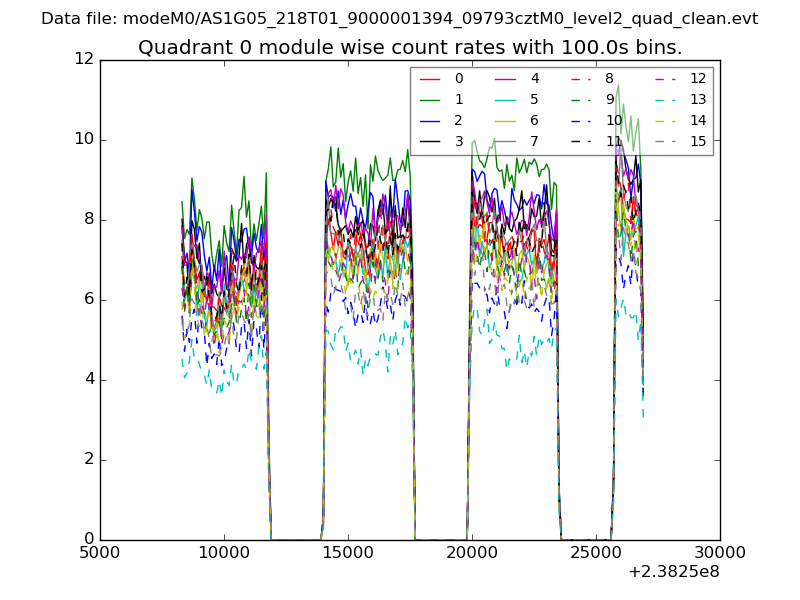 |
 |
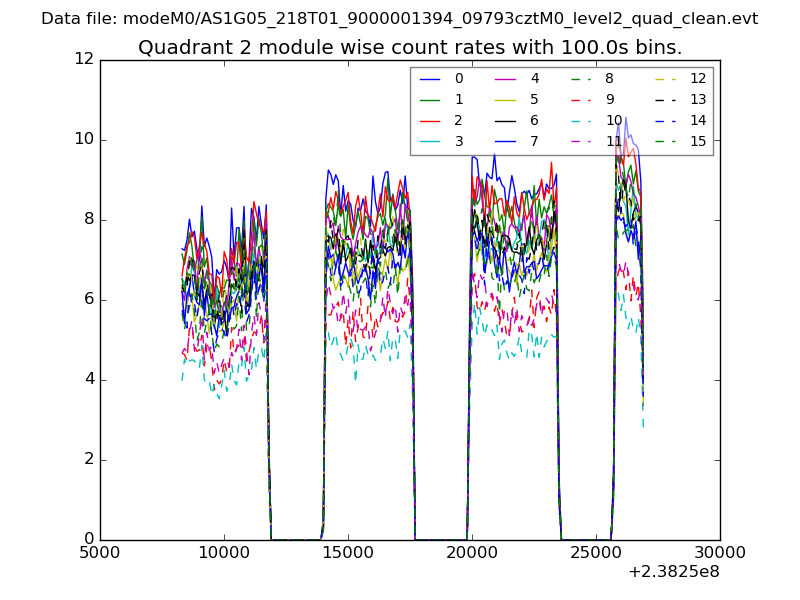
| Module-wise count rates for Quadrant B Data is divided into 100 sec bins |
 |
 |
| Module-wise count rates for Quadrant C Data is divided into 100 sec bins |
 |
 |
| Module-wise count rates for Quadrant D Data is divided into 100 sec bins |
 |
 |
| Parameter | Plot |
|---|---|
| CZT HV Monitor | 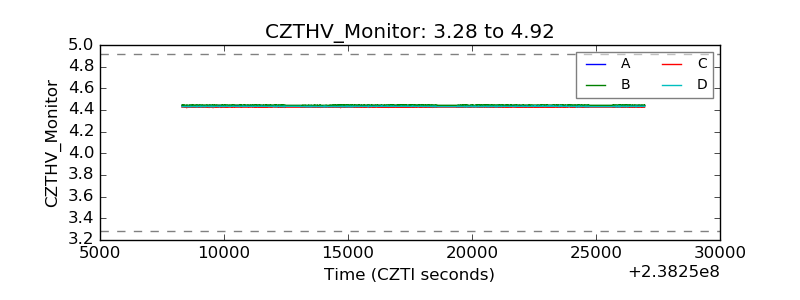 |
| D_VDD |  |
| Temperature 1 | 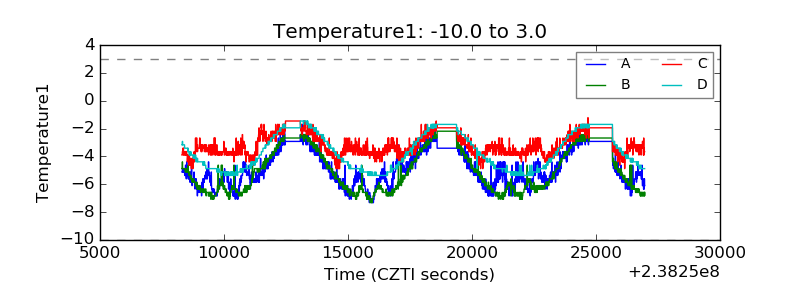 |
| Veto HV Monitor | 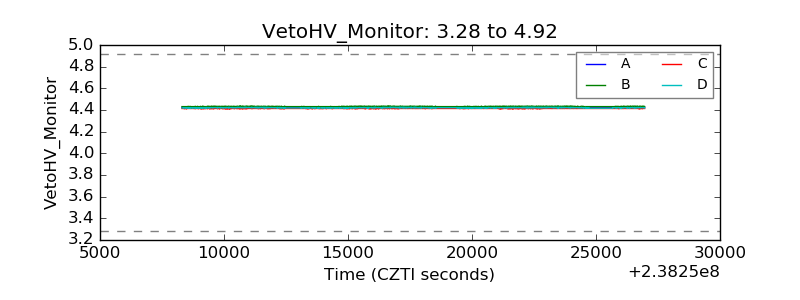 |
| Veto LLD | 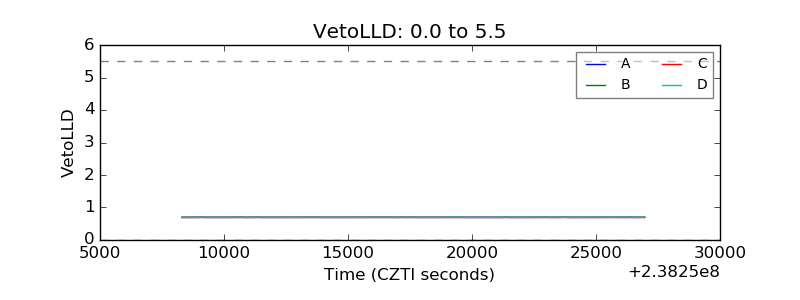 |
| Alpha Counter | 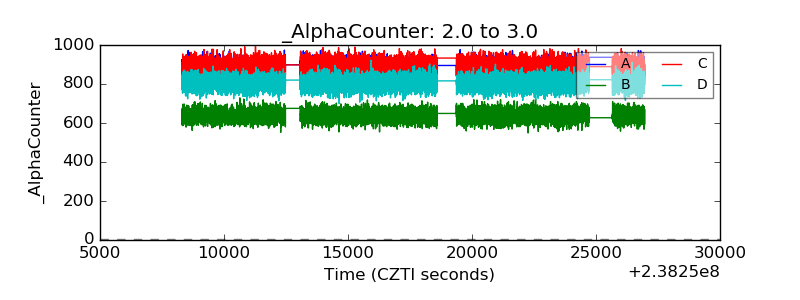 |
| _CPM_Rate | 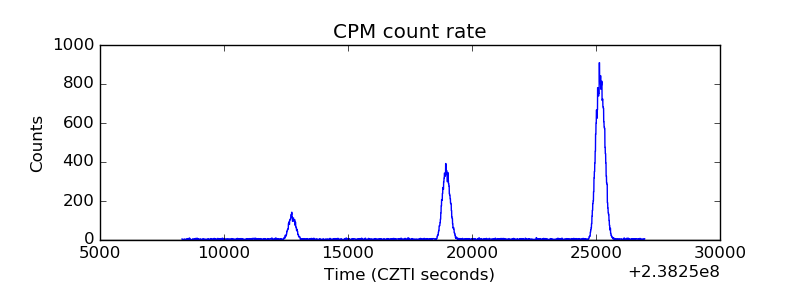 |
| CZT Counter | 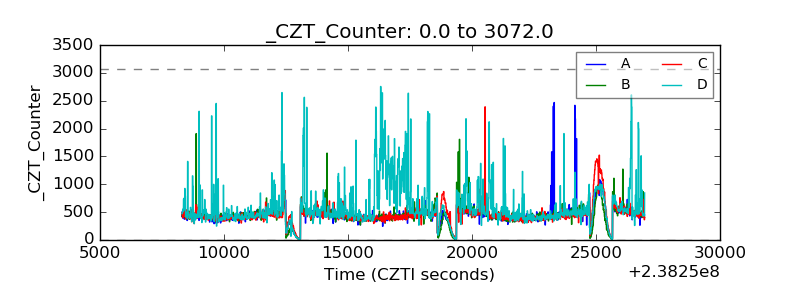 |
| +2.5 Volts monitor |  |
| +5 Volts monitor | 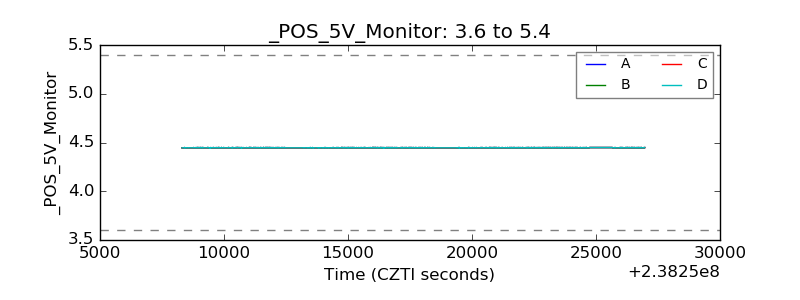 |
| _ROLL_ROT | 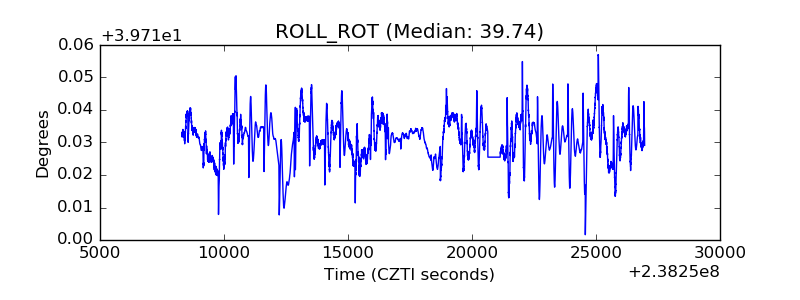 |
| _Roll_DEC |  |
| _Roll_RA | 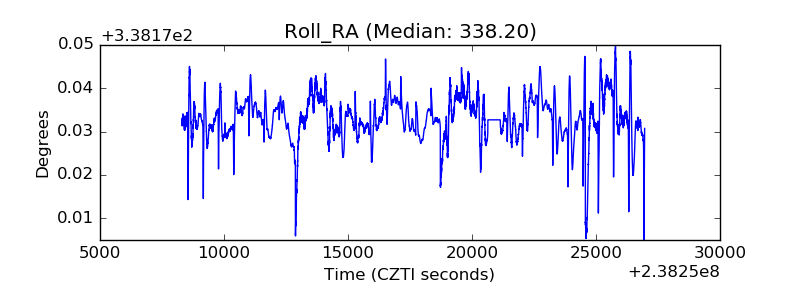 |
| Veto Counter | 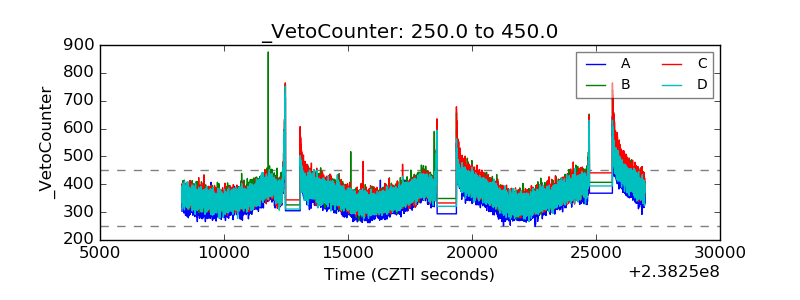 |