| Param | Original file | Final file |
|---|---|---|
| Filename | modeM0/AS1G05_218T01_9000001394_09796cztM0_level2.evt | modeM0/AS1G05_218T01_9000001394_09796cztM0_level2_quad_clean.evt |
| Size (bytes) | 508,749,120 | 92,543,040 |
| Size | 485.2 MB | 88.3 MB |
| Events in quadrant A | 2,987,677 | 604,827 |
| Events in quadrant B | 3,085,754 | 619,489 |
| Events in quadrant C | 2,978,065 | 605,843 |
| Events in quadrant D | 5,924,880 | 529,283 |
| Mode SS | |||
|---|---|---|---|
| Quadrant | BADHDUFLAG | Total packets | Discarded packets |
| A | 0 | 132 | 0 |
| B | 0 | 132 | 6 |
| C | 0 | 132 | 0 |
| D | 0 | 132 | 6 |
| Mode M0 | |||
|---|---|---|---|
| Quadrant | BADHDUFLAG | Total packets | Discarded packets |
| A | 0 | 13390 | 199 |
| B | 0 | 13596 | 215 |
| C | 0 | 13423 | 209 |
| D | 0 | 22792 | 786 |
| Mode M9 | |||
|---|---|---|---|
| Quadrant | BADHDUFLAG | Total packets | Discarded packets |
| A | 0 | 17 | 0 |
| B | 0 | 17 | 0 |
| C | 0 | 17 | 0 |
| D | 0 | 18 | 0 |
| Quadrant | Total seconds | Saturated seconds | Saturation percentage |
|---|---|---|---|
| A | 6374 | 37 | 0.580483% |
| B | 6369 | 51 | 0.800754% |
| C | 6370 | 27 | 0.423862% |
| D | 6278 | 642 | 10.226187% |
Noise dominated data is calculated using 1-second bins in cleaned event files. If a bin has >2000 counts, and if more than 50% of those come from <1% of pixels, then it is considered to be noise-dominated and hence unusable.
| Quadrant | # 1 sec bins | Bins with >0 counts | Bins with >2000 counts | High rate bins dominated by noise | Noise dominated (total time) | Noise dominated (detector-on time) | Marked lightcurve |
|---|---|---|---|---|---|---|---|
| A | 7625 | 6470 | 0 | 0 | 0.00% | 0.00% | 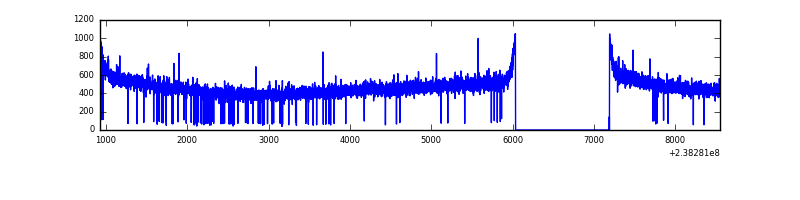 |
| B | 7625 | 6467 | 5 | 5 | 0.07% | 0.08% | 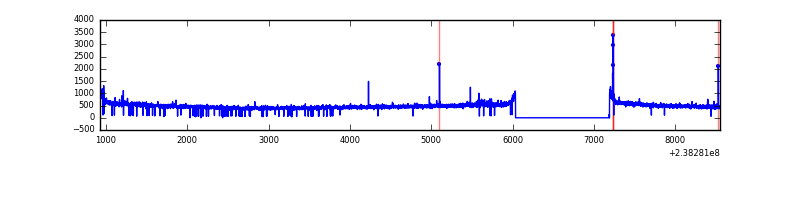 |
| C | 7625 | 6466 | 0 | 0 | 0.00% | 0.00% | 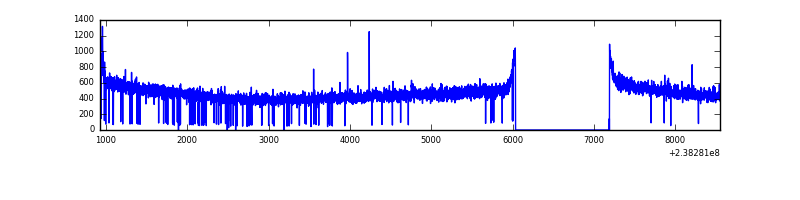 |
| D | 7625 | 6461 | 456 | 456 | 5.98% | 7.06% | 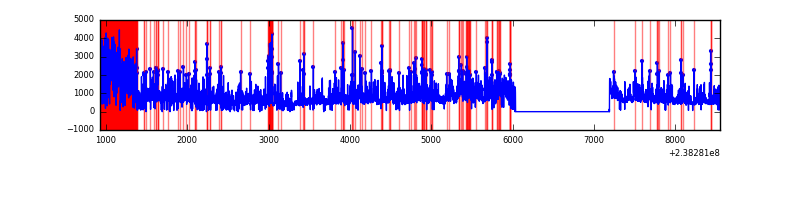 |
Top three noisy pixels from each quadrant. If the there are fewer than three noisy pixels in the level2.evt file, extra rows are filled as -1
| Pixel properties | Quadrant properties | ||||||
|---|---|---|---|---|---|---|---|
| Quadrant | DetID | PixID | Counts | Sigma | Mean | Median | Sigma |
| A | 0 | 226 | 7055 | 40.05 | 775 | 759 | 157.2 |
| A | 12 | 194 | 6313 | 35.33 | 775 | 759 | 157.2 |
| A | 13 | 253 | 4724 | 25.22 | 775 | 759 | 157.2 |
| B | 0 | 214 | 30560 | 198.19 | 782 | 763 | 150.3 |
| B | 12 | 111 | 16632 | 105.55 | 782 | 763 | 150.3 |
| B | 11 | 111 | 13563 | 85.14 | 782 | 763 | 150.3 |
| C | 5 | 128 | 5616 | 27.46 | 761 | 765 | 176.6 |
| C | 13 | 61 | 5548 | 27.08 | 761 | 765 | 176.6 |
| C | 9 | 237 | 2121 | 7.68 | 761 | 765 | 176.6 |
| D | 1 | 52 | 3008637 | 16599.93 | 701 | 685 | 181.2 |
| D | 2 | 152 | 128857 | 707.34 | 701 | 685 | 181.2 |
| D | 2 | 14 | 73350 | 401.02 | 701 | 685 | 181.2 |
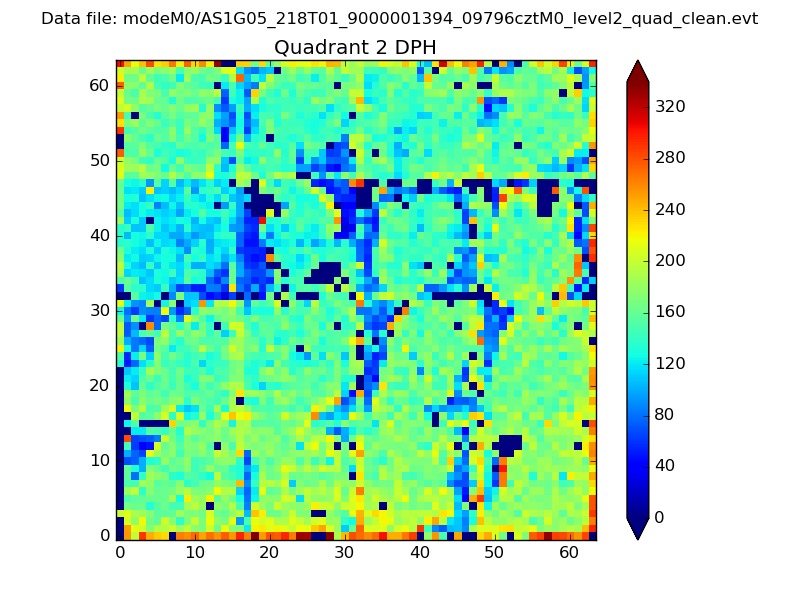
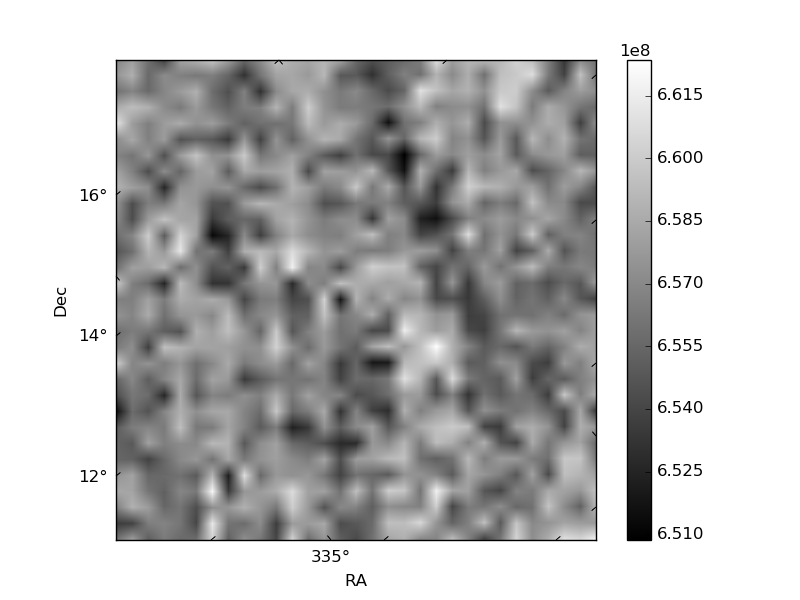
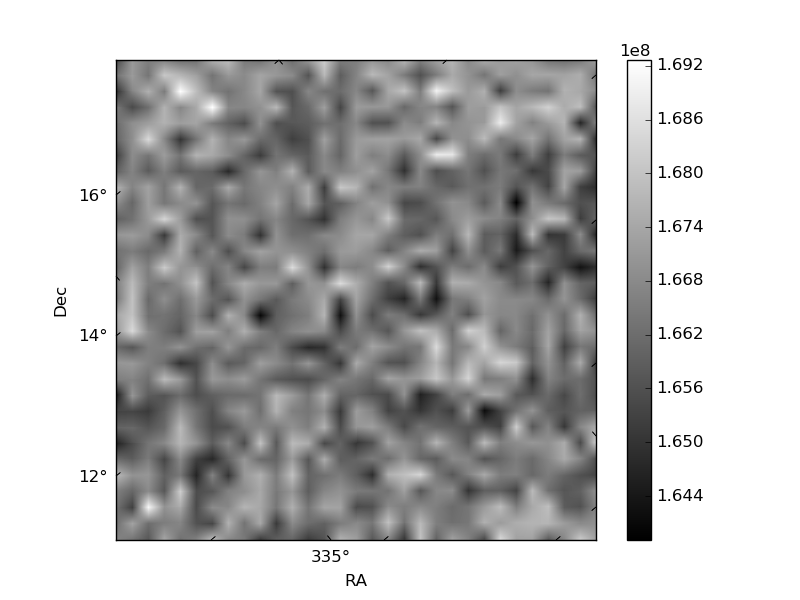
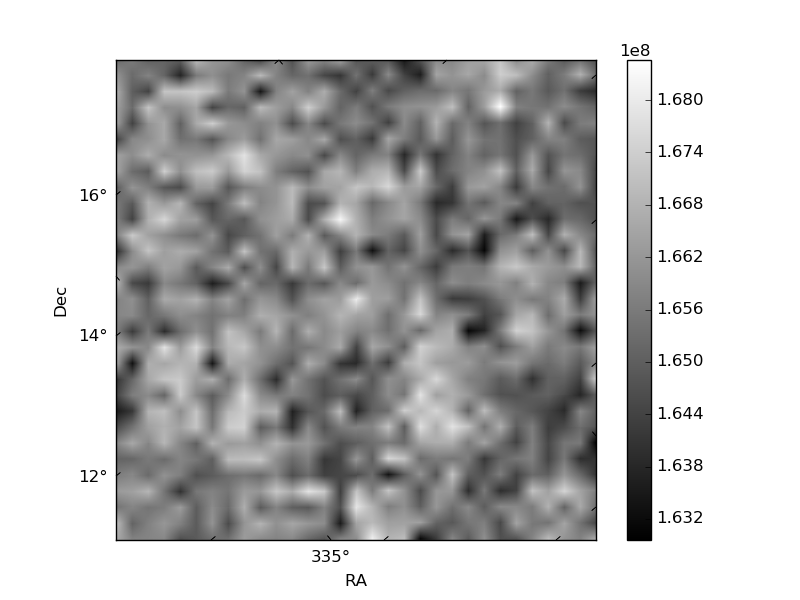
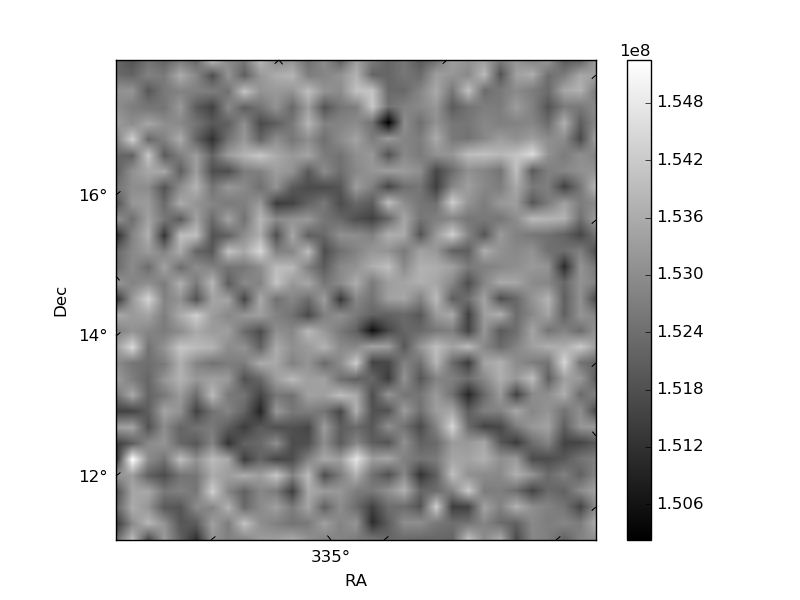
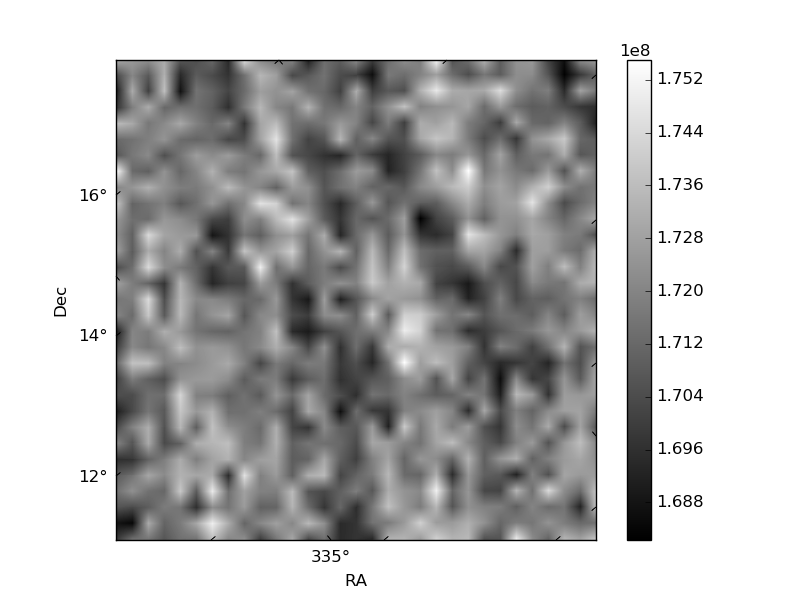
Histogram calculated using DETX and DETY for each event in the final _common_clean file
| Quadrant A | 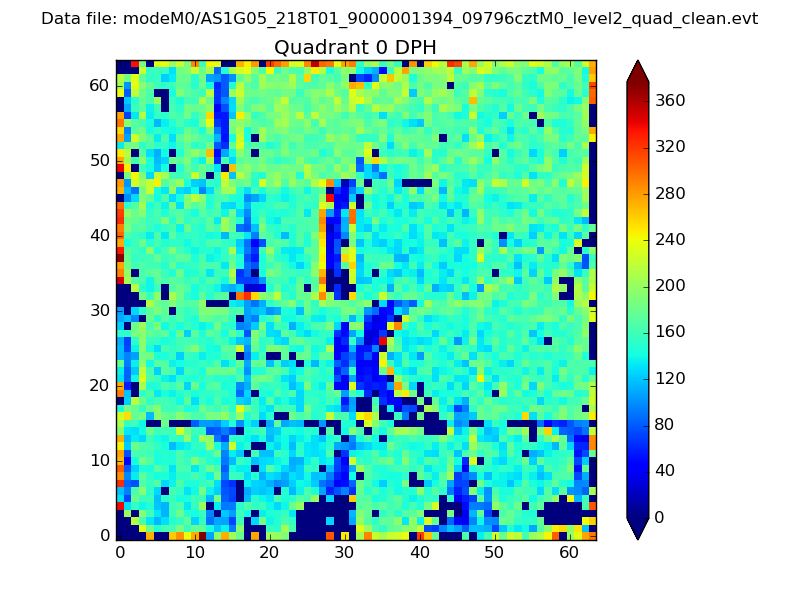 |
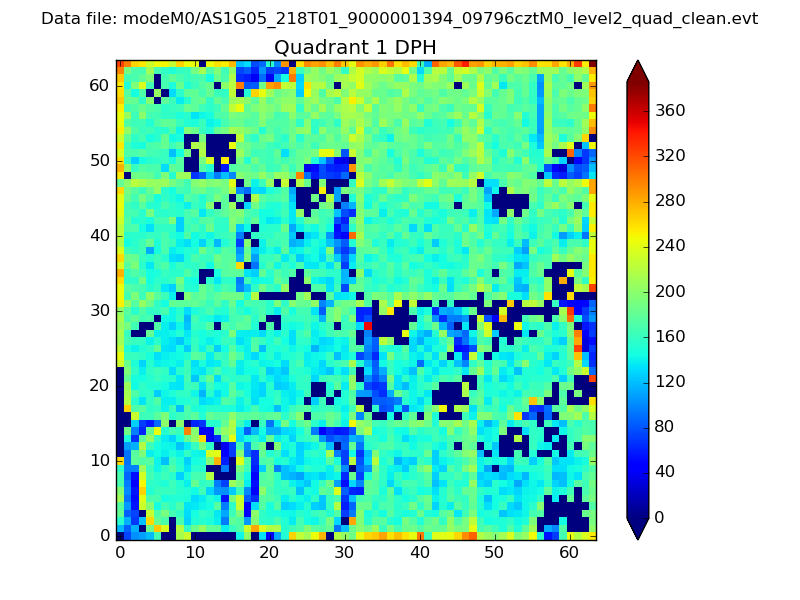 |
Quadrant B |
|---|---|---|---|
| Quadrant D | 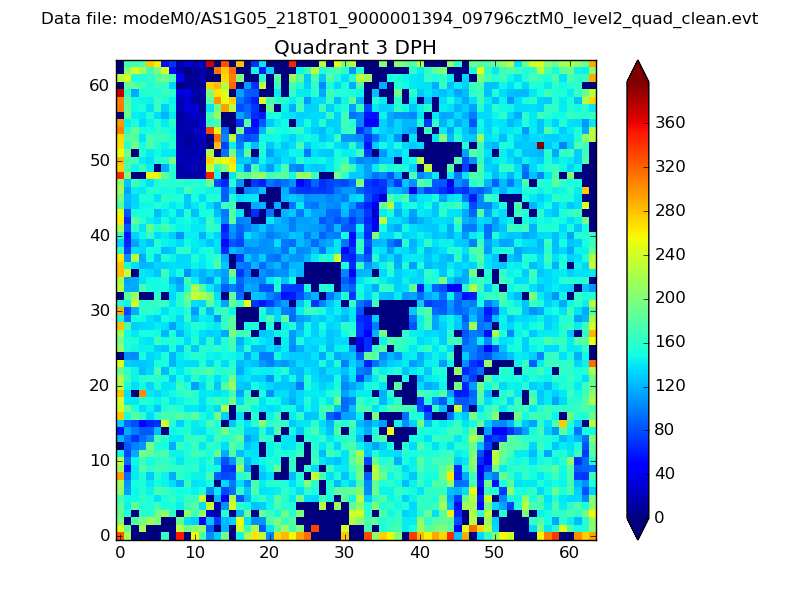 |
 |
Quadrant C |
| Plot type | Count rate plots | Images |
|---|---|---|
| Comparison with Poisson distribution Blue bars denote a histogram of data divided into 1 sec bins. Red curve is a Poisson curve with rate = median count rate of data. |
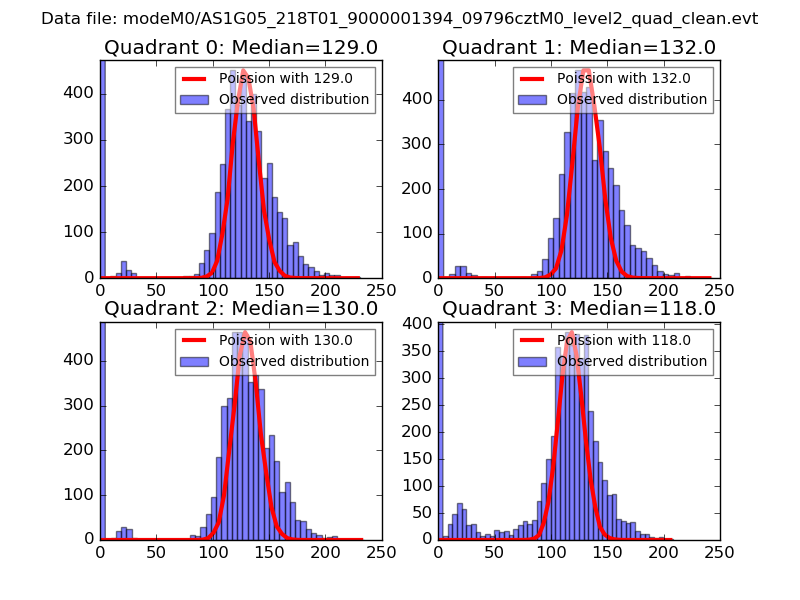 |
 |
| Quadrant-wise count rates Data is divided into 100 sec bins |
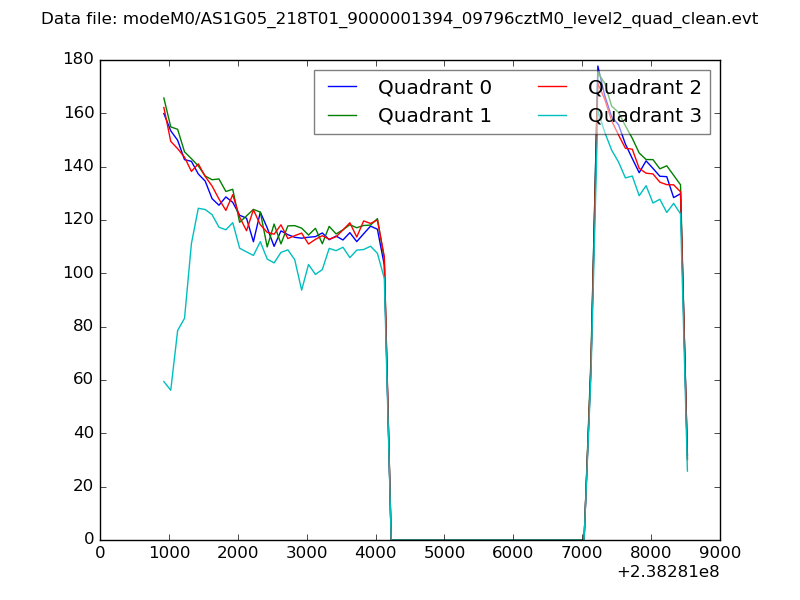 |
|
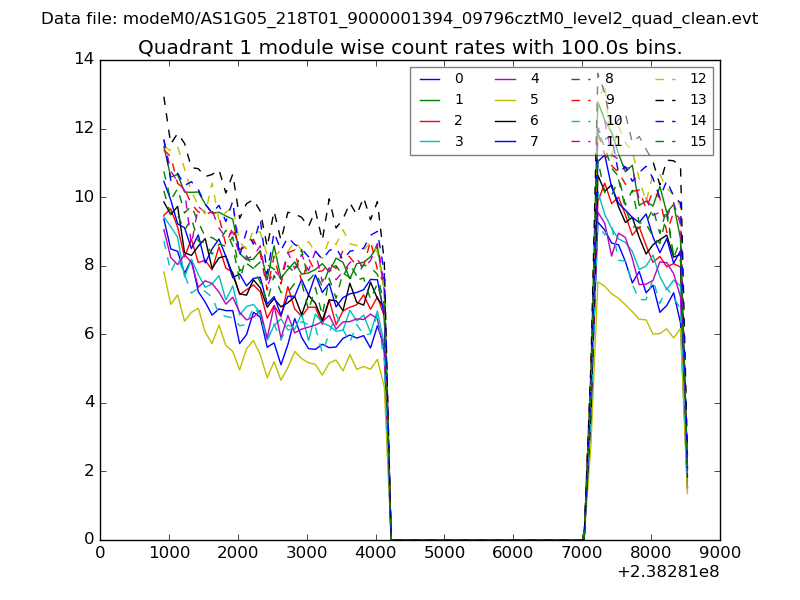
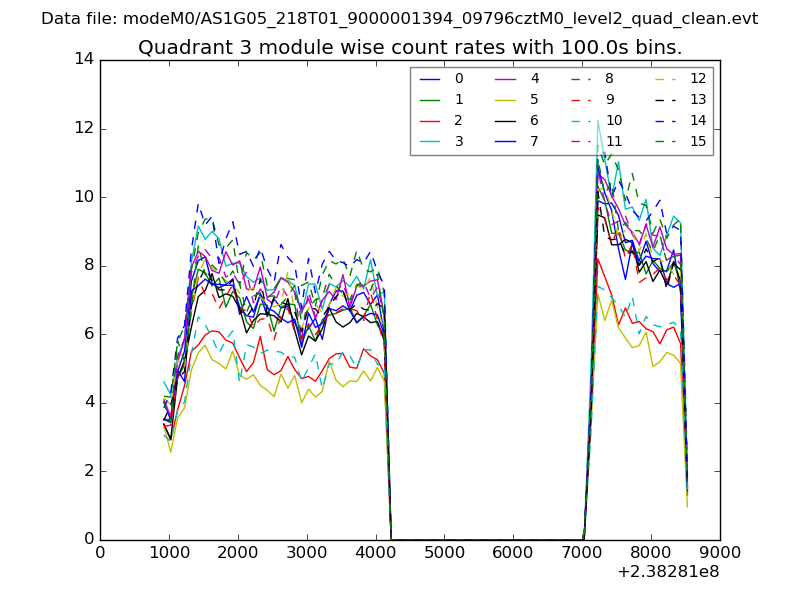
| Module-wise count rates for Quadrant A Data is divided into 100 sec bins |
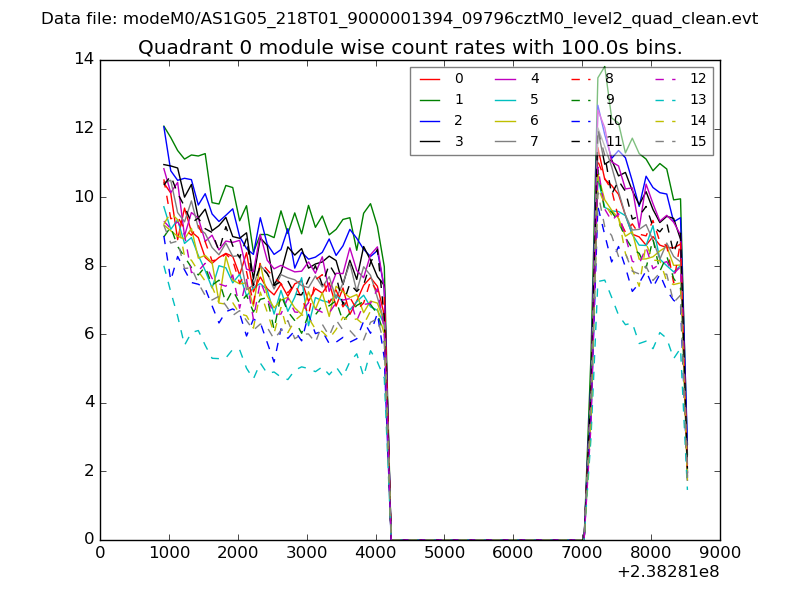 |
 |
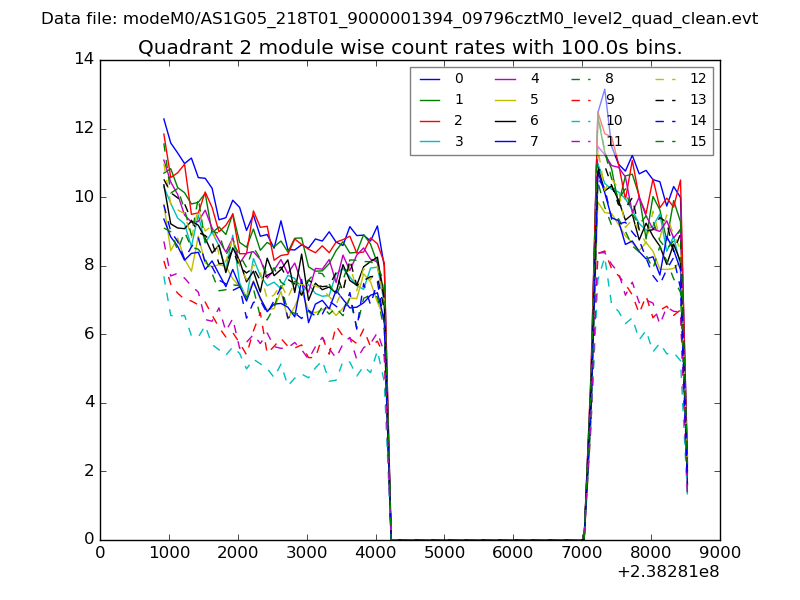
| Module-wise count rates for Quadrant B Data is divided into 100 sec bins |
 |
 |
| Module-wise count rates for Quadrant C Data is divided into 100 sec bins |
 |
 |
| Module-wise count rates for Quadrant D Data is divided into 100 sec bins |
 |
 |
| Parameter | Plot |
|---|---|
| CZT HV Monitor |  |
| D_VDD | 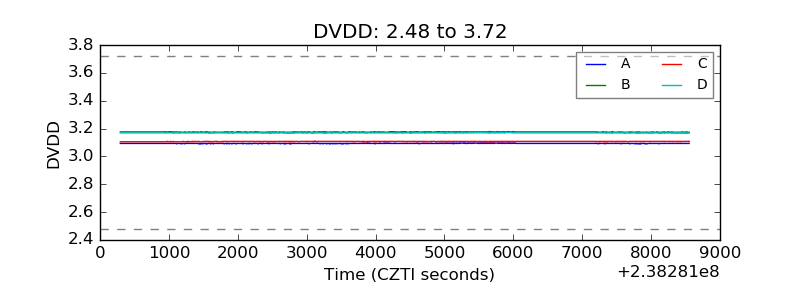 |
| Temperature 1 | 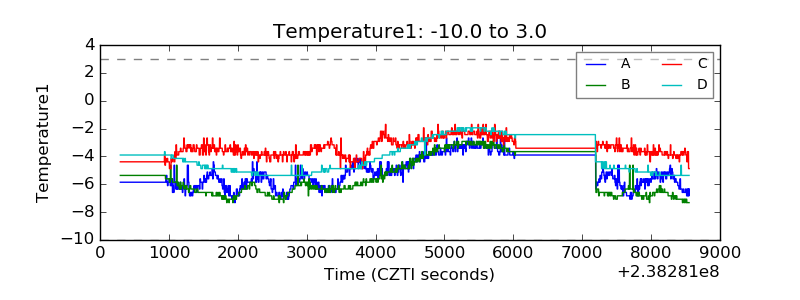 |
| Veto HV Monitor | 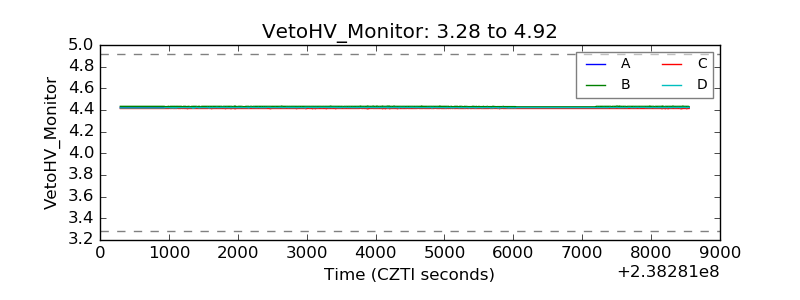 |
| Veto LLD | 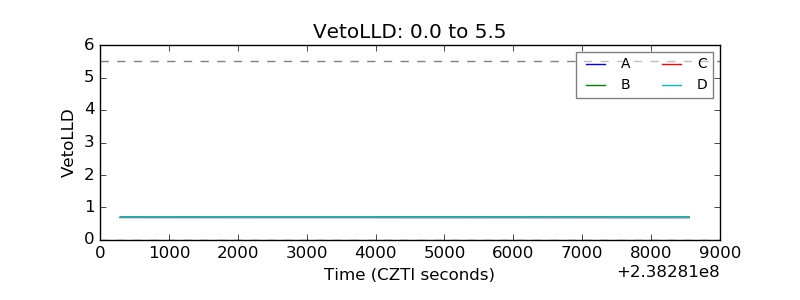 |
| Alpha Counter | 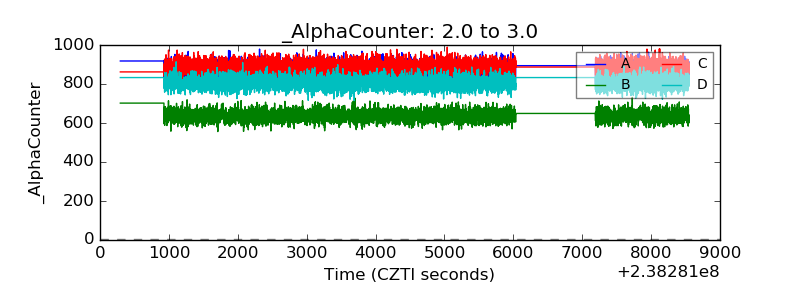 |
| _CPM_Rate | 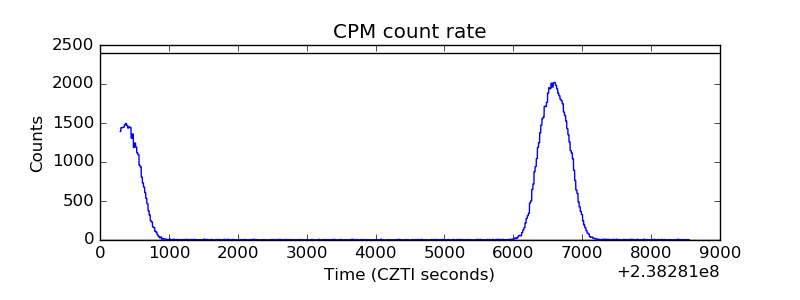 |
| CZT Counter | 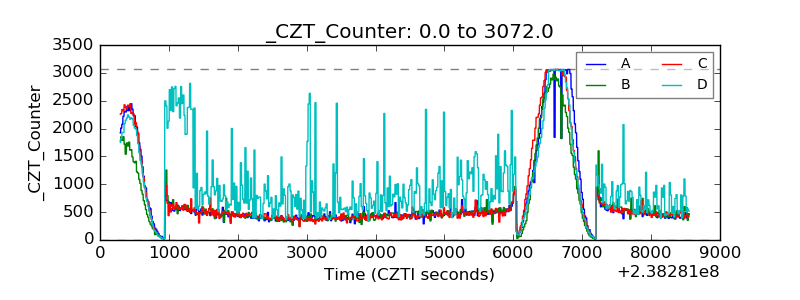 |
| +2.5 Volts monitor |  |
| +5 Volts monitor |  |
| _ROLL_ROT | 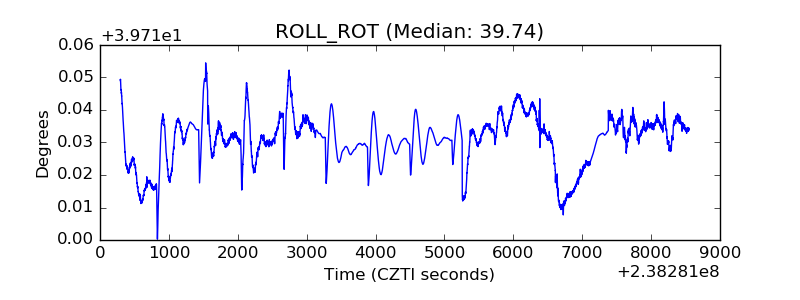 |
| _Roll_DEC | 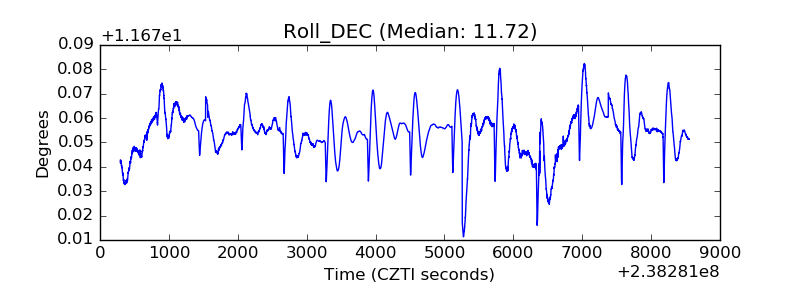 |
| _Roll_RA | 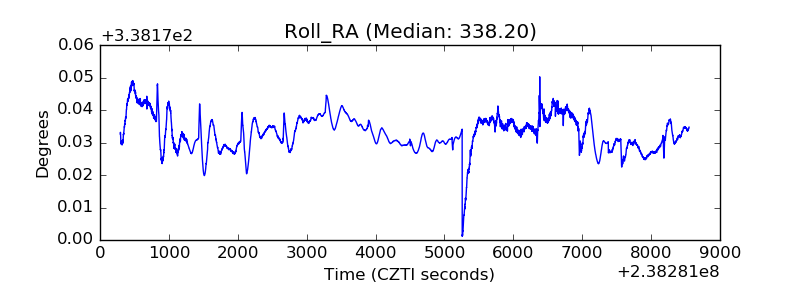 |
| Veto Counter | 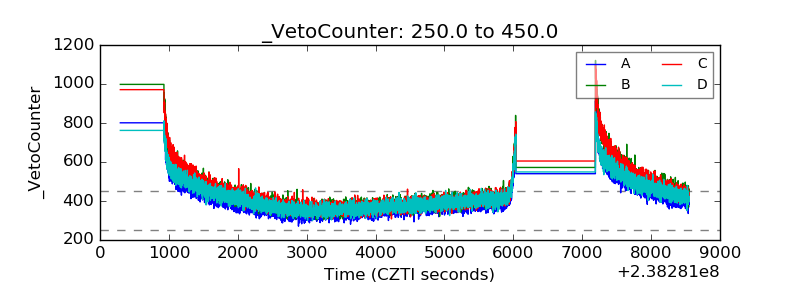 |