| Param | Original file | Final file |
|---|---|---|
| Filename | modeM0/AS1G05_218T01_9000001394_09797cztM0_level2.evt | modeM0/AS1G05_218T01_9000001394_09797cztM0_level2_quad_clean.evt |
| Size (bytes) | 444,772,800 | 84,323,520 |
| Size | 424.2 MB | 80.4 MB |
| Events in quadrant A | 2,878,739 | 545,272 |
| Events in quadrant B | 2,945,237 | 557,819 |
| Events in quadrant C | 2,822,925 | 534,034 |
| Events in quadrant D | 4,416,613 | 498,714 |
| Mode SS | |||
|---|---|---|---|
| Quadrant | BADHDUFLAG | Total packets | Discarded packets |
| A | 0 | 130 | 6 |
| B | 0 | 130 | 6 |
| C | 0 | 130 | 12 |
| D | 0 | 130 | 4 |
| Mode M0 | |||
|---|---|---|---|
| Quadrant | BADHDUFLAG | Total packets | Discarded packets |
| A | 0 | 13057 | 600 |
| B | 0 | 13225 | 630 |
| C | 0 | 13056 | 689 |
| D | 0 | 18370 | 1128 |
| Mode M9 | |||
|---|---|---|---|
| Quadrant | BADHDUFLAG | Total packets | Discarded packets |
| A | 0 | 15 | 0 |
| B | 0 | 15 | 0 |
| C | 0 | 15 | 0 |
| D | 0 | 16 | 0 |
| Quadrant | Total seconds | Saturated seconds | Saturation percentage |
|---|---|---|---|
| A | 6000 | 40 | 0.666667% |
| B | 5997 | 49 | 0.817075% |
| C | 5964 | 26 | 0.435949% |
| D | 5920 | 146 | 2.466216% |
Noise dominated data is calculated using 1-second bins in cleaned event files. If a bin has >2000 counts, and if more than 50% of those come from <1% of pixels, then it is considered to be noise-dominated and hence unusable.
| Quadrant | # 1 sec bins | Bins with >0 counts | Bins with >2000 counts | High rate bins dominated by noise | Noise dominated (total time) | Noise dominated (detector-on time) | Marked lightcurve |
|---|---|---|---|---|---|---|---|
| A | 7548 | 6188 | 0 | 0 | 0.00% | 0.00% | 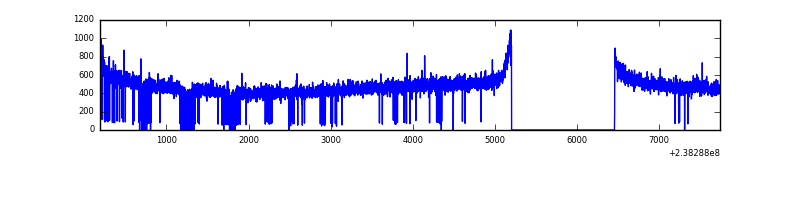 |
| B | 7548 | 6188 | 3 | 3 | 0.04% | 0.05% | 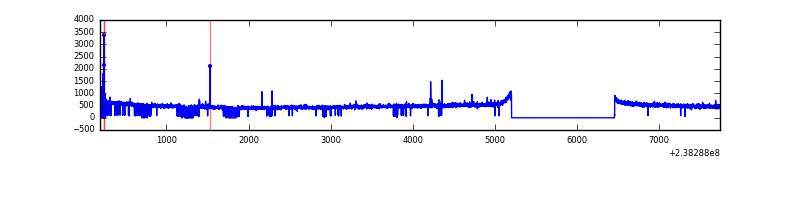 |
| C | 7548 | 6174 | 0 | 0 | 0.00% | 0.00% | 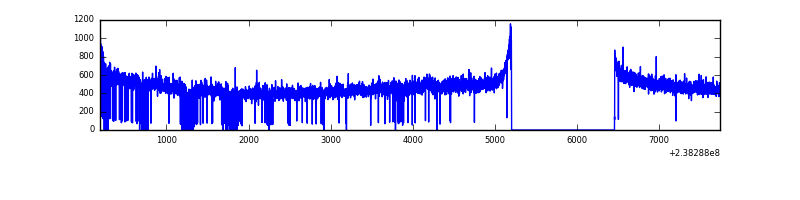 |
| D | 7548 | 6147 | 78 | 78 | 1.03% | 1.27% | 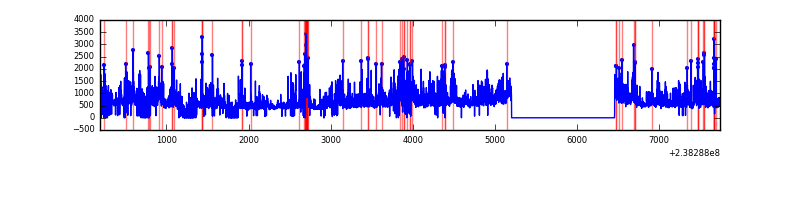 |
Top three noisy pixels from each quadrant. If the there are fewer than three noisy pixels in the level2.evt file, extra rows are filled as -1
| Pixel properties | Quadrant properties | ||||||
|---|---|---|---|---|---|---|---|
| Quadrant | DetID | PixID | Counts | Sigma | Mean | Median | Sigma |
| A | 0 | 226 | 6870 | 40.66 | 747 | 733 | 151.0 |
| A | 12 | 194 | 6056 | 35.26 | 747 | 733 | 151.0 |
| A | 13 | 253 | 5522 | 31.73 | 747 | 733 | 151.0 |
| B | 12 | 111 | 15748 | 105.72 | 750 | 732 | 142.0 |
| B | 11 | 111 | 12874 | 85.48 | 750 | 732 | 142.0 |
| B | 14 | 111 | 10062 | 65.69 | 750 | 732 | 142.0 |
| C | 5 | 128 | 5933 | 31.09 | 722 | 725 | 167.5 |
| C | 13 | 61 | 5397 | 27.89 | 722 | 725 | 167.5 |
| C | 8 | 222 | 3084 | 14.08 | 722 | 725 | 167.5 |
| D | 1 | 52 | 1548254 | 8493.02 | 700 | 686 | 182.2 |
| D | 2 | 152 | 104685 | 570.74 | 700 | 686 | 182.2 |
| D | 7 | 46 | 28843 | 154.53 | 700 | 686 | 182.2 |
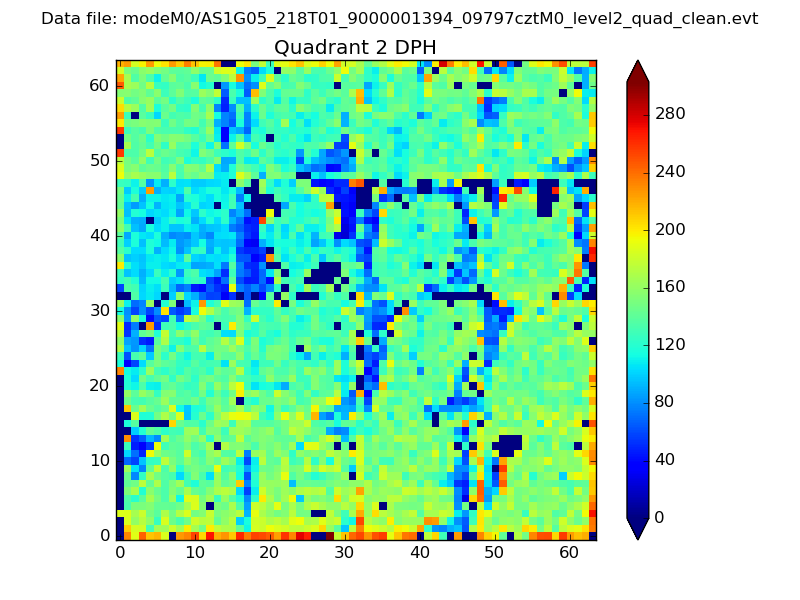
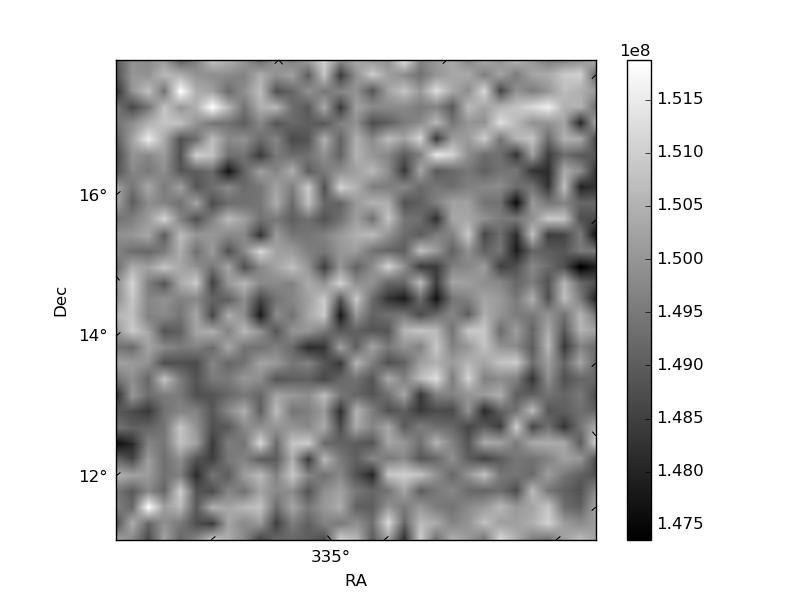
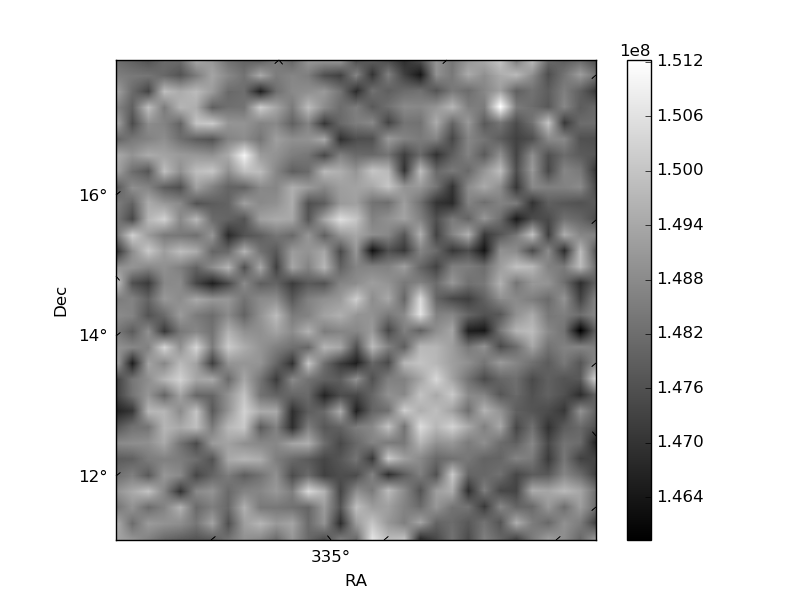
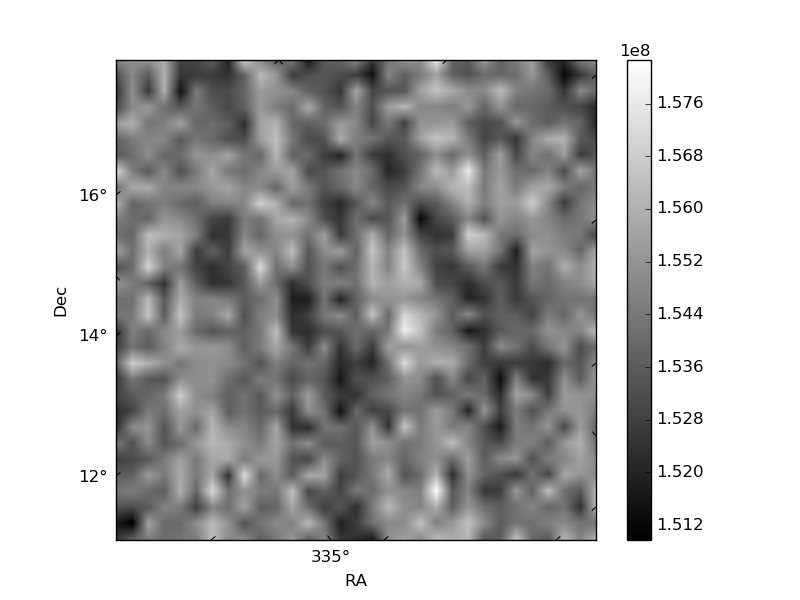
Histogram calculated using DETX and DETY for each event in the final _common_clean file
| Quadrant A | 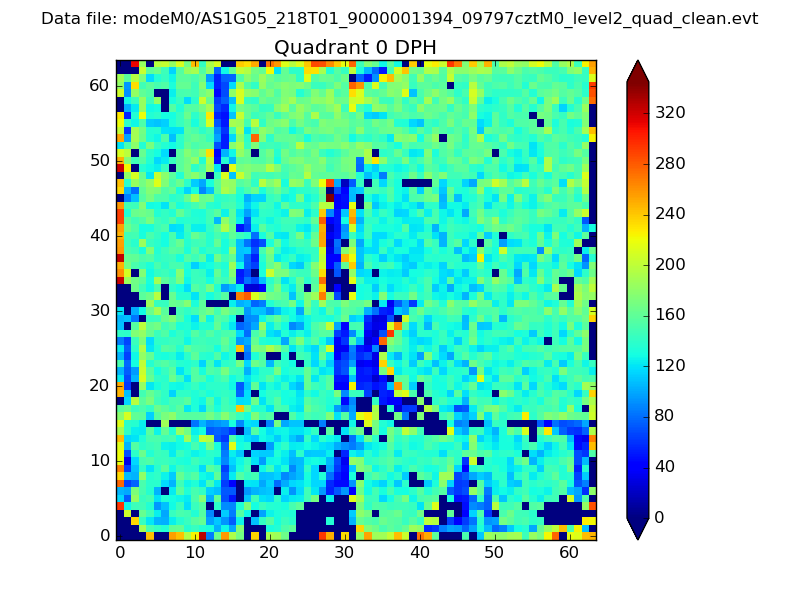 |
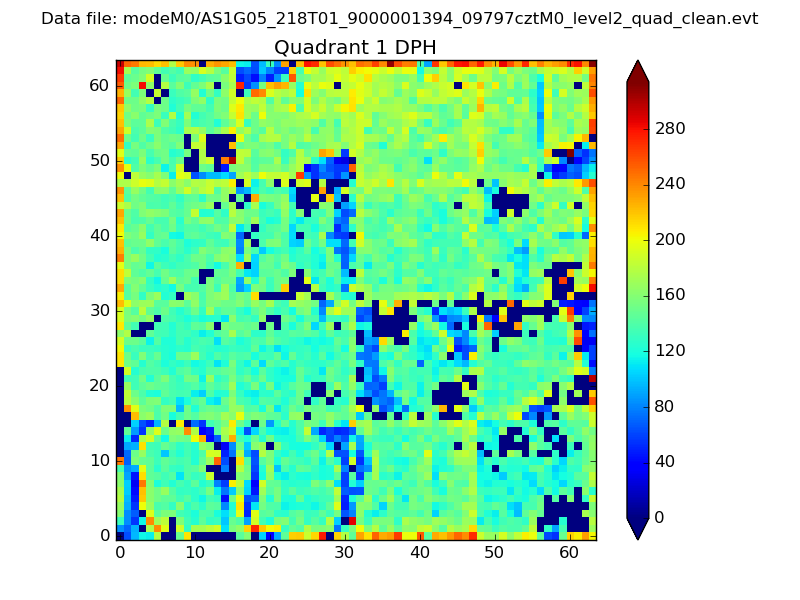 |
Quadrant B |
|---|---|---|---|
| Quadrant D | 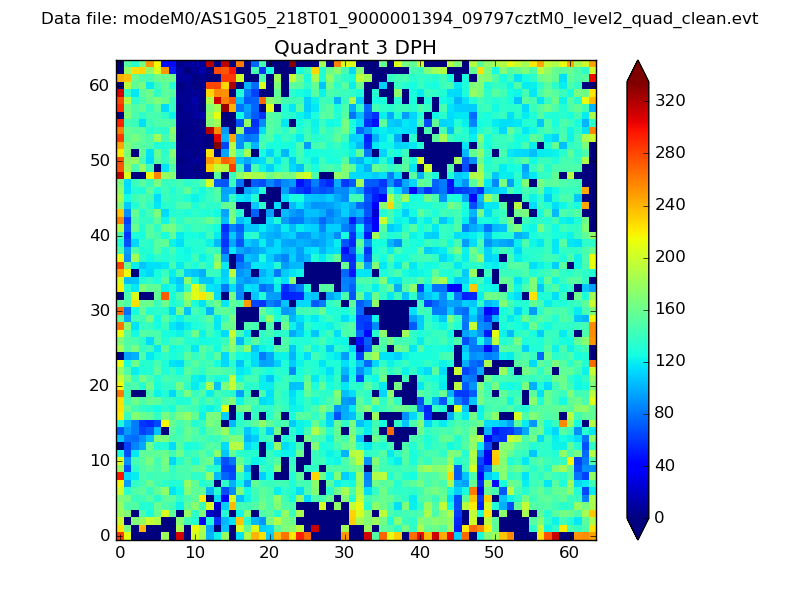 |
 |
Quadrant C |
| Plot type | Count rate plots | Images |
|---|---|---|
| Comparison with Poisson distribution Blue bars denote a histogram of data divided into 1 sec bins. Red curve is a Poisson curve with rate = median count rate of data. |
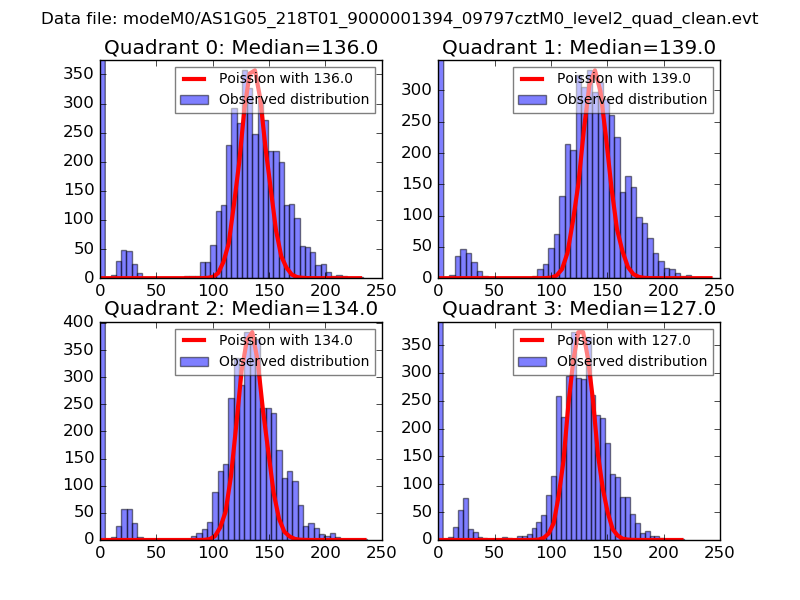 |
 |
| Quadrant-wise count rates Data is divided into 100 sec bins |
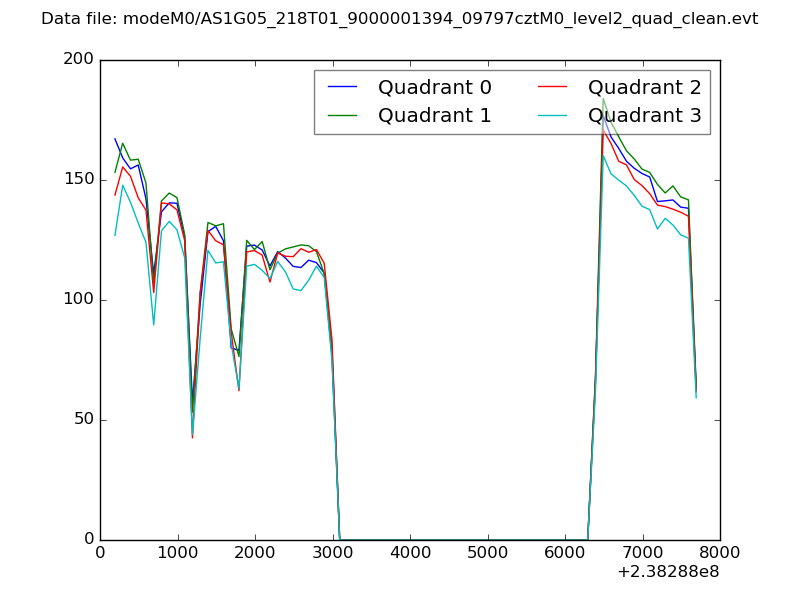 |
|
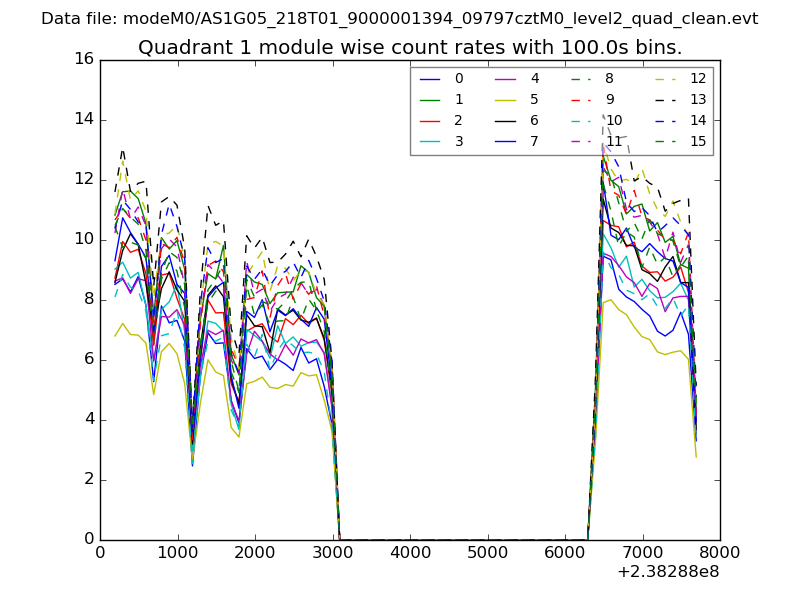
| Module-wise count rates for Quadrant A Data is divided into 100 sec bins |
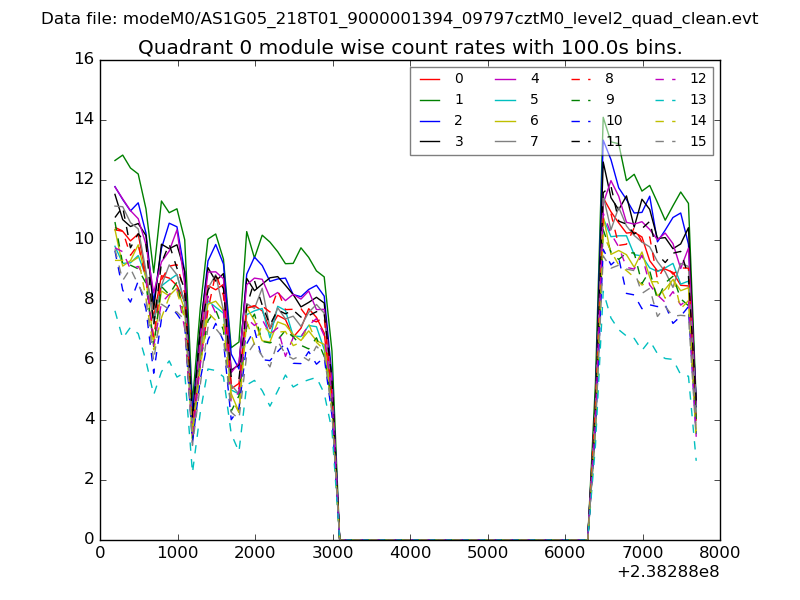 |
 |
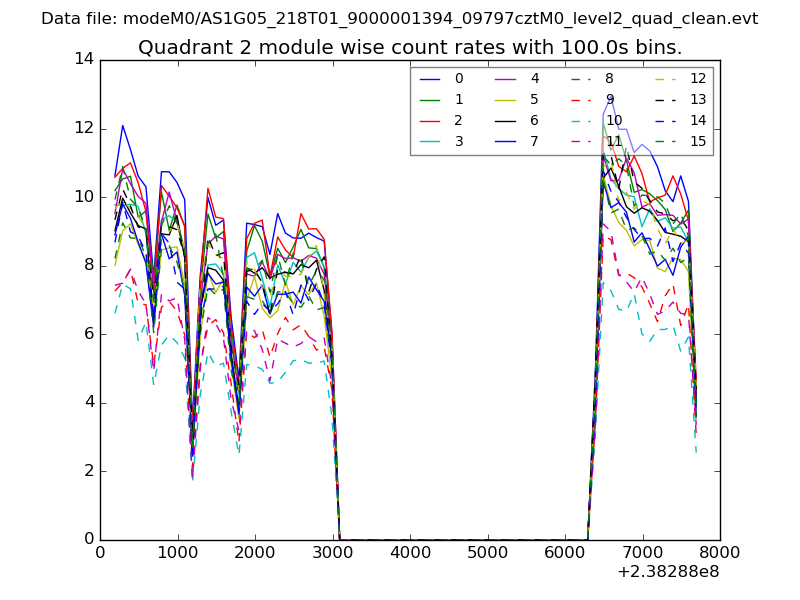
| Module-wise count rates for Quadrant B Data is divided into 100 sec bins |
 |
 |
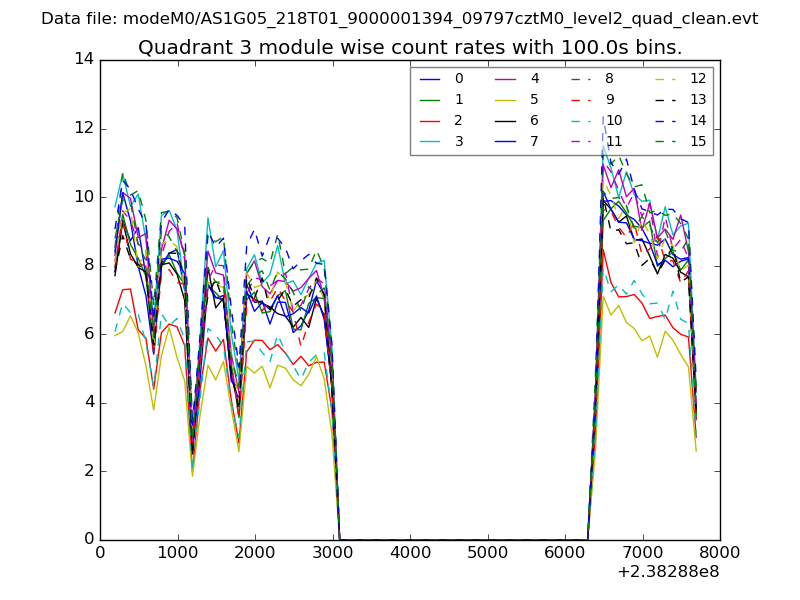
| Module-wise count rates for Quadrant C Data is divided into 100 sec bins |
 |
 |
| Module-wise count rates for Quadrant D Data is divided into 100 sec bins |
 |
 |
| Parameter | Plot |
|---|---|
| CZT HV Monitor | 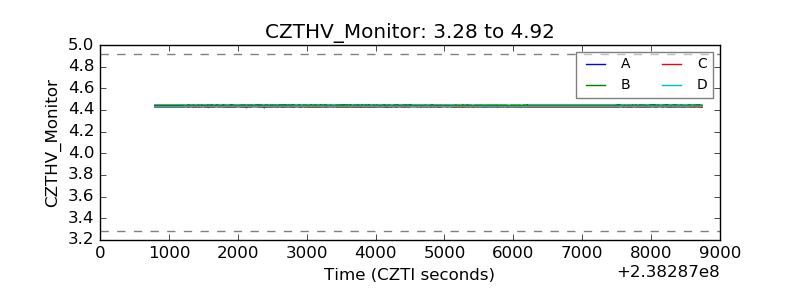 |
| D_VDD | 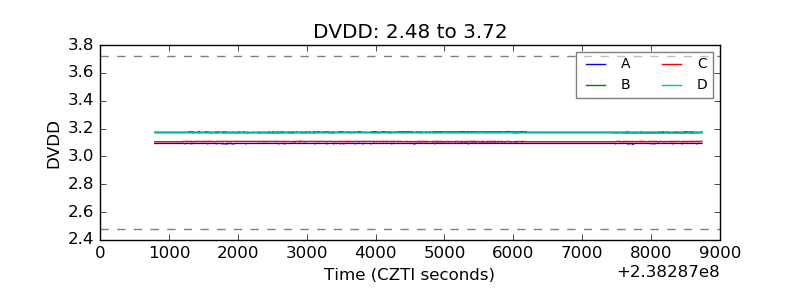 |
| Temperature 1 | 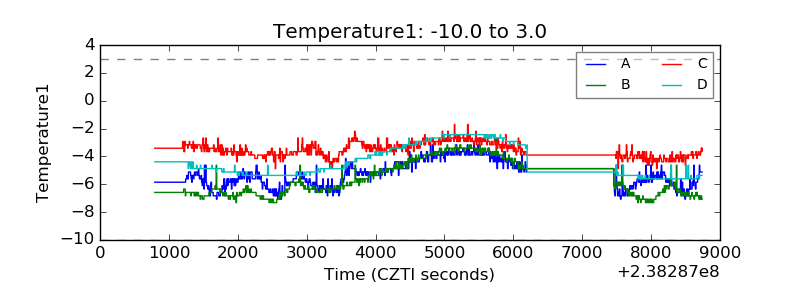 |
| Veto HV Monitor | 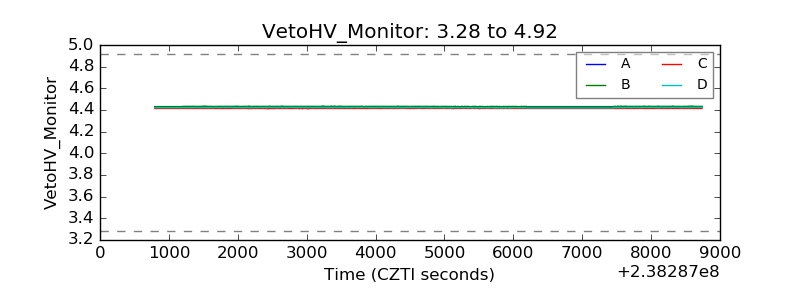 |
| Veto LLD | 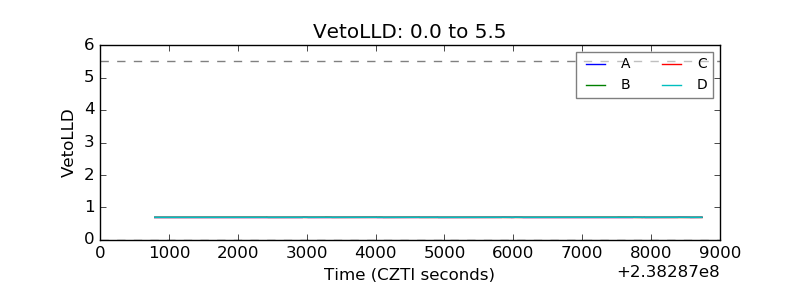 |
| Alpha Counter | 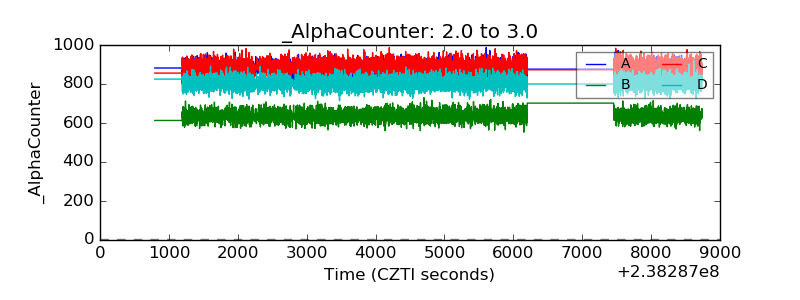 |
| _CPM_Rate | 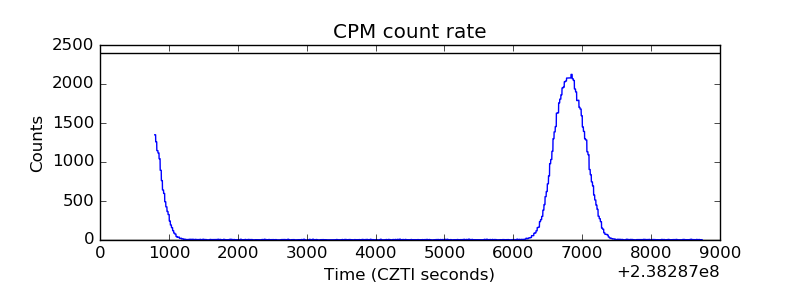 |
| CZT Counter | 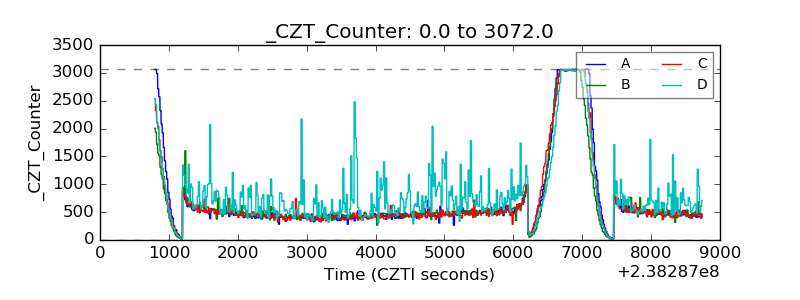 |
| +2.5 Volts monitor |  |
| +5 Volts monitor |  |
| _ROLL_ROT | 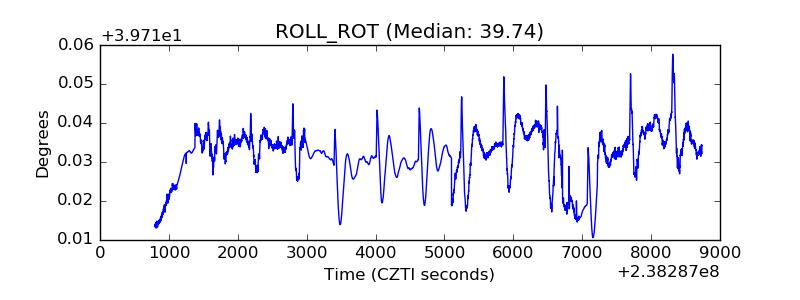 |
| _Roll_DEC | 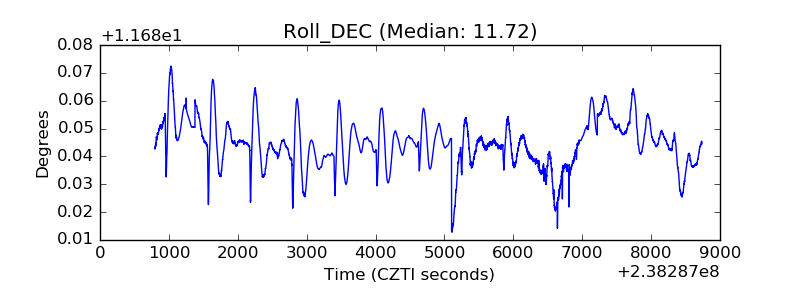 |
| _Roll_RA | 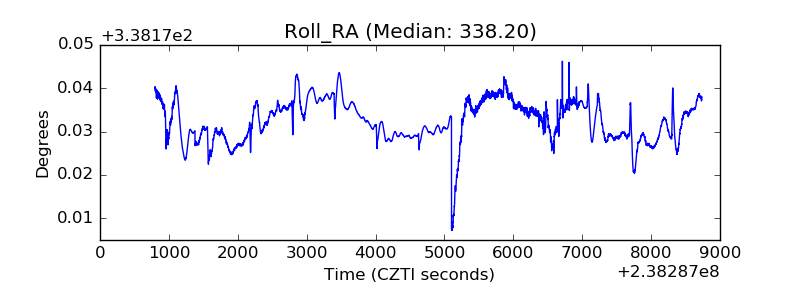 |
| Veto Counter | 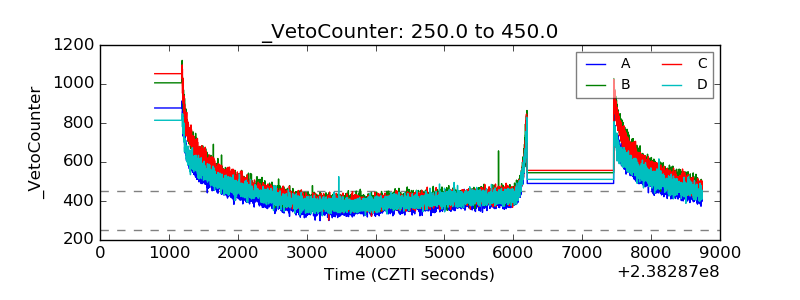 |