| Param | Original file | Final file |
|---|---|---|
| Filename | modeM0/AS1G05_218T01_9000001394_09799cztM0_level2.evt | modeM0/AS1G05_218T01_9000001394_09799cztM0_level2_quad_clean.evt |
| Size (bytes) | 877,098,240 | 154,762,560 |
| Size | 836.5 MB | 147.6 MB |
| Events in quadrant A | 5,678,395 | 982,885 |
| Events in quadrant B | 5,736,925 | 1,012,146 |
| Events in quadrant C | 5,505,404 | 968,071 |
| Events in quadrant D | 8,853,160 | 916,826 |
| Mode SS | |||
|---|---|---|---|
| Quadrant | BADHDUFLAG | Total packets | Discarded packets |
| A | 0 | 236 | 0 |
| B | 0 | 236 | 0 |
| C | 0 | 236 | 0 |
| D | 0 | 236 | 0 |
| Mode M0 | |||
|---|---|---|---|
| Quadrant | BADHDUFLAG | Total packets | Discarded packets |
| A | 0 | 24240 | 4 |
| B | 0 | 24350 | 3 |
| C | 0 | 24112 | 5 |
| D | 0 | 34277 | 5 |
| Mode M9 | |||
|---|---|---|---|
| Quadrant | BADHDUFLAG | Total packets | Discarded packets |
| A | 0 | 29 | 0 |
| B | 0 | 29 | 0 |
| C | 0 | 29 | 0 |
| D | 0 | 30 | 0 |
| Quadrant | Total seconds | Saturated seconds | Saturation percentage |
|---|---|---|---|
| A | 11673 | 87 | 0.745310% |
| B | 11673 | 113 | 0.968046% |
| C | 11672 | 70 | 0.599726% |
| D | 11672 | 358 | 3.067169% |
Noise dominated data is calculated using 1-second bins in cleaned event files. If a bin has >2000 counts, and if more than 50% of those come from <1% of pixels, then it is considered to be noise-dominated and hence unusable.
| Quadrant | # 1 sec bins | Bins with >0 counts | Bins with >2000 counts | High rate bins dominated by noise | Noise dominated (total time) | Noise dominated (detector-on time) | Marked lightcurve |
|---|---|---|---|---|---|---|---|
| A | 14288 | 11675 | 0 | 0 | 0.00% | 0.00% | 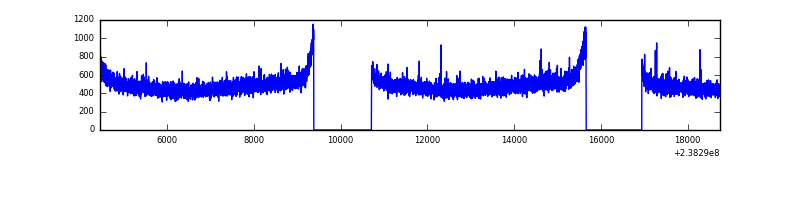 |
| B | 14288 | 11675 | 1 | 1 | 0.01% | 0.01% | 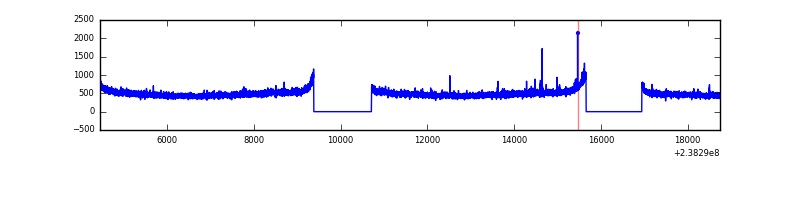 |
| C | 14288 | 11675 | 0 | 0 | 0.00% | 0.00% | 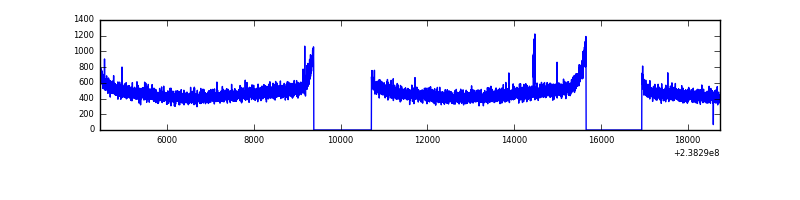 |
| D | 14288 | 11675 | 232 | 232 | 1.62% | 1.99% | 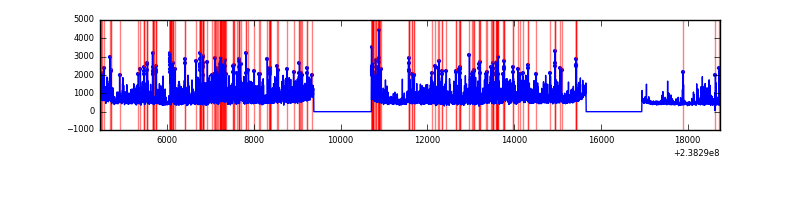 |
Top three noisy pixels from each quadrant. If the there are fewer than three noisy pixels in the level2.evt file, extra rows are filled as -1
| Pixel properties | Quadrant properties | ||||||
|---|---|---|---|---|---|---|---|
| Quadrant | DetID | PixID | Counts | Sigma | Mean | Median | Sigma |
| A | 0 | 226 | 13430 | 40.57 | 1471 | 1441 | 295.5 |
| A | 12 | 194 | 11696 | 34.7 | 1471 | 1441 | 295.5 |
| A | 1 | 162 | 10070 | 29.2 | 1471 | 1441 | 295.5 |
| B | 12 | 111 | 31166 | 106.34 | 1471 | 1437 | 279.6 |
| B | 11 | 111 | 25778 | 87.07 | 1471 | 1437 | 279.6 |
| B | 14 | 111 | 20412 | 67.87 | 1471 | 1437 | 279.6 |
| C | 13 | 61 | 10416 | 27.63 | 1409 | 1417 | 325.6 |
| C | 5 | 128 | 7805 | 19.62 | 1409 | 1417 | 325.6 |
| C | 14 | 234 | 5208 | 11.64 | 1409 | 1417 | 325.6 |
| D | 1 | 52 | 3184083 | 8850.62 | 1386 | 1358 | 359.6 |
| D | 2 | 152 | 173915 | 479.85 | 1386 | 1358 | 359.6 |
| D | 9 | 85 | 76087 | 207.81 | 1386 | 1358 | 359.6 |
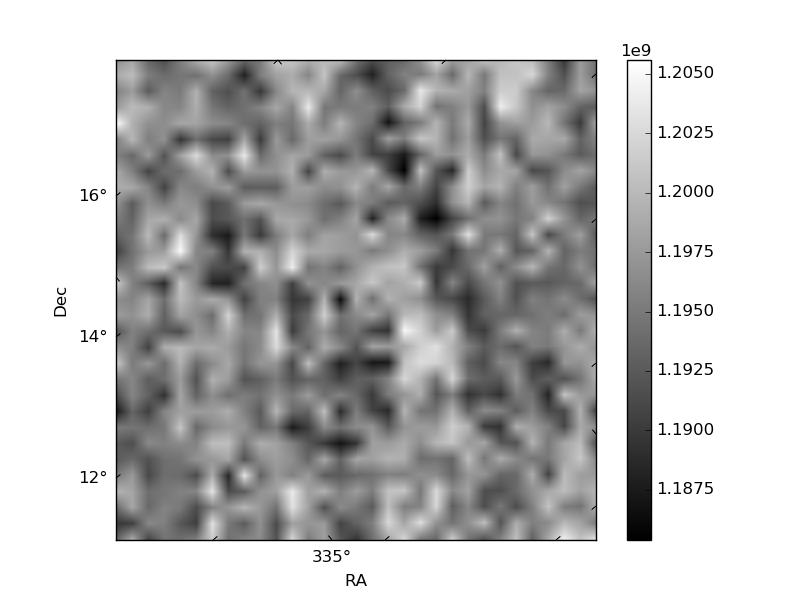
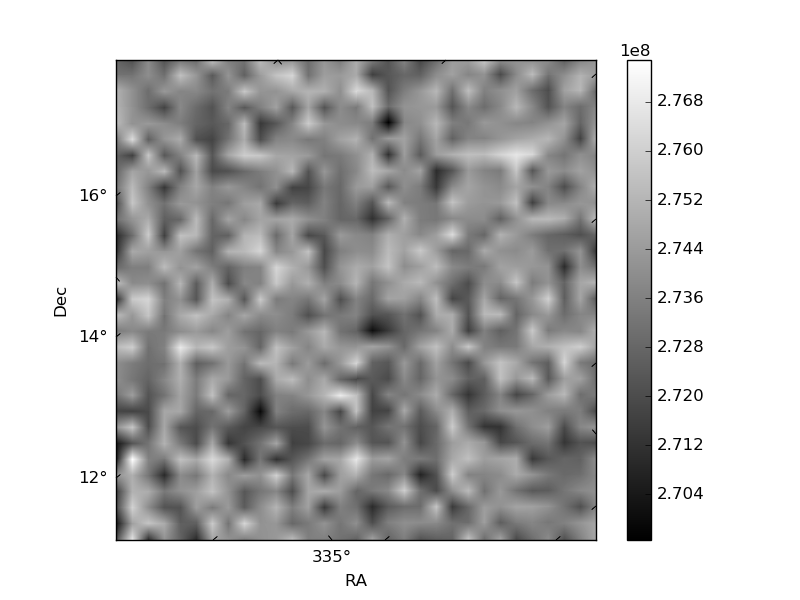
Histogram calculated using DETX and DETY for each event in the final _common_clean file
| Quadrant A | 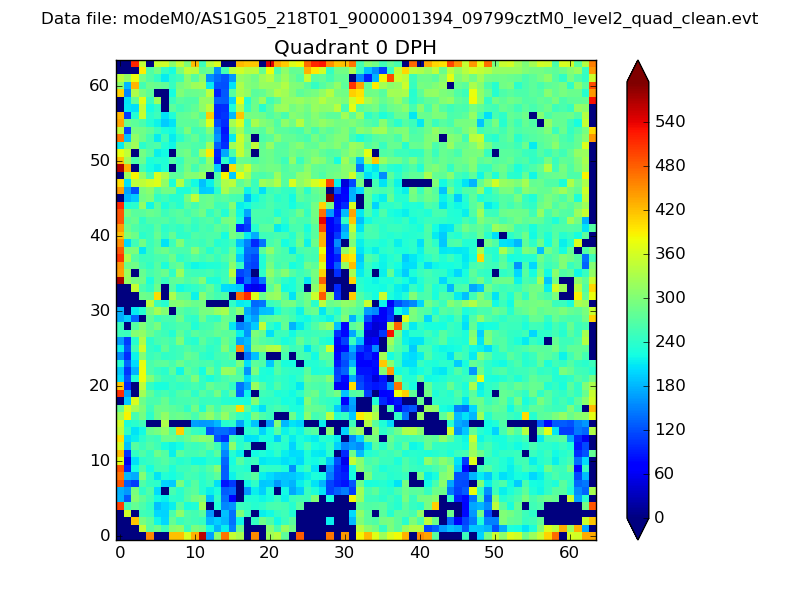 |
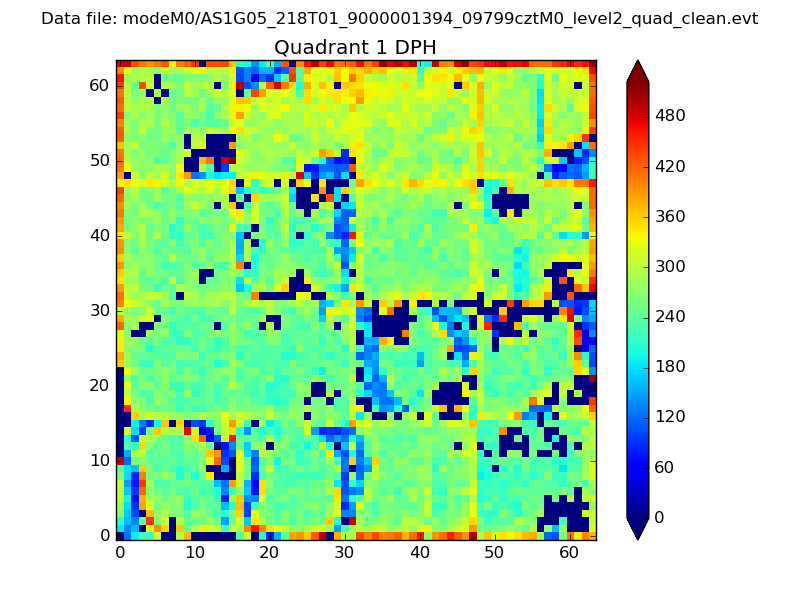 |
Quadrant B |
|---|---|---|---|
| Quadrant D |  |
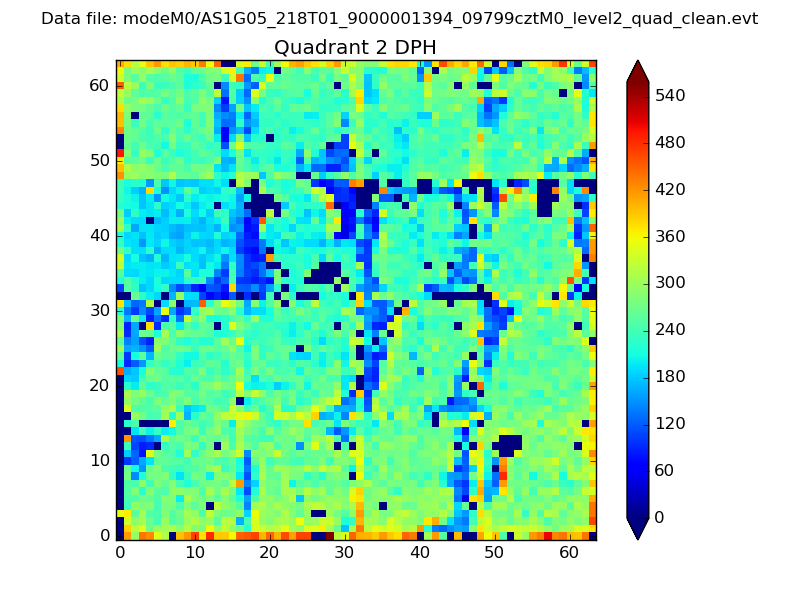 |
Quadrant C |
| Plot type | Count rate plots | Images |
|---|---|---|
| Comparison with Poisson distribution Blue bars denote a histogram of data divided into 1 sec bins. Red curve is a Poisson curve with rate = median count rate of data. |
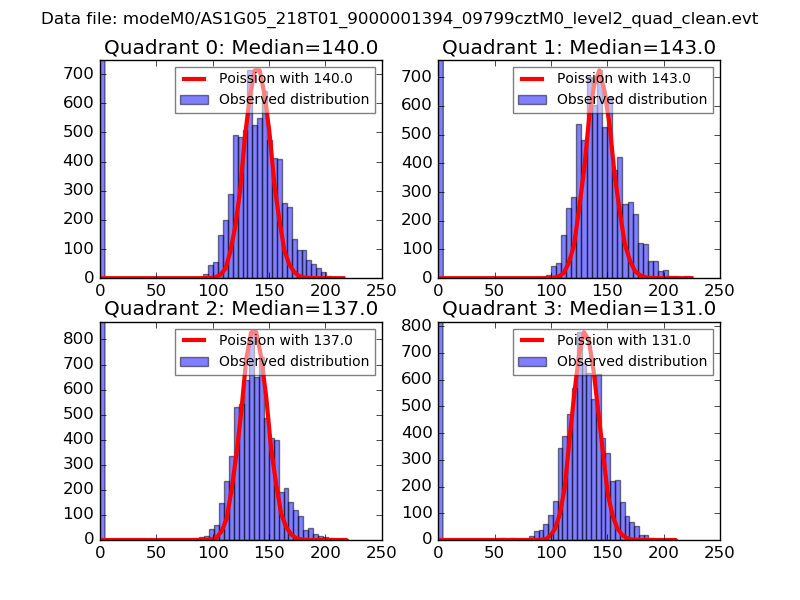 |
 |
| Quadrant-wise count rates Data is divided into 100 sec bins |
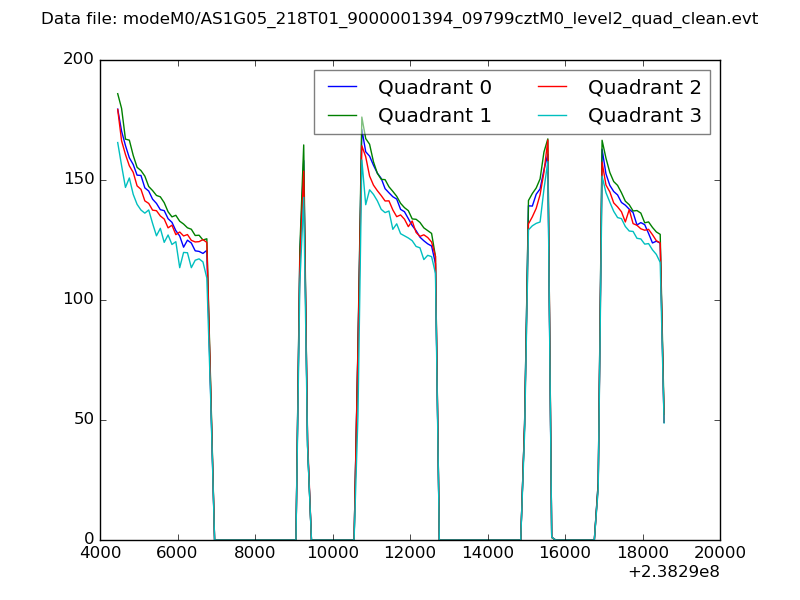 |
|
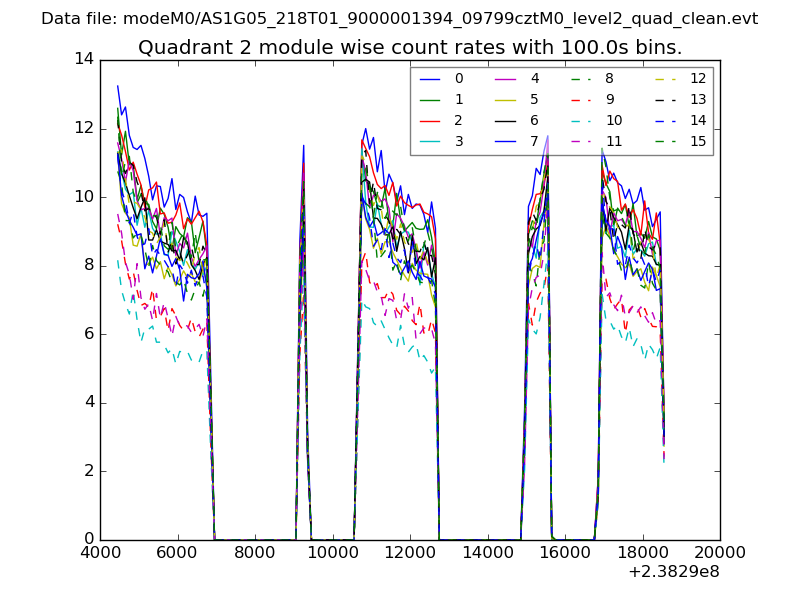
| Module-wise count rates for Quadrant A Data is divided into 100 sec bins |
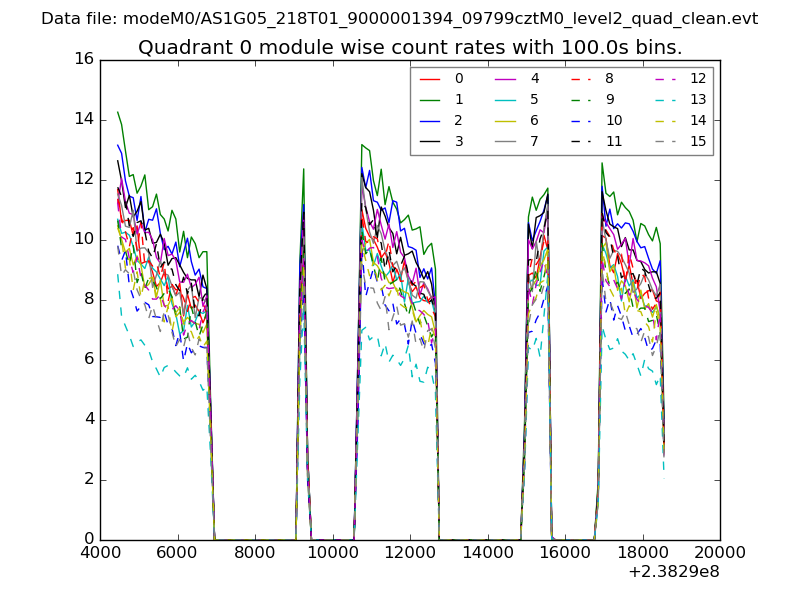 |
 |
| Module-wise count rates for Quadrant B Data is divided into 100 sec bins |
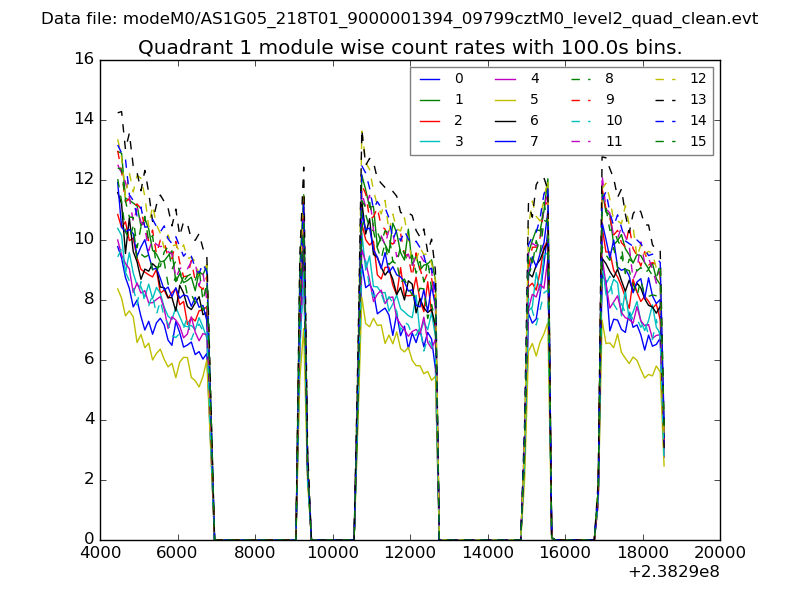 |
 |
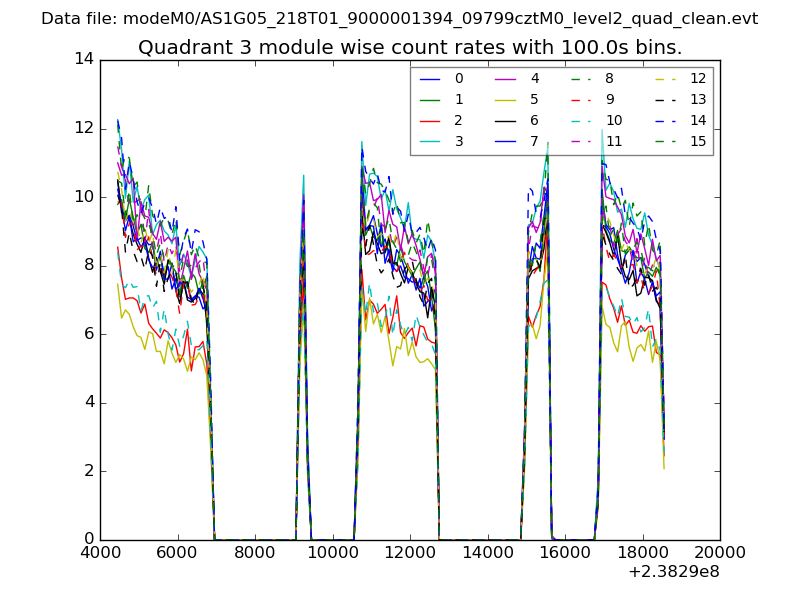
| Module-wise count rates for Quadrant C Data is divided into 100 sec bins |
 |
 |
| Module-wise count rates for Quadrant D Data is divided into 100 sec bins |
 |
 |
| Parameter | Plot |
|---|---|
| CZT HV Monitor | 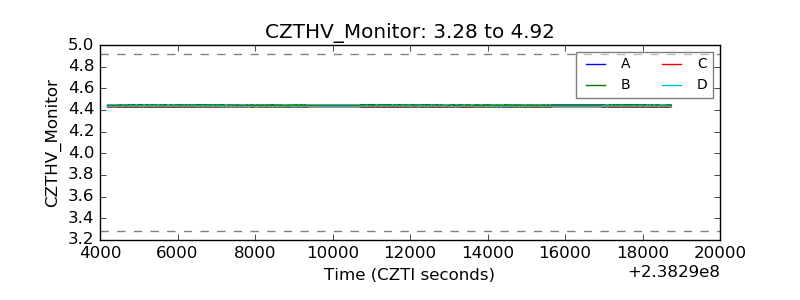 |
| D_VDD | 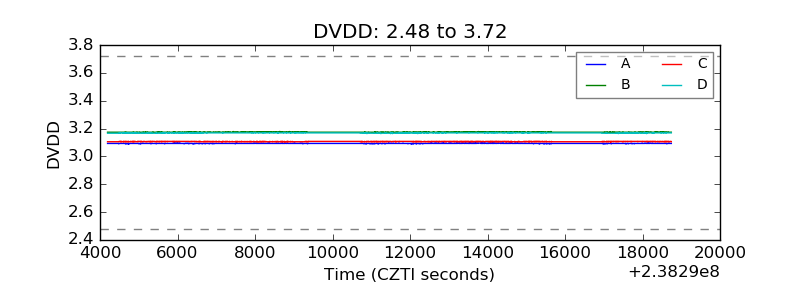 |
| Temperature 1 | 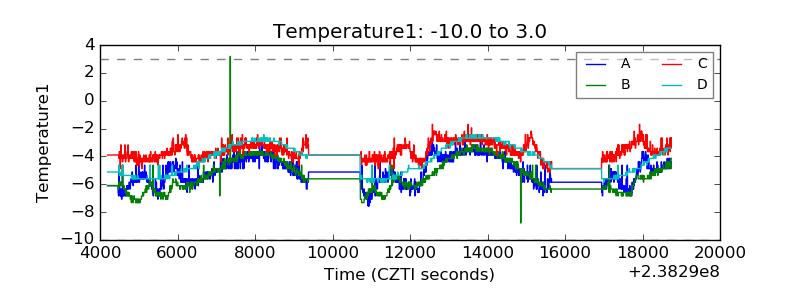 |
| Veto HV Monitor | 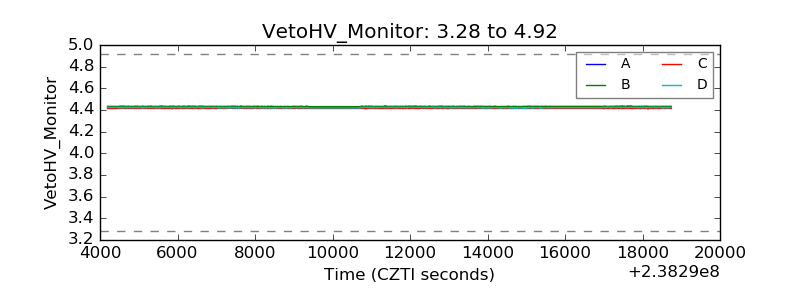 |
| Veto LLD | 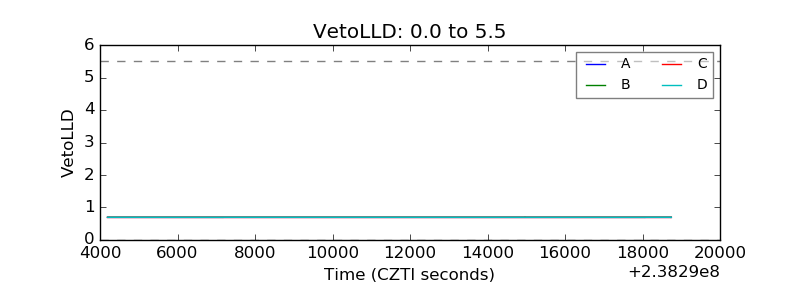 |
| Alpha Counter | 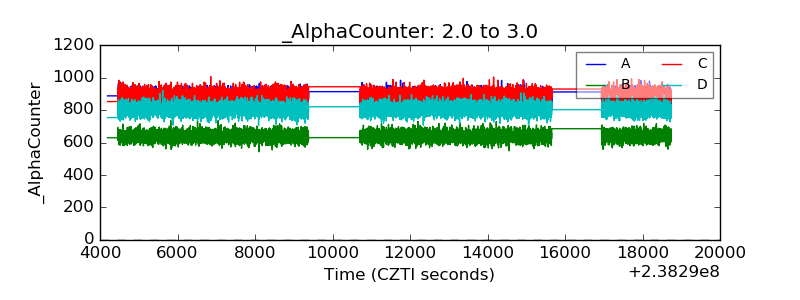 |
| _CPM_Rate | 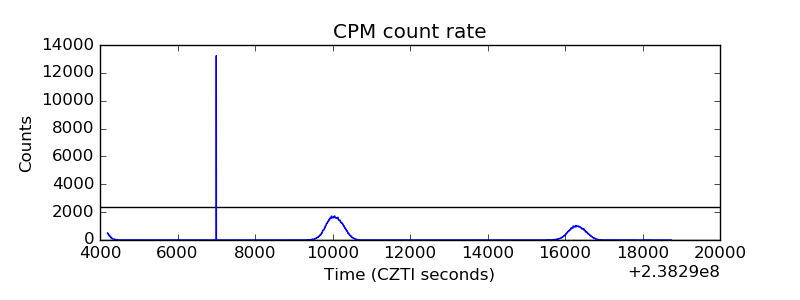 |
| CZT Counter | 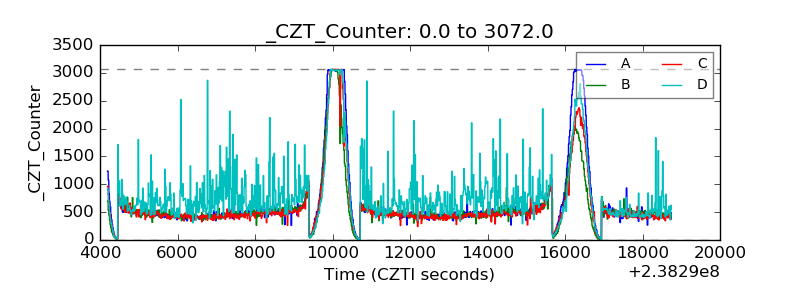 |
| +2.5 Volts monitor |  |
| +5 Volts monitor |  |
| _ROLL_ROT | 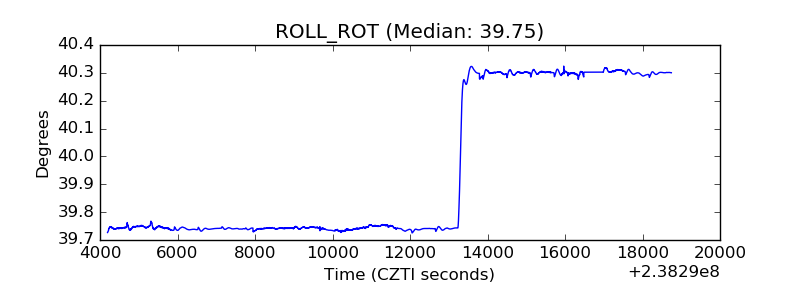 |
| _Roll_DEC | 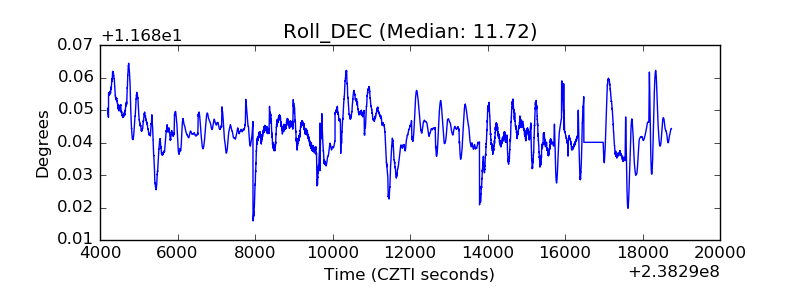 |
| _Roll_RA | 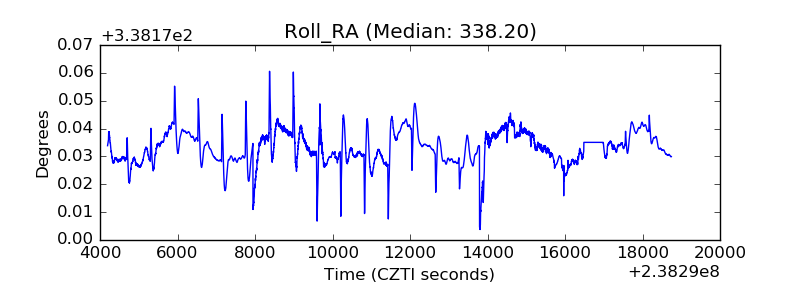 |
| Veto Counter | 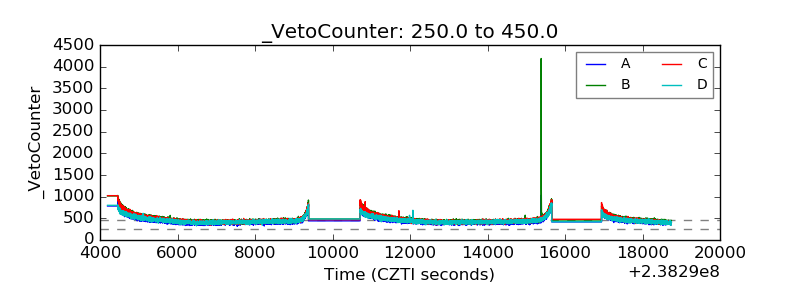 |