| Param | Original file | Final file |
|---|---|---|
| Filename | modeM0/AS1G05_218T01_9000001394_09801cztM0_level2.evt | modeM0/AS1G05_218T01_9000001394_09801cztM0_level2_quad_clean.evt |
| Size (bytes) | 562,262,400 | 87,433,920 |
| Size | 536.2 MB | 83.4 MB |
| Events in quadrant A | 3,433,184 | 534,737 |
| Events in quadrant B | 3,487,138 | 557,747 |
| Events in quadrant C | 3,261,294 | 552,103 |
| Events in quadrant D | 6,372,551 | 515,891 |
| Mode SS | |||
|---|---|---|---|
| Quadrant | BADHDUFLAG | Total packets | Discarded packets |
| A | 0 | 142 | 0 |
| B | 0 | 142 | 0 |
| C | 0 | 142 | 0 |
| D | 0 | 142 | 0 |
| Mode M0 | |||
|---|---|---|---|
| Quadrant | BADHDUFLAG | Total packets | Discarded packets |
| A | 0 | 14836 | 3 |
| B | 0 | 14881 | 2 |
| C | 0 | 14538 | 2 |
| D | 0 | 23842 | 2 |
| Mode M9 | |||
|---|---|---|---|
| Quadrant | BADHDUFLAG | Total packets | Discarded packets |
| A | 0 | 12 | 0 |
| B | 0 | 12 | 0 |
| C | 0 | 12 | 0 |
| D | 0 | 13 | 0 |
| Quadrant | Total seconds | Saturated seconds | Saturation percentage |
|---|---|---|---|
| A | 6992 | 126 | 1.802059% |
| B | 6992 | 138 | 1.973684% |
| C | 6992 | 54 | 0.772311% |
| D | 6992 | 500 | 7.151030% |
Noise dominated data is calculated using 1-second bins in cleaned event files. If a bin has >2000 counts, and if more than 50% of those come from <1% of pixels, then it is considered to be noise-dominated and hence unusable.
| Quadrant | # 1 sec bins | Bins with >0 counts | Bins with >2000 counts | High rate bins dominated by noise | Noise dominated (total time) | Noise dominated (detector-on time) | Marked lightcurve |
|---|---|---|---|---|---|---|---|
| A | 7872 | 6993 | 4 | 4 | 0.05% | 0.06% | 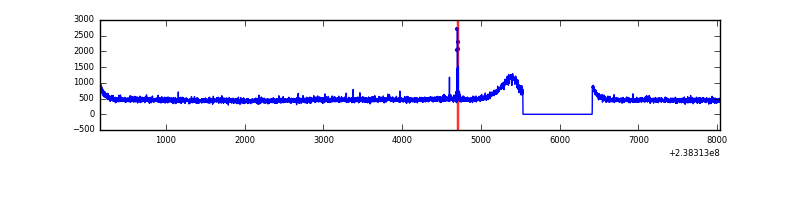 |
| B | 7872 | 6993 | 10 | 10 | 0.13% | 0.14% | 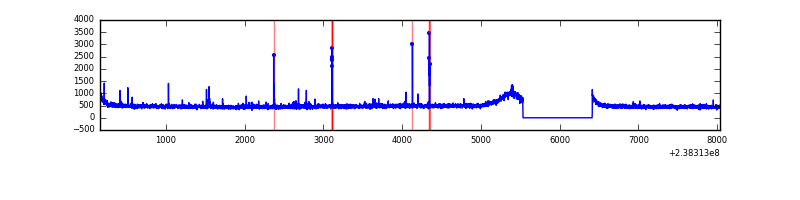 |
| C | 7872 | 6993 | 0 | 0 | 0.00% | 0.00% | 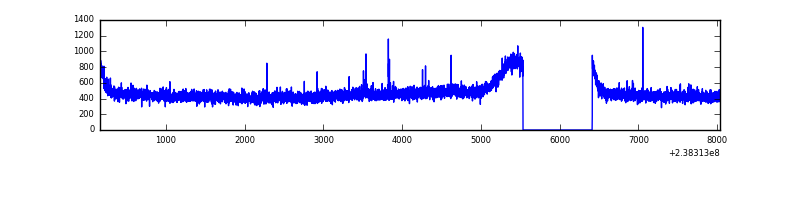 |
| D | 7872 | 6993 | 324 | 324 | 4.12% | 4.63% | 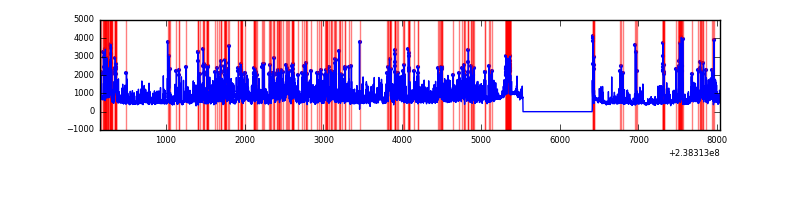 |
Top three noisy pixels from each quadrant. If the there are fewer than three noisy pixels in the level2.evt file, extra rows are filled as -1
| Pixel properties | Quadrant properties | ||||||
|---|---|---|---|---|---|---|---|
| Quadrant | DetID | PixID | Counts | Sigma | Mean | Median | Sigma |
| A | 13 | 248 | 24120 | 129.03 | 887 | 872 | 180.2 |
| A | 0 | 226 | 8114 | 40.2 | 887 | 872 | 180.2 |
| A | 12 | 194 | 7267 | 35.49 | 887 | 872 | 180.2 |
| B | 10 | 252 | 21458 | 121.17 | 874 | 855 | 170.0 |
| B | 12 | 111 | 18559 | 104.12 | 874 | 855 | 170.0 |
| B | 15 | 85 | 16929 | 94.54 | 874 | 855 | 170.0 |
| C | 14 | 234 | 6224 | 27.69 | 833 | 838 | 194.5 |
| C | 10 | 22 | 6073 | 26.91 | 833 | 838 | 194.5 |
| C | 13 | 61 | 6058 | 26.84 | 833 | 838 | 194.5 |
| D | 1 | 52 | 2958943 | 13717.31 | 819 | 802 | 215.7 |
| D | 2 | 152 | 110876 | 510.43 | 819 | 802 | 215.7 |
| D | 9 | 85 | 78635 | 360.92 | 819 | 802 | 215.7 |
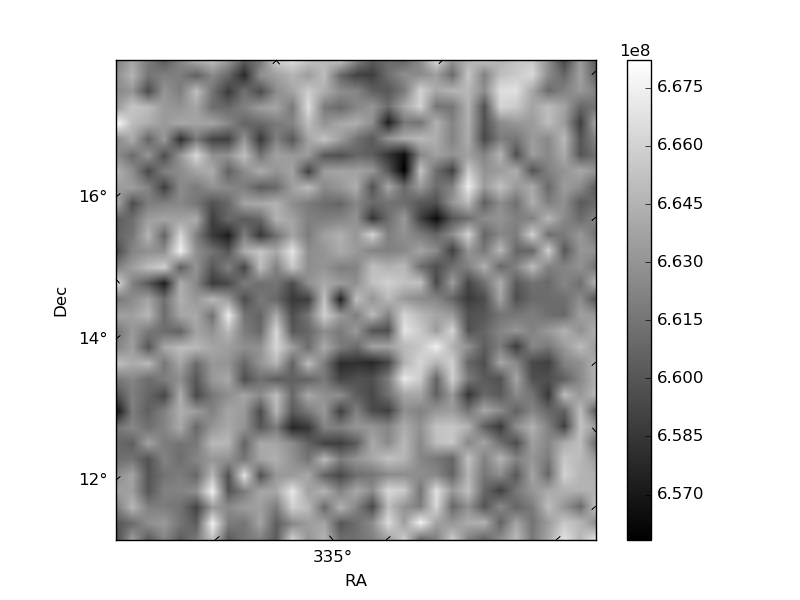
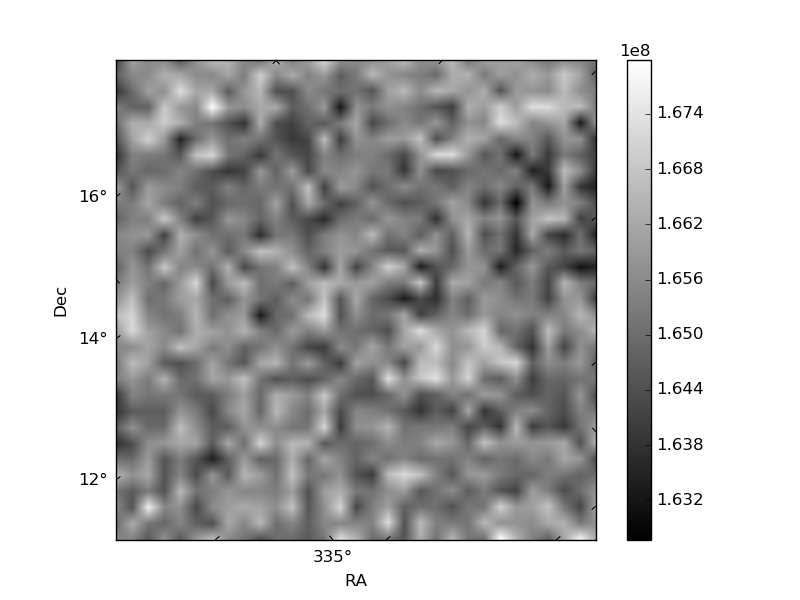
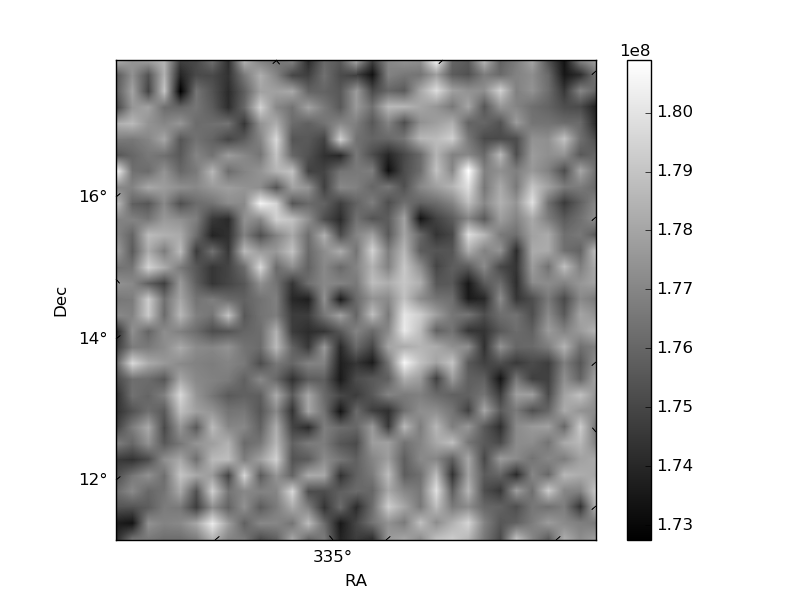
Histogram calculated using DETX and DETY for each event in the final _common_clean file
| Quadrant A | 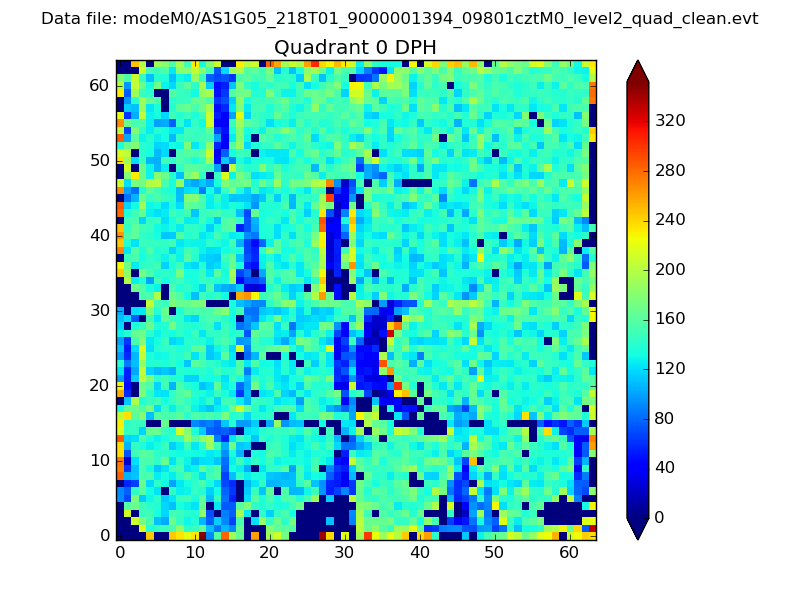 |
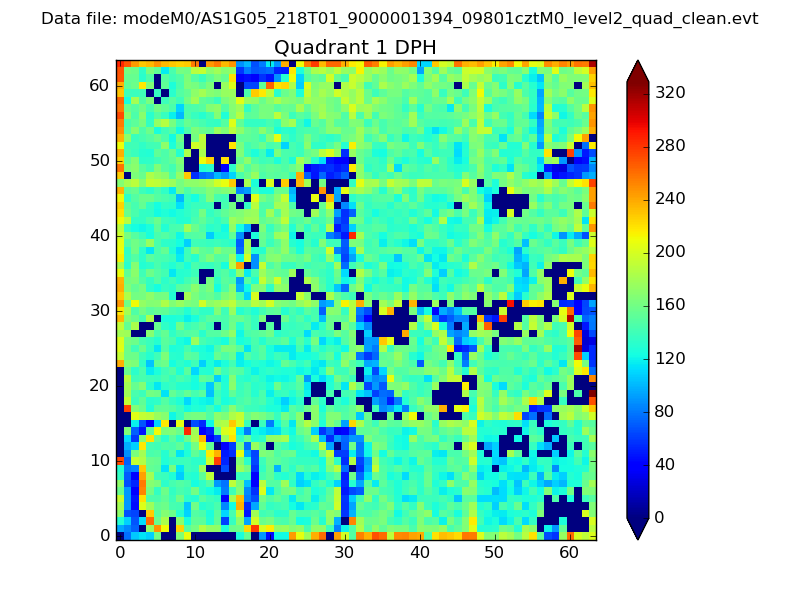 |
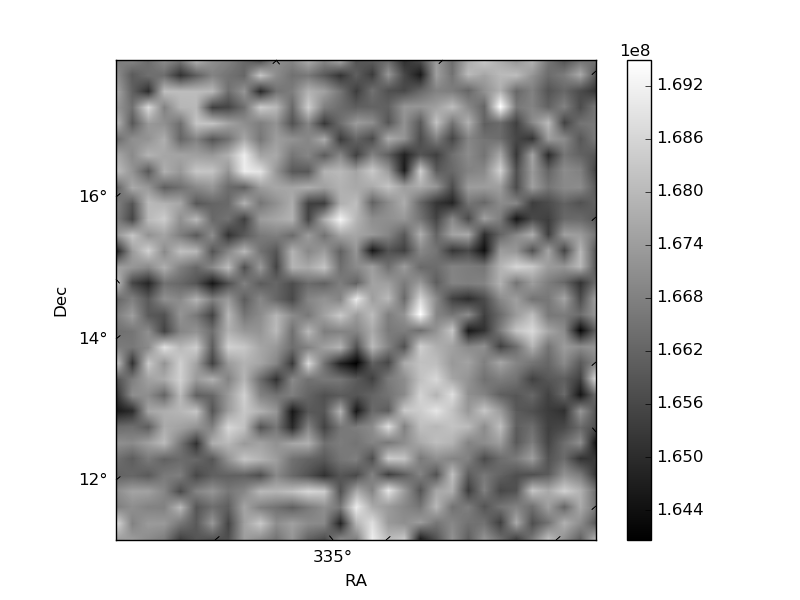
Quadrant B |
|---|---|---|---|
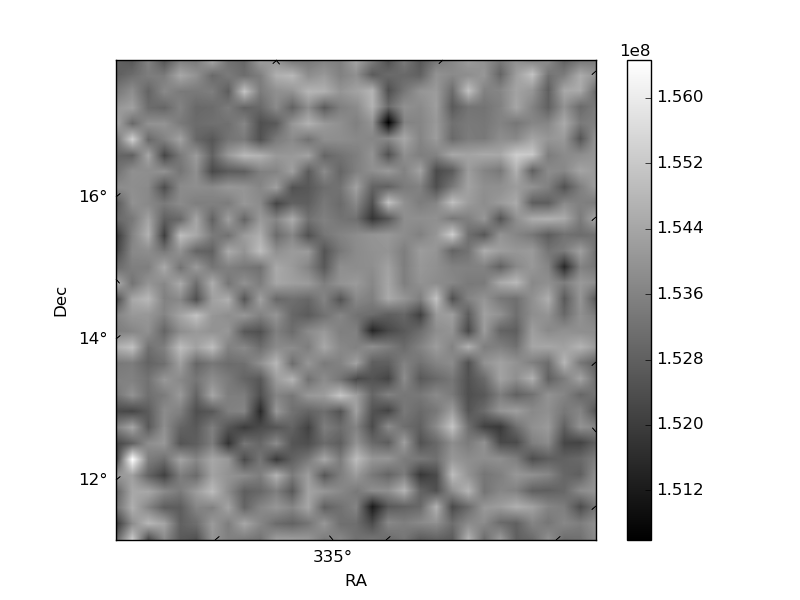
| Quadrant D | 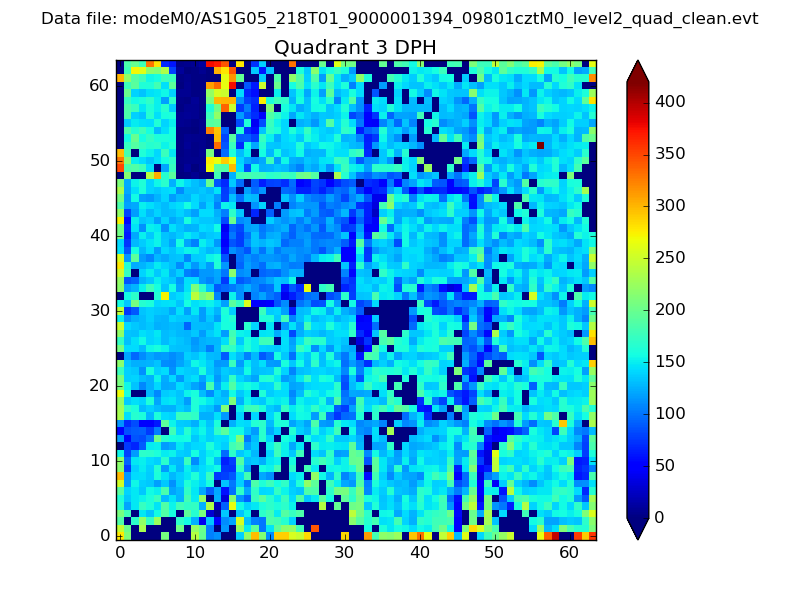 |
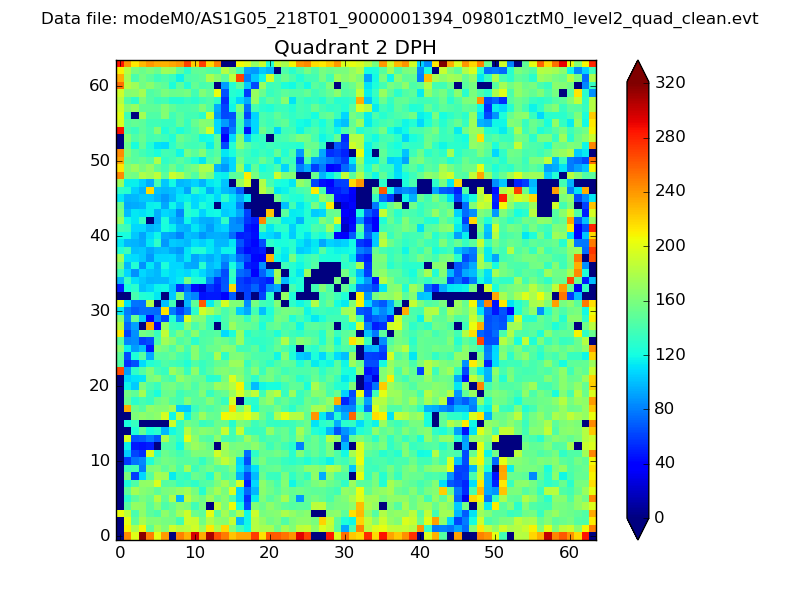 |
Quadrant C |
| Plot type | Count rate plots | Images |
|---|---|---|
| Comparison with Poisson distribution Blue bars denote a histogram of data divided into 1 sec bins. Red curve is a Poisson curve with rate = median count rate of data. |
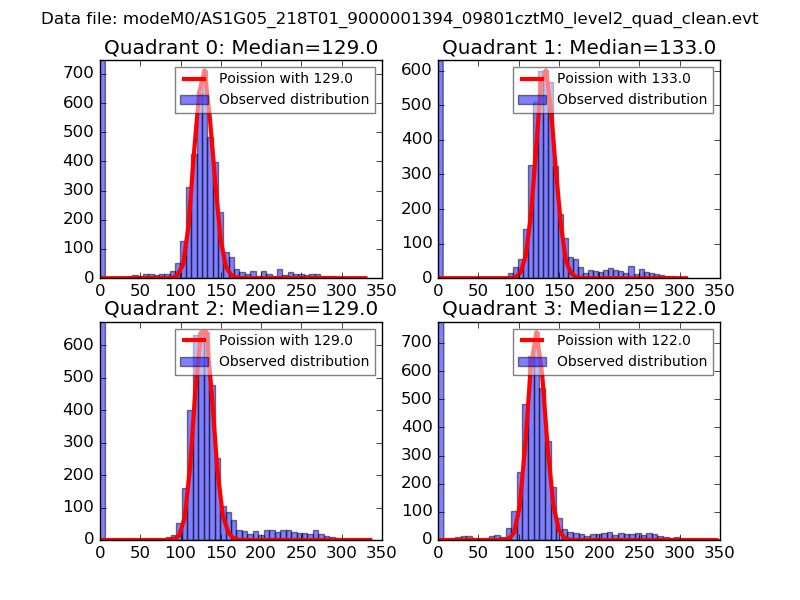 |
 |
| Quadrant-wise count rates Data is divided into 100 sec bins |
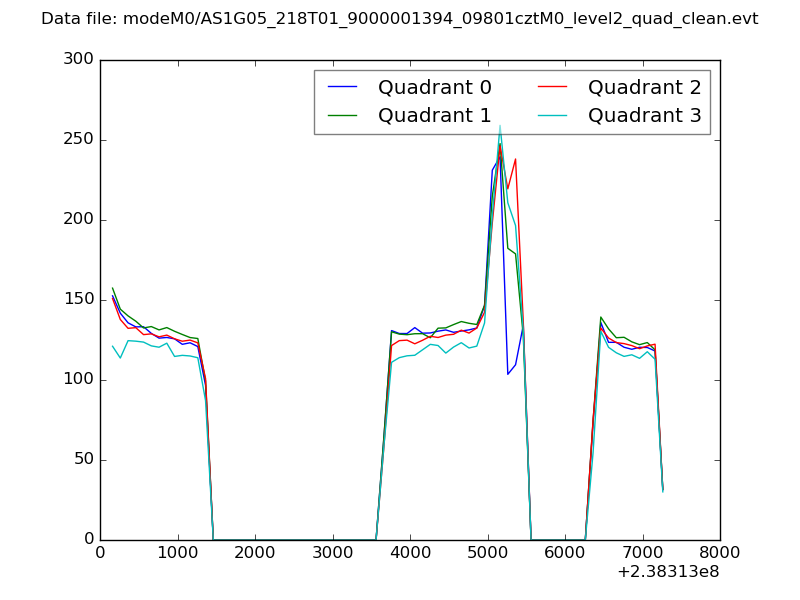 |
|
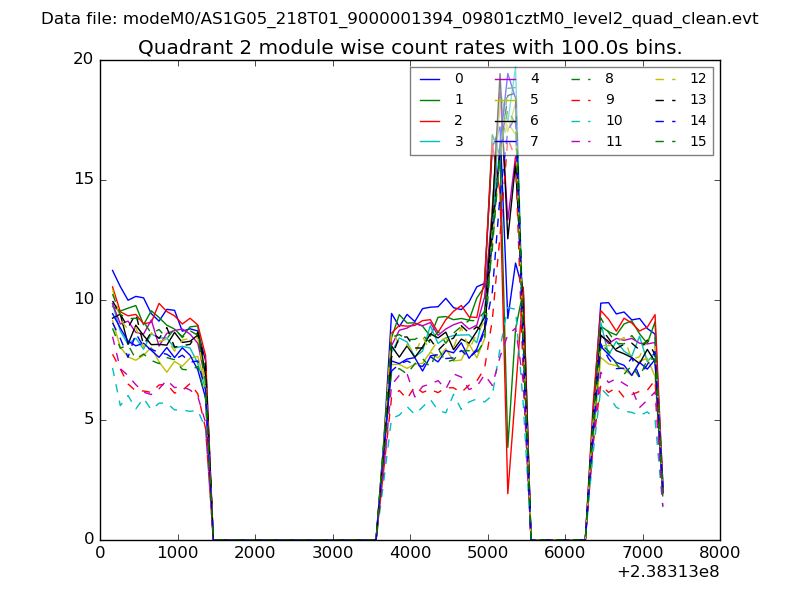
| Module-wise count rates for Quadrant A Data is divided into 100 sec bins |
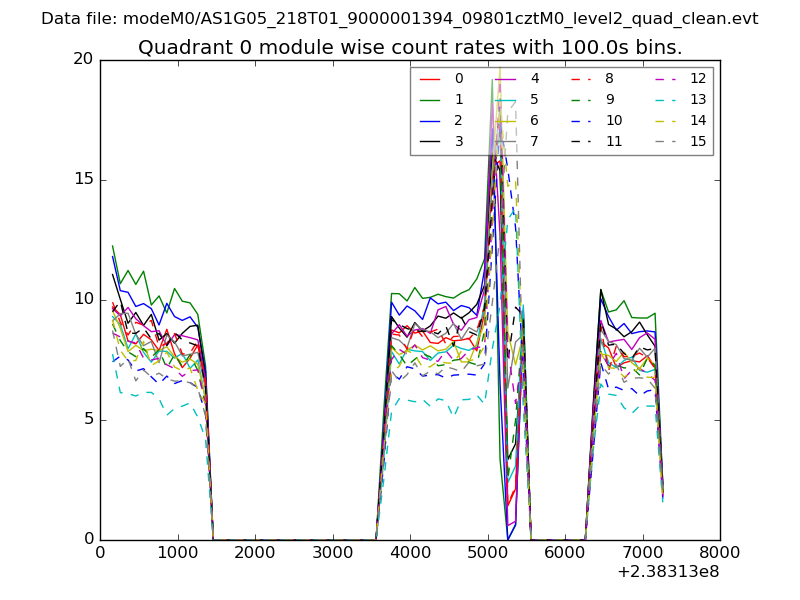 |
 |
| Module-wise count rates for Quadrant B Data is divided into 100 sec bins |
 |
 |
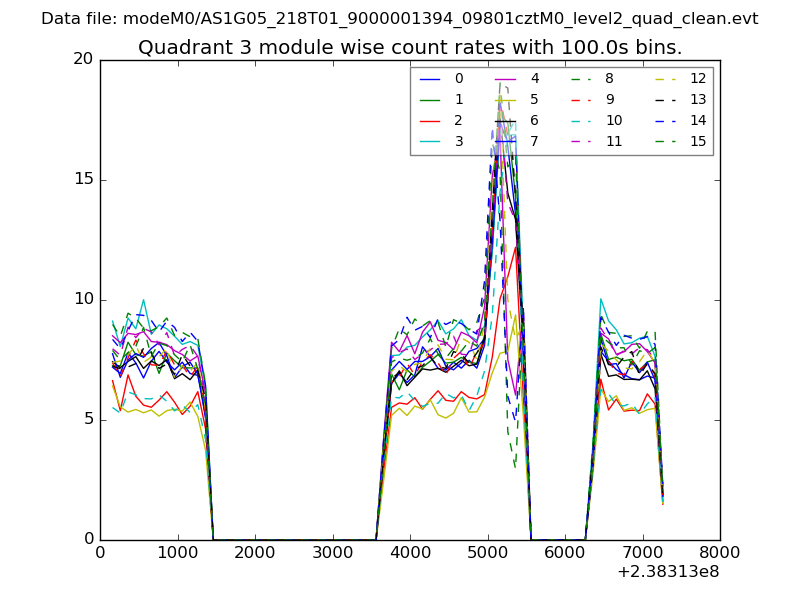
| Module-wise count rates for Quadrant C Data is divided into 100 sec bins |
 |
 |
| Module-wise count rates for Quadrant D Data is divided into 100 sec bins |
 |
 |
| Parameter | Plot |
|---|---|
| CZT HV Monitor | 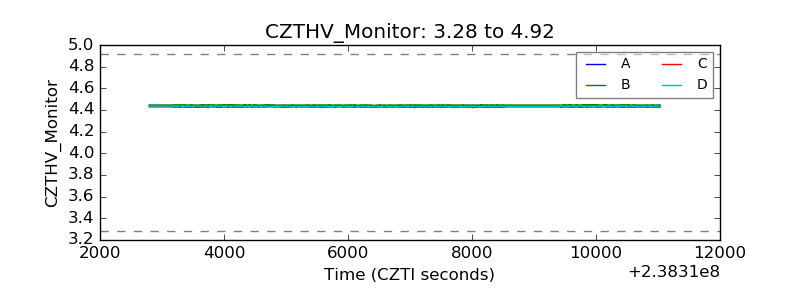 |
| D_VDD | 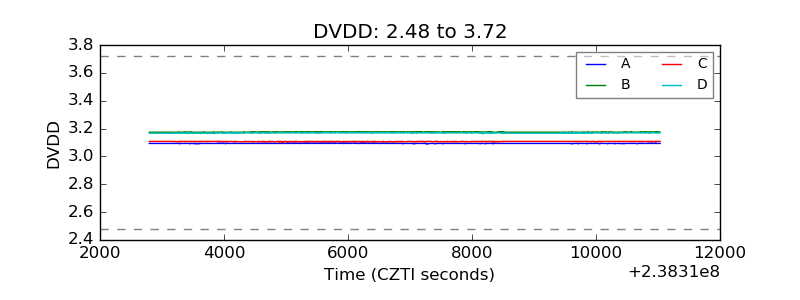 |
| Temperature 1 | 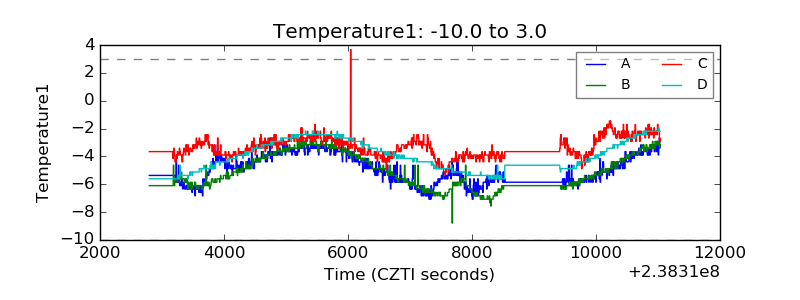 |
| Veto HV Monitor | 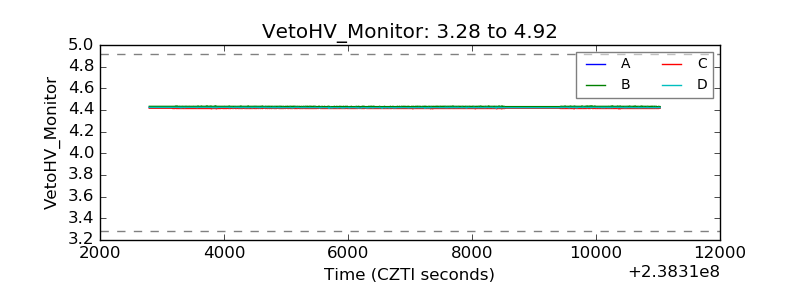 |
| Veto LLD | 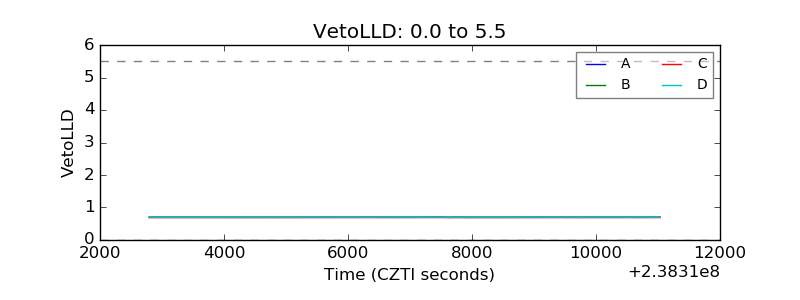 |
| Alpha Counter | 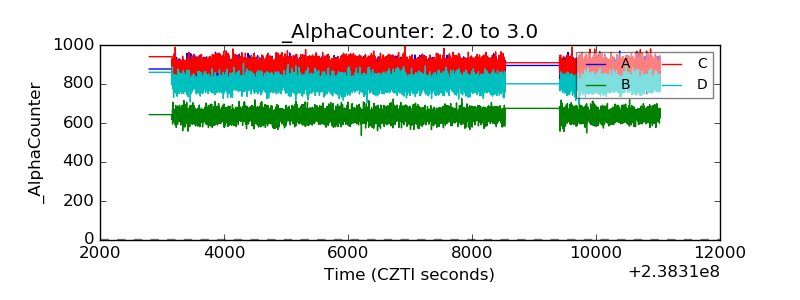 |
| _CPM_Rate | 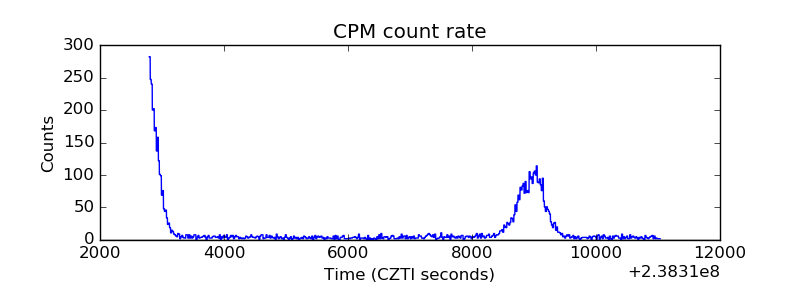 |
| CZT Counter | 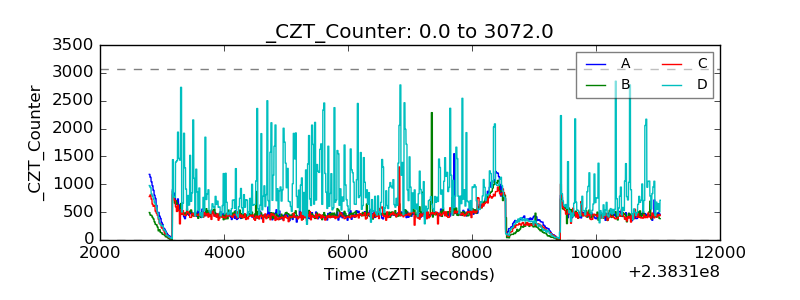 |
| +2.5 Volts monitor |  |
| +5 Volts monitor |  |
| _ROLL_ROT | 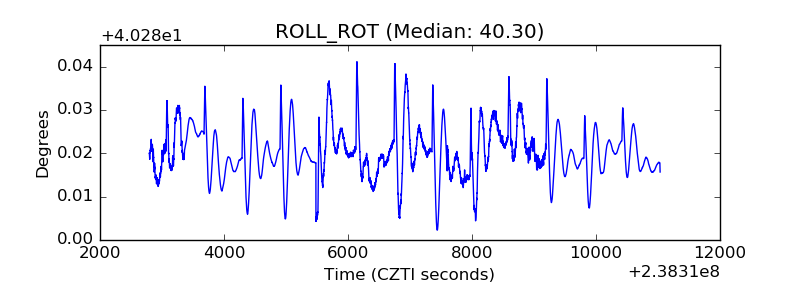 |
| _Roll_DEC |  |
| _Roll_RA | 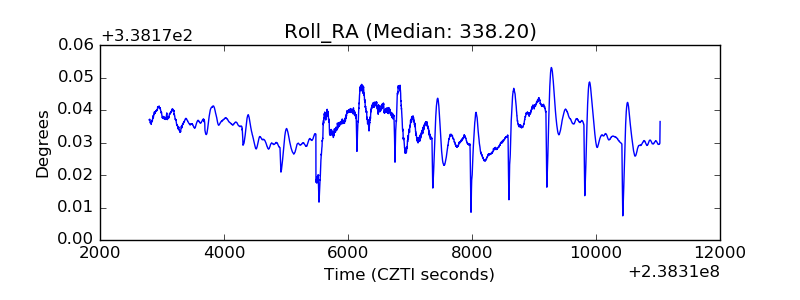 |
| Veto Counter | 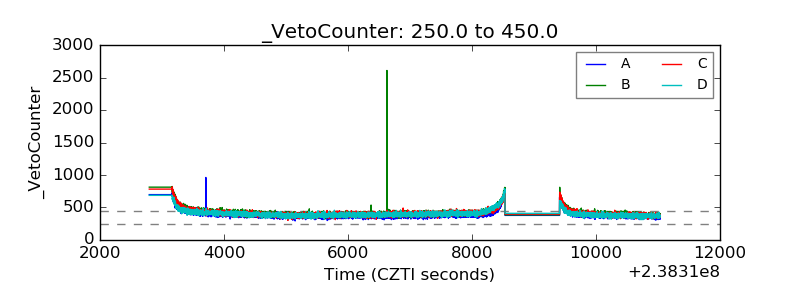 |